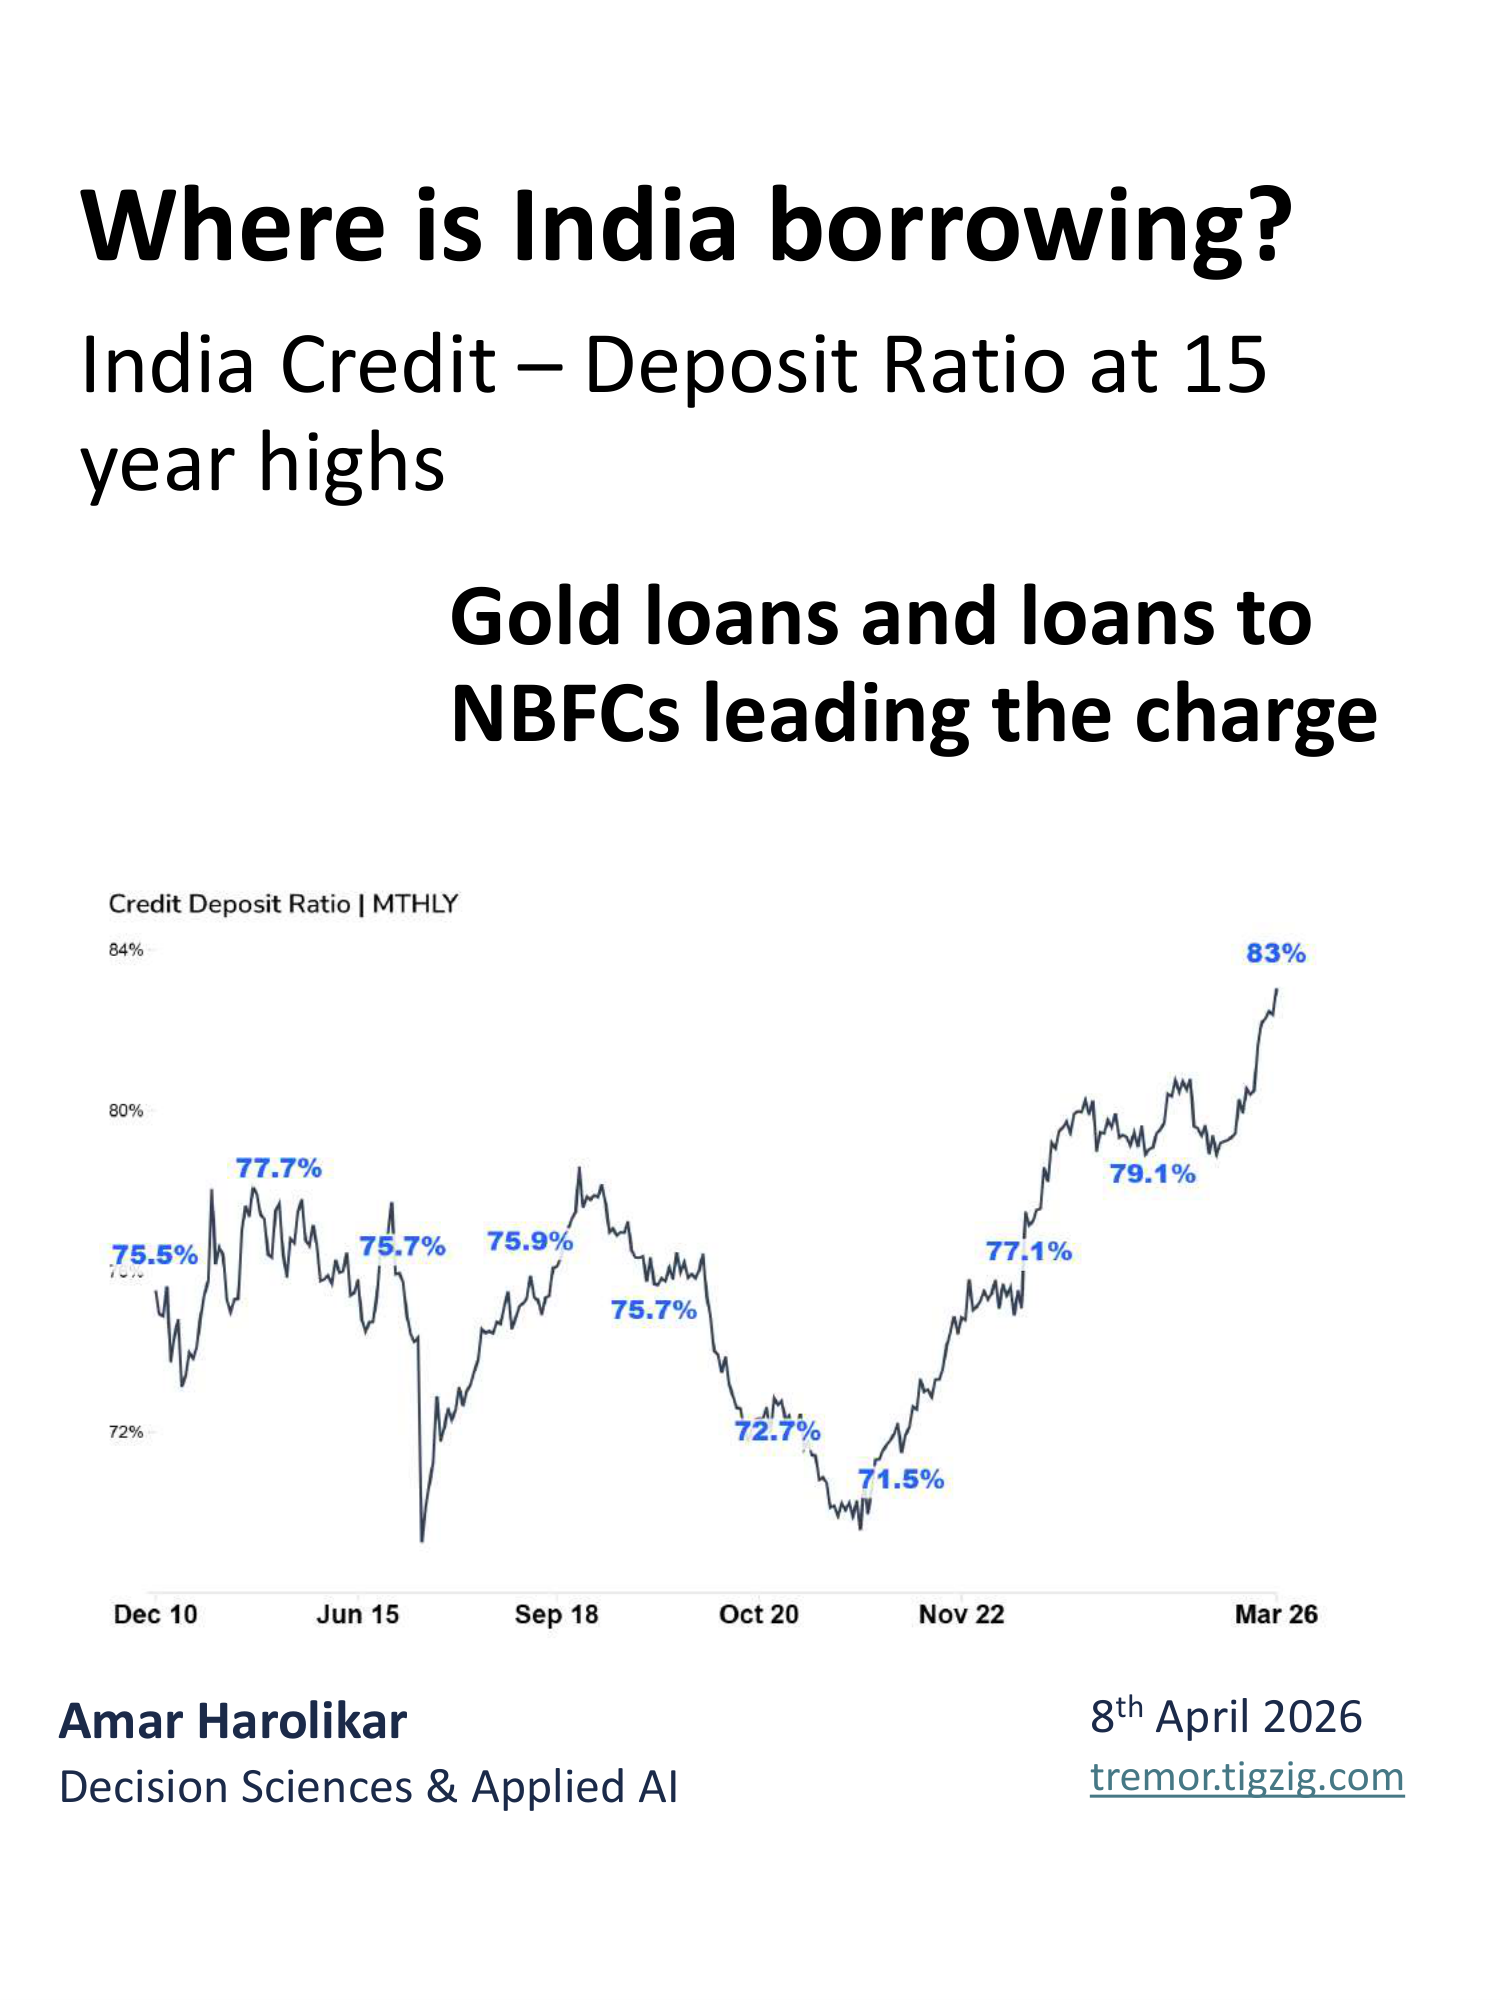
India's Credit-Deposit Ratio Just Hit 83%. A 15-Year High. Gold Loans Up 4x in Two Years.
Published: April 8, 2026
Loans to NBFCs up 21% in 9 months. Six sectors growing at roughly 2x the overall market rate - together pulling one-third of all new credit.
Credit grew at 12.3%, deposits at 9% the past 9 months...the gap keeps widening.
Meanwhile housing - 16% of total credit, biggest single sector - growth slowed down in the past 9 months.
Analysis cuts in the slides. RBI sectoral data, processed and available on TREMOR site with analysis capability and data downloads.
tremor.tigzig.com ➔ IND Credit
India Credit-Deposit Analysis
Browse the slides or download the PDF
Full Deck Content (Text Format)
Text below was extracted from the source deck. Chart visuals stay in the PDF and as slide images above the post.
Where is India borrowing?
Amar Harolikar
Decision Sciences & Applied AI
Gold loans and loans to NBFCs leading the charge
8th April 2026
India Credit – Deposit Ratio at 15 year highs
Data & Tools
Data Sources
Aggregate Deposits & Credit - RBI fortnightly statistical release and Excel downloads from data.rbi.org.in
Sectoral Credit Deployment - RBI SIBC data; monthly returns from 41 banks covering ~95% of non-food credit. Methodology Note
RBI publishes NBFCs (3.9) with sub-items for HFCs (3.9.1) and PFIs (3.9.2) only. The residual - MFIs, gold loan NBFCs, and others - is not disclosed separately. We compute "Other NBFCs" (3.9.3) = NBFCs total - HFCs - PFIs, reconciled to zero gap across all periods
Tool
All data is processed and available on Tremor tool with full data download and analysis capability
TREMOR | Macro Signals (tremor.tigzig.com)
Credit growing faster than Deposits
Jun '25 to Feb '26: Deposits grew 9% (Rs. 230 to 252L Cr) vs. Credit up 12.3% (185 to 208L Cr) - pushing Credit-Deposit ratio to a 15-year high of 83%
Aggregate Credit vs. Deposit Growth (Indexed to 100)
Credit
Deposit
Source: RBI fortnightly disclosure data. Period: 13th June 2025 to 28th February 2026.
Six Sectors Outpacing the Market
Overall credit grew 12.3% (Jun-Feb), adding Rs. 8.14L Cr. Six sectors grew at 2x that rate (24%), contributing nearly one-third of all new credit. Their combined share rose from 18.4% to 20.3% in nine months:
Loans against gold jewellery, NBFCs (MFIs, gold loan, others) & Public Financial Institutions
Micro & Small & Medium enterprises, Wholesale trade
Loans Against Gold Jewellery
The fastest-growing sector. Jun-Feb growth of 54.7% vs. 12.3% for overall credit.
The bigger story is the 2-year trend: outstanding has surged from Rs. 1L Cr to Rs. 4.3L Cr - over 4x - adding Rs. 3.28L Cr to the economy. Share rose from a minuscule 0.6% to ~2% of total bank credit. A scorching pace of growth.
NBFC – MFIs, Gold Loan, Others
Bank lending to NBFCs (excl. HFCs & PFIs) grew 20.8% (Jun-Feb), adding Rs. 2.19L Cr - comprising ~10% of all incremental credit. Share rose from 5.7% to 6.1%.
Many NBFCs themselves report strong gold loan growth, so the total gold loan picture is a combination of this sector + direct bank gold jewellery loans (previous slide).
The Other Fast Movers
The remaining sectors rounding out the high-growth group:
Micro & Small Industries - grew 18.2%, contributed 7% of incremental credit. Share up from 4.7% to 5.0%.
Medium Industries - grew 20.3%, share up from 1.9% to 2.1%.
Wholesale Trade - another sector quietly gaining share alongside the MSME segments.
Housing - The Notable Exception
The single largest sector at 15.9% of total credit - yet growing well below the market. Jun-Feb growth of just 7.8% vs. 12.3% overall.
Market share is steadily eroding - down from 16.6% to 15.9%. As the biggest sector, this drag pulled down the overall credit growth number.
Large Industries and Agriculture
The 2nd and 3rd largest sectors - Large Industries and Agriculture & Allied Activities - together comprise over one-fourth (26.6%) of total credit deployment.
Both grew at a healthy 10.4% - but still below the 12.3% overall average. Combined share drifted from 27.1% to 26.6%. Healthy growth, but comparatively slower - yielding share to the faster movers.
Run Your Own Cuts
The India Credit Deployment tool is live on tremor.tigzig.com → IND Credit
Find market shares
Compare percentage share across sectors
Compare the share of deltas
Analyze at tree and leaf node level
Detailed methodology and validation
Full data download
Working on something similar? How I work covers the rates, the availability and what I take on.