Releasing 'US-CREDIT'. For Analysts Tracking US Banking. Interactive Tool Covering FDIC SDI Sector-Level Aggregates and NY Fed CCP.
Published: April 20, 2026
Data covers 25 years, 100 quarters. $13.6T in bank loans across 4,400+ FDIC-insured institutions. $18.8T in consumer debt across banks + credit unions + fintech + non-bank lenders.
tremor.tigzig.com ➔ US Credit
Run your own cuts across segments, delinquency buckets, charge-offs. Validated against FDIC's own Quarterly Banking Profile - 100 quarters reconciled.
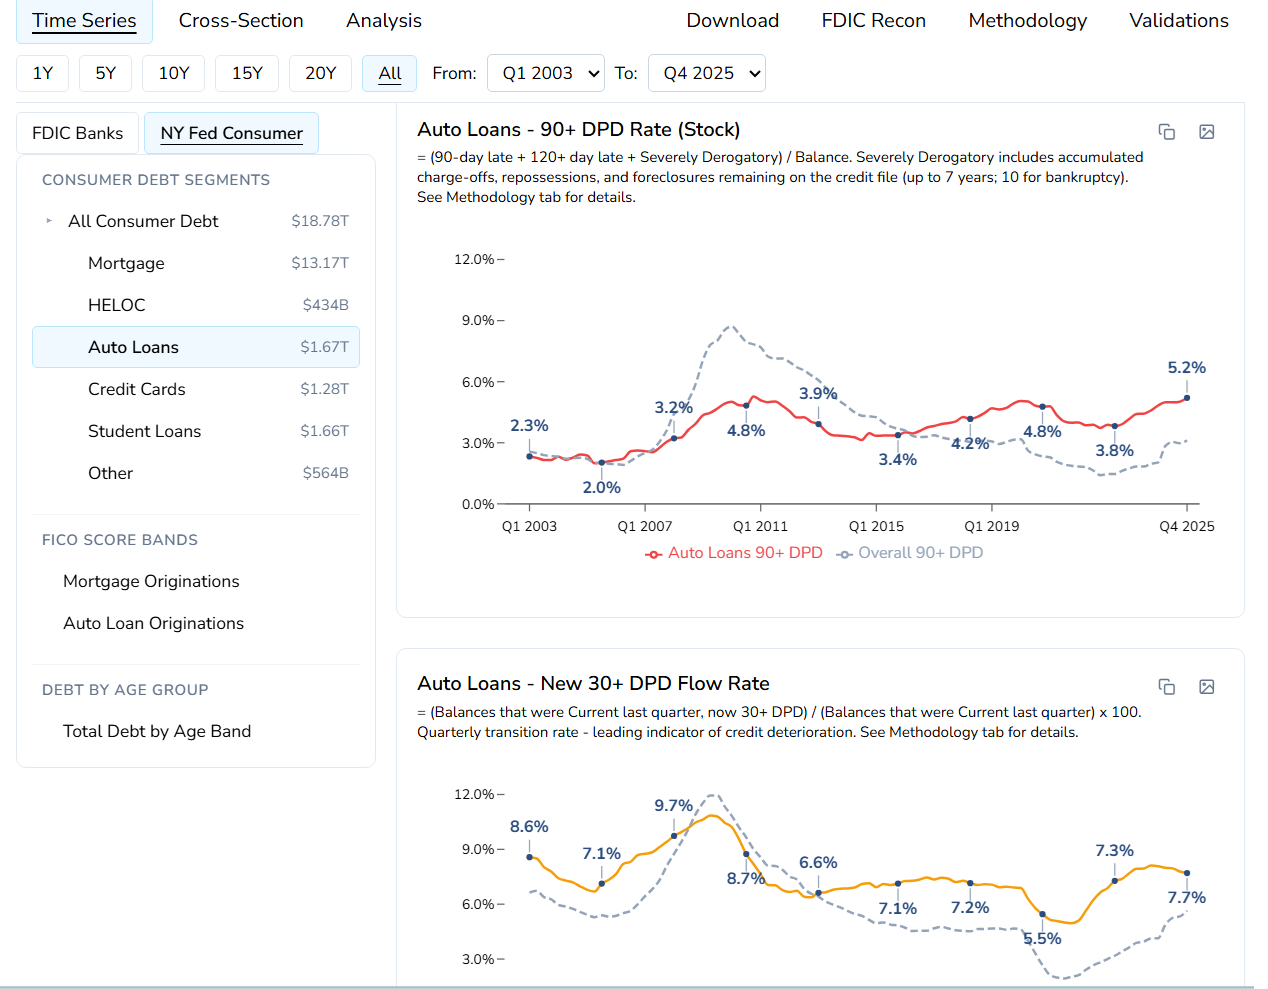
Consumer NCO rate at 2.90% has now exceeded the Q4 2007 pre-GFC level (2.74%). Student and Auto 90+DPD beyond GFC peak. Overall banking system net charge-offs at 0.61%. Past pre-GFC levels. Is the stress isolated to consumer, or is it leading the cycle? The data is here. Explore it yourself.
What you can do:
- Loan balances and delinquency across 18 FDIC segments - Total, RE (Construction, CRE, Multifamily, 1-4 Family, Farmland), C&I, Consumer (CC, Auto, Other), and more
- 30+ DPD (PDNA), Noncurrent (90+ DPD + Nonaccrual), and Net Charge-Off rates - annualized, pre-computed quarterly from YTD
- NY Fed consumer view - Mortgage, HELOC, Auto, CC, Student Loans, Other. 90+ DPD stock, 30+ and 90+ DPD flow rates
- FICO origination bands - Mortgage and Auto by credit score (<620 to 760+) since 2003
- Debt by age group - 18-29 to 70+, quarterly since 2003
- FDIC QBP recon - with recon dashboard, variances, explanations
- Full methodology with FDIC field codes (LNLSGR, P3, P9, NA, NT) and NY Fed Consumer Credit Panel definitions
- CSV download - both datasets with field descriptions
Bank-side (FDIC SDI) vs consumer-side (NY Fed Consumer Credit Panel / Equifax). NY Fed captures fintech, non-bank lenders, and severely derogatory charge-offs that FDIC data excludes.
Plus: Research deck - "The Disbelief Rally. 'No Systemic Risk' Meets the Data"
"No signs of distress...losses are manageable...the consumer is fine." The data shows otherwise. Check it yourself.
tremor.tigzig.com ➔ US Credit