S&P at All-Time High. Under the Hood, Things Are Cracking. Just Like October 2007 - Right Before the ~60% Descent to the Bottom
Published: April 18, 2026
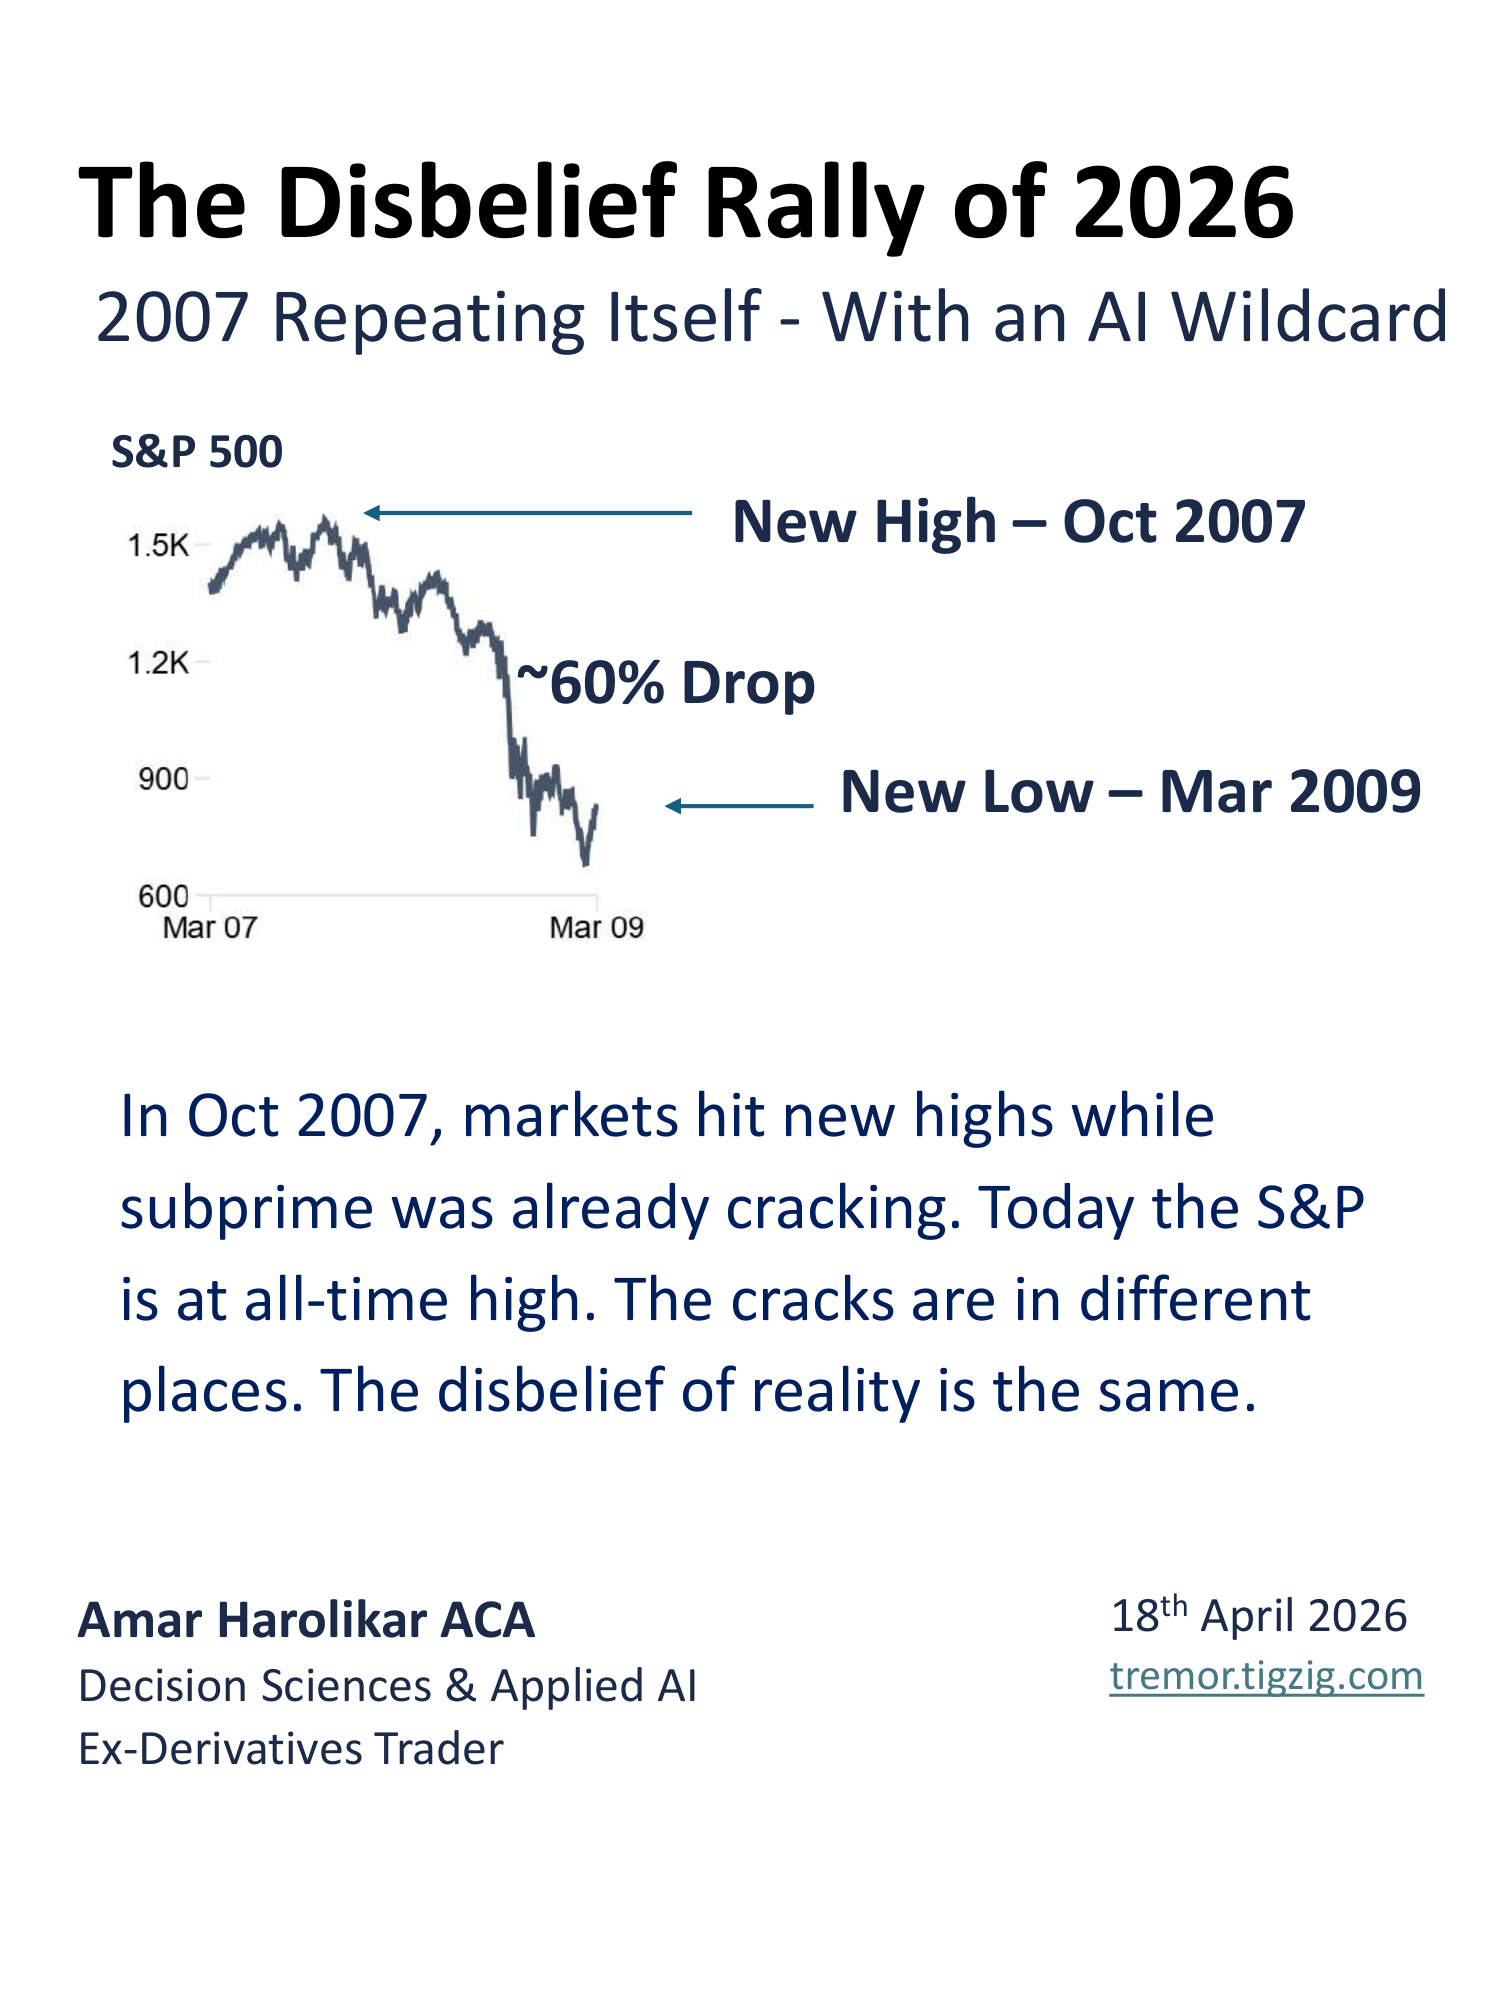
In Oct 2007, markets hit new highs while subprime was already cracking. Many did not believe it important..."there is no systemic risk"...remember that?
Today private credit at ~2x the size of the 2007 subprime market is showing signs of stress...credit card & auto delinquencies above 2007 pre-crisis levels...student loan delinquencies blowing up...overall bank charge-offs higher than 2007 pre-crisis level...rising unemployment, oil shock...all at once like in 2007.
And the new one - AI displacing workers at a pace computerization never did. Computerization took decades. This is happening in a single cycle inside another stress cycle...2007 was not my first crash. But I don't recollect any precedent for this.
Markets are in disbelief of what's underneath.
Tracking this across FFIEC, FDIC, NY Fed, IEA, Challenger, Anthropic Economic Index.
Deck with analysis below. Data and interactive tool at tremor.tigzig.com
S&P at ATH - What's Cracking Underneath
Browse the slides or download the PDF
Full Deck Content (Text Format)
Text below was extracted from the source deck. Chart visuals stay in the PDF and as slide images above the post.
The Disbelief Rally of 2026
Amar Harolikar ACA
Decision Sciences & Applied AI
Ex-Derivatives Trader
18th April 2026
In Oct 2007, markets hit new highs while subprime was already cracking. Today the S&P is at all-time high. The cracks are in different places. The disbelief of reality is the same.
2007 Repeating Itself - With an AI Wildcard
New High – Oct 2007
New Low – Mar 2009
S&P 500
~60% Drop
2007 vs 2026
| 2007 | 2026
S&P at Highs | 1,576 (Oct) | 7,100+ (Apr)
Shiller CAPE | ~27x | ~40x (2nd time ever)
Unemployment | 4.7% and rising | 4.3% - 35-mo drift from 3.4% trough
Hidden Losses | Subprime CDOs at par | Private credit BDCs at par
Hidden Leverage | ~$1.5T subprime | ~$2.7T private credit
Bank Losses | Rising in mortgages | Rising in Autos, cards, student loans.
Oil Shock / War | Oil rose, no supply cut | Hormuz 40-day closure. Brent $112+
The Variable 2007 Didn't Have
AI displacement of labor. Entry-level hiring down & increasing layoffs of experienced workers. Computerization took decades. This is happening in one cycle, INSIDE another stress cycle.
The Disbelief Rally
S&P 500 new highs preceded both episodes – the temporary euphoria from an immediate news event
Disbelief Rally
Crash Follows
2007-2008
Disbelief Rally - Same Setup?
2025-2026
“Fed Minutes Spark Record Stock Moves ” NPR | Oct-9-2007
“S&P 500 notches first close above 7,100” CNBC | Apr-17-2026
CAPE at ~40x - Second Time Ever
Shiller CAPE at ~40x as of Jan 2026 - a 135% premium to the long-term mean of ~17.3. Only the second time in 155 years the 40-point threshold has been breached - the first was the Dot-com peak in 2000.
In 2007, CAPE was ~27x before the crash. Today's reading is 50% higher than 2007's peak.
Dot-com Peak 44.2
Now 38.9
Long-term Mean ~17
2007 Peak 27.5
What is the Shiller CAPE? Developed by Nobel laureate Robert Shiller, it divides the S&P 500 price by the average of 10 years of inflation-adjusted earnings - smoothing out short-term profit cycles to show how expensive the market truly is. Readings above 25 have historically preceded below-average returns; above 40 has only occurred twice - both near major peaks.
Source: Robert Shiller, Yale University / shillerdata.com via tremor.tigzig.com
Labor Market - Same Creep
U-1: Long-Term Unemployed
Nov 2007: 1.5%
Mar 2026: 1.8% ▲
Already exceeds 2007
U-3: Headline Rate
Nov 2007: 4.7%
Mar 2026: 4.3% ▲
35-mo drift from 3.4% trough
U-6: Underemployment
Nov 2007: 8.5%
Mar 2026: 8.0% ≈
Matching 2007 level
All three measures - long-term, headline, and underemployment - are rising, mirroring the pre-crisis pattern of 2007.
Source: U.S. Bureau of Labor Statistics (BLS) / FRED via tremor.tigzig.com
AI Displacement (1/2)
Entry-Level Already In Recession
The headline 4.3% unemployment masks a recession-level shock at the bottom of the career ladder.
Recent grad unemployment: 5.7% in Q4 2025, up from 5.3% in Q3. Underemployment at 42.5% - highest since 2020. (NY Fed)
Unemployment rate for new college graduates could go 30%+(McDermott, CEO Service Now, CNBC,March’26)
New grads now 7% of Big Tech hires, down 50%+ from pre-pandemic. Under 6% at startups, down 30%+. (SignalFire)
"I'm worried that when this year's college graduates enter the workforce, we could see the highest unemployment rate among them in years - even without a recession.“. - Larry Fink, CEO BlackRock (2026 Infrastructure Summit, March 2026)
Source: Federal Reserve Bank of New York, College Labor Market, Feb 2026
AI Displacement (2/2): Senior Layoffs Accelerating
Announced cuts up 44% YoY. AI-attributed layoffs projected at 9x 2025. The AI producers are the ones warning.
2026 cuts across the board: Oracle 20-30K, UPS 30K, Amazon 16K, Dell 11K, Chevron 8K, Dow 4.5K, Block 4K, MS 2.5K, Atlassian 1.6K, Snap 1K. Challenger, Gray & Christmas; TrueUp; Layoffs.fyi
AI can theoretically cover 94% of computer/math tasks but currently handles ~33%. 49% of jobs can now use AI in 25%+ of tasks - up from 36% in early 2025. Displacement so far is a fraction of what's feasible. Anthropic Economic Index - Massenkoff & McCrory, March 2026
Companies shifting budgets toward AI investments at the expense of jobs. Challenger CRO, Forbes, April 2026
"AI will disrupt 50% of entry-level white-collar jobs over 1-5 years, while also thinking we may have AI that is more capable than everyone in only 1-2 years."
Dario Amodei, CEO Anthropic, Jan 2026
Consumer Credit - Cracks Widening
Post-COVID forbearance unwind: delinquencies and charge-offs rising across credit cards, auto loans, and consumer portfolios - many now exceeding pre-COVID levels.
Both the banking system (FDIC) and broader consumer credit (NY Fed) confirm the same upward trajectory since forbearance expired.
FDIC-Insured Banking System
Consumer Credit
Source: NY Fed Consumer Credit Panel / Equifax via tremor.tigzig.com
Source: FDIC SDI via tremor.tigzig.com
Auto Loans - Worse Than 2007
Delinquencies now exceed GFC peak levels. A $1.67T market with cracks showing in both prime and subprime.
NY Fed / Equifax (All Lenders)
Auto 90+ DPD: 5.21% (Q4 2025) vs 3.05% (Q4 2007)
Total market: $1.67T outstanding (Q4 2025)
S&P Global Auto ABS Pool ($176B)
Subprime charge-offs: ~10%; prime: ~6%
Not just subprime – prime is cracking too
Source: S&P Global Auto Loan ABS Tracker – Feb 2026 Performance
Source: NY Fed Consumer Credit Panel / Equifax via tremor.tigzig.com
Student Loans - The Pressure Nobody Had in 2007
Student loans were ~3% of consumer debt in 2007; now ~9%. $1.66T outstanding, 40M+ borrowers. A new drag on disposable income that didn't exist last cycle.
Share of Consumer Debt
$1.66T outstanding. 2007: ~3% of total debt. Now: 8.9% - tripled in 15 years
This debt didn't exist at scale in 2007
90+ DPD Stock Rate
Q4 2007: 7.5% → Q4 2025: 9.57%
New Delinquency Flow Rate
Q4 2025: 16.35% - highest since 2009, exceeds GFC peak of ~12%
Forbearance ended Oct 2024; now competes with mortgage, auto, cards. No bankruptcy discharge; wages garnished w/o court order
Source: NY Fed Consumer Credit Panel / Equifax via tremor.tigzig.com
Banking System Charge-Offs Rising
Banks are writing off more loans across all sectors.
Overall NCO rate (all sectors): Q3 2007: 0.56% → Q4 2025: 0.61% (annualized) - already past 2007 pre-crisis levels
Consumer NCO rate: Q4 2007: 2.74% → Q4 2025: 2.90% (annualized) - surpassed 2007 pre-crisis levels
It is not just consumer loans - the entire banking system is writing off more across C&I, CRE, and consumer portfolios combined
Source: FDIC SDI via tremor.tigzig.com
FDIC-Insured Banking System
Bank Lending to Private Credit & Non Banking Lenders
NDFI lending at $1.57T (Q4 2025), grew 35% in a single year. Fastest-growing segment in banking - CAGR of 21.9% since 2010, nearly 3x the next-fastest segment. (Source: FFIEC Call Reports, | Analysis & interactive data: tremor.tigzig.com → US-NDFI)
Another $1T in undrawn commitments- total potential exposure: $2.6T. PE Funds category alone has 70% undrawn-to-outstanding ratio. (Source: FFIEC Call Reports, | Analysis & interactive data: tremor.tigzig.com → US-NDFI)
Lending default rates to reach 8%, approaching Covid peak levels. (Morgan Stanley, Mar’26)
Bank credit lines tightening - transmission confirmed. Banks, including JPMorgan are marking down private credit loan collateral and raising rates on back-leverage, prompting funds to swap out holdings (Bloomberg, CNBC, Capital Advisors Group)
"Banks fund private lenders through credit lines and could pose systemic liquidity risk to the banking sector under certain circumstances, including borrowers defaulting together... tail risk may be underappreciated.“ - Federal Reserve Bank of Boston, Current Policy Perspectives 25-8, May 2025
Banks can't make risky loans post-2008. So they lend to the funds and Non Depository Financial Institutions that do.
Private Credit - Ghosts of 2008
Q1 2026 redemption surge - all four majors hit: Blue Owl OCIC 21.9%, OTIC 40.7%, Ares 11.6%, Apollo 11.2%, Blackstone 7.9%. Apollo returned just 45 cents per dollar requested. Moody’s cuts Blue Owl rating to ‘Negative’ Industry total: $20.8B (CNBC, CNBC, CNBC, Reuters, Reuters, Stanger, Wealth Management)
Median listed BDC is trading at just 0.73x its net asset value (NAV), the lowest since 2020 (Kobeissi Letter, March 2026)
BlackRock TCP Capital: writedowns cut NAV by 19% in Q4 2025 - valuations catching up to reality (Wealth Management)
Tricolor indicted (Dec 2025) - DOJ alleges $800M double-pledged collateral. JPM $170M hit. First Brands: $2B+ unaccounted (CNBC)
"When you see one cockroach, there are probably more." - Jamie Dimon, JPMorgan CEO (Oct 2025) . "The credit cycle has not been repealed." - David Solomon, Goldman Sachs CEO (Mar 2026)
Detailed analysis: March 2026 - The $2.7 Trillion Shadow Lending Market Is Showing Cracks
Q1 2026 data is in. Every major manager hit. The slow-motion bank run is now quantified.
Hormuz Reopened. Futures Fell 12%. The Damage Is Still Here.
Market celebrates, but 40 days of closure doesn't reverse in a day.
IEA: even with full reopening, oil flows not expected to reach pre-conflict levels till late 2026 IEA
Kuwait Petroleum CEO: "full production within three or four months." Capacity doesn't switch back on at a press conference CNBC
Tanker fleet mispositioned - pointed toward the US. Redirecting back to the Gulf takes months. Windward
Pump prices: "months if not a full year" to return to pre-war levels. Newsweek
“This is a historic disruption to world oil. There has never been anything of this scale. Even the oil crises of the 1970s, the Iran-Iraq war of the 1980s, Iraq's invasion of Kuwait in 1990 - none come close to the magnitude of this disruption.” Daniel Yergin, vice chairman of S&P Global CNBC
“The current oil and gas crisis triggered by the blockade of the Strait of Hormuz is more serious than the ones in 1973, 1979 and 2022 together.” Fatih Birol, IEA Head | Reuters
Analysis: "The Oil Price You See Is Wrong" (Apr 12, 2026)
How a Blocked Strait Hits Economies
The closure doesn’t need to last forever to cause lasting damage. It just needs to last long enough for these transmission chains to embed in prices. That process has already started.
Hormuz - Three Scenarios – One Thing in Common
What Kills This Thesis (1/2)
Each item has an observable trigger - track these, not the narrative.
Fed cuts aggressively + credit stress flattens. 75bps+ by Sept (not the 25bp drip priced in) and consumer 30+ DPD flow rates turn down from 4.8%. Hormuz relief is easing inflation - could give Fed cover. Apr 28-29 FOMC is the first test
Labor market stabilizes without rolling over. 35-month drift (3.4% to 4.3%) unprecedented without recession. But JPM: ‘weakness from subdued hiring, not widespread layoffs’ Non-farm payrolls above 150K for 3+ months begins invalidating this leg
Private Credit redemptions ease + BDC NAV recovers. Q1 requests ran 8-40% across majors; BDCs at 20% discount to NAV. If Q2 requests fall below 5% and price/NAV recovers toward 0.85x+, the bank-run dynamic breaks. No sign of easing yet
AI productivity shows up in wages, not just layoffs. BofA data: K-shaped compression (upper +5.6%, lower +1%). Real wages positive across all brackets for 2+ quarters weakens consumer stress story. No data supports this yet
Consumer savings rebuild above 5%. Student loan delinquency flow at 16.35% - highest since 2009. If oil normalizes, inflation falls, and savings rate rebuilds, the default transmission closes. Possible but needs 2-3 quarters of data
What Kills This Thesis (2/2)
The Bull Case Has Data Behind It“Private credit probably does not present a systemic risk.” Jamie Dimon | Shareholder Letter, Apr 2026.
CDS markets aren't alarmed. JPMorgan 5yr CDS at ~45bps today (52-week range 37-67bps), well below crisis-era peaks when IG CDX hit 280bps. Big-bank CET1 ratios now ~15-16% vs ~5-7% pre-2008 - roughly 2.5-3x thicker buffers. Credit pricing says "stress, not crisis“
Private Credit too small to be systemic. $2T vs $13T public bonds. Morgan Stanley: even 8% defaults "significant but not systemic." IMF Apr: "contained“
Fiscal stimulus flowing. One Big Beautiful Bill Act tax cuts live (signed July 2025, bulk active 2026). Hyperscalers committed $600B+ AI capex 2026 - nearly double 2025. Bessent (Apr 16): "None of our work has shown there would be a systemic problem“
Recession probability fading. J.P. Morgan: "We no longer see a US recession." RSM US cut 40% to 30%. National Association for Business Economics GDP revised up. Same consensus that missed 2008
This deck isn't certainty - it's asymmetry. If three invalidators print next two quarters, the 2007 mirror shatters.
Gradualism Plus A New Variable
Credit cycles have had slow burns before. 2006-07 is the reference case. The setup is same - delinquencies creeping, marks held at par, markets at highs.
What has no precedent: a structural labor shift happening inside the same cycle.
AI displacement is not cyclical. Jobs lost to AI don't return when credit stabilizes
Two pressures running simultaneously with no historical playbook
The slow pace gives time to react. Complacency is the risk. When it breaks, it breaks with two engines - credit and structural labor - not one
The economic cycle is familiar.
The AI displacement is not.
Data & Tools
Primary Data Sources
NY Fed Consumer Credit Panel / Equifax
FFIEC Call Reports via FDIC
FDIC Statistics on Depository Institutions
SNL Global Market Intelligence (auto ABS, subprime)
BLS (unemployment, wages), SEC/EDGAR (BDC filings, 10-K/10-Q)
Live Interactive Tool
TREMOR - tremor.tigzig.com
US-Banks-Aggregates
US-NDFI Module
Macro Charts
Working on something similar? How I work covers the rates, the availability and what I take on.