Three Red Flags Hit Together. 30Y at 5.14%, PPI at 5.99%, Brent Above $100. Setup Worse Than 2000 or 2007.
Published: May 20, 2026
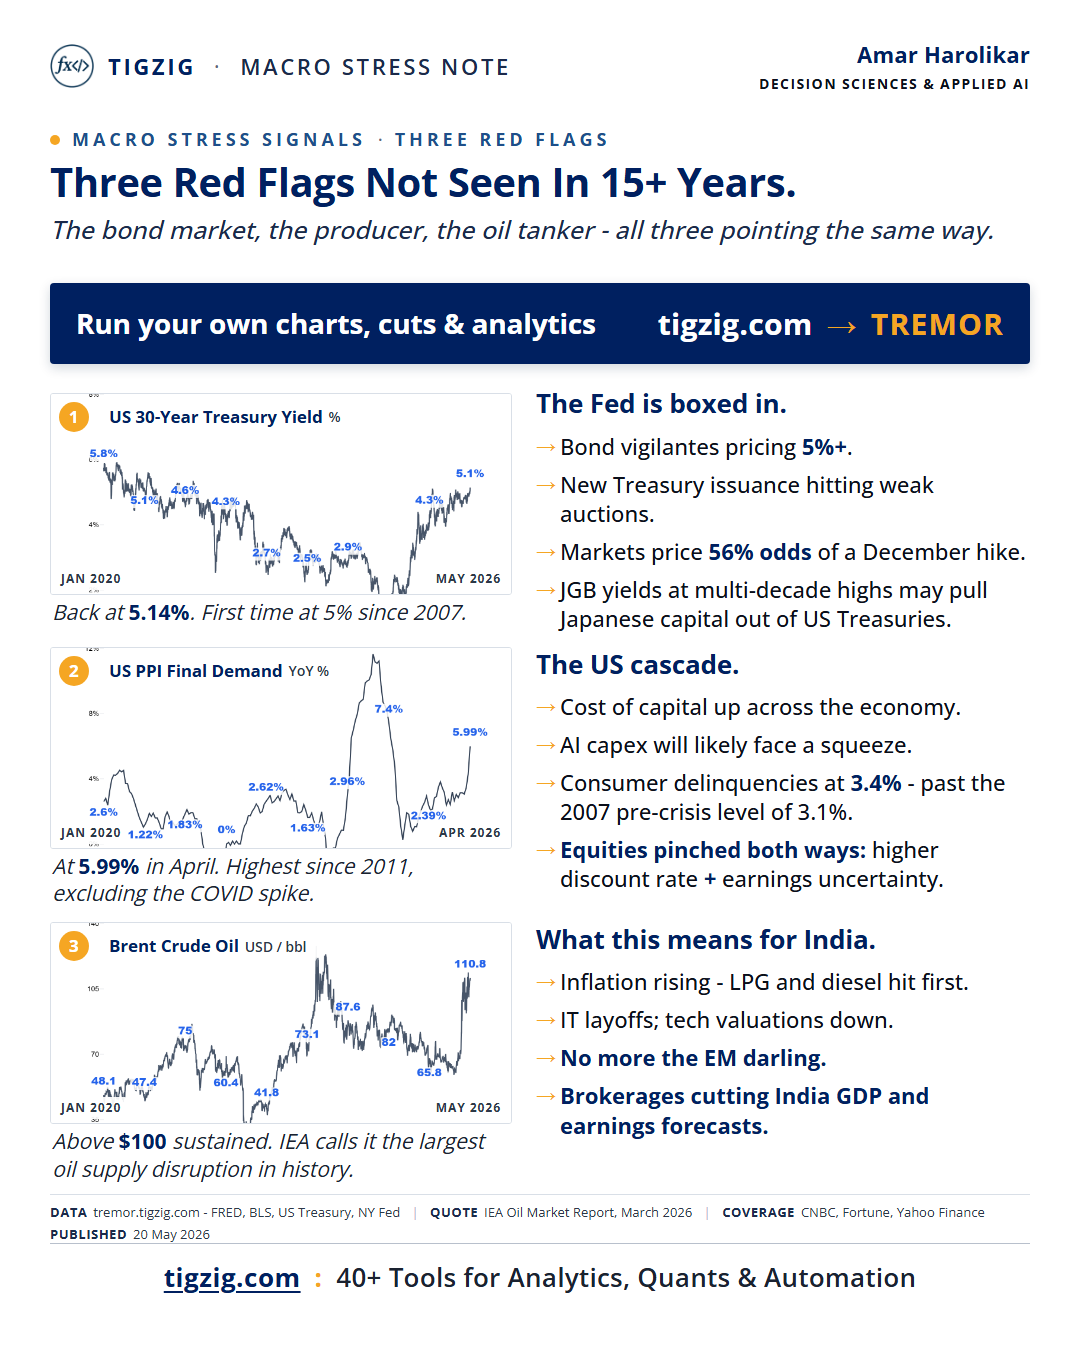
Three red flags showing up at the same time, with each alone being a major disruptor by itself. US 30-year Treasury yield at 5.14%, first time since 2007. Producer prices (US) at 5.99%, highest in 15 years (excluding COVID spike). Brent above $100, IEA calls it the largest oil supply disruption in history.
Here's what else is happening alongside it:
S&P 500 at 7,400. Shiller CAPE at 39.6. The second-highest valuation reading in 145 years. Only the Dot-com peak was higher.
US auto loan loss rates have already crossed the 2007 GFC peak. Cards are on the way. Mortgage flow is starting to crack. Unemployment numbers in touching distance of where they stood in Q3 2007 (pre GFC crisis).
And the S&P itself.. huge concentration risk. NVIDIA alone is 8.9%. The Mag 7 together is ~35%. The other 493 share what's left. It's no more a broad market index ...more of an AI index now ... with all the accompanying risk.
The last time I saw these general patterns: 2000 and 2007. 2026 is looking worse.
Analysis: tigzig.com → ANALYSIS
Tools: tigzig.com → TREMOR
TIGZIG: 40+ Tools for Analytics, Quants & Automation
Full Deck Content (Text Format)
Text below was extracted from the source deck. Chart visuals stay in the PDF and as slide images above the post.
Macro Stress Note · 20 May 2026 · Amar Harolikar · Decision Sciences & Applied AI
The bond market, the producer, and the oil tanker — all three pointing the same way.
1. US 30-Year Treasury Yield
Back at 5.14%. First time at 5% since 2007.
The Fed is boxed in.
- Bond vigilantes pricing 5%+.
- New Treasury issuance hitting weak auctions.
- Markets price 56% odds of a December hike.
- JGB yields at multi-decade highs may pull Japanese capital out of US Treasuries.
Chart range: Jan 2020 — May 2026, YoY %.
2. US PPI Final Demand
At 5.99% in April. Highest since 2011, excluding the COVID spike.
The US cascade.
- Cost of capital up across the economy.
- AI capex will likely face a squeeze.
- Consumer delinquencies at 3.4% — past the 2007 pre-crisis level of 3.1%.
- Equities pinched both ways: higher discount rate + earnings uncertainty.
Chart range: Jan 2020 — Apr 2026, YoY %.
3. Brent Crude Oil
Above $100 sustained. IEA calls it the largest oil supply disruption in history.
What this means for India.
- Inflation rising — LPG and diesel hit first.
- IT layoffs; tech valuations down.
- No more the EM darling.
- Brokerages cutting India GDP and earnings forecasts.
Chart range: Jan 2020 — May 2026, USD / bbl.
Sources
- Data: tremor.tigzig.com — FRED, BLS, US Treasury, NY Fed
- Quote: IEA Oil Market Report, March 2026
- Coverage: CNBC, Fortune, Yahoo Finance
Run your own charts, cuts and analytics: tigzig.com → TREMOR
Published: 20 May 2026.
Working on something similar? How I work covers the rates, the availability and what I take on.