US Bank Exposure to Non-Bank Lenders - Now in an Interactive Analytics Tool
Published: April 4, 2026
Run your own cuts. 629 banks, $1.57 trillion in NDFI loans, 5 quarters of FFIEC Call Report data.
Morgan Stanley projecting 8% default rate in direct lending. Investors demanding their money back. Which banks are most exposed? How thin are the reserves? The data is here - explore it yourself.
What you can do:
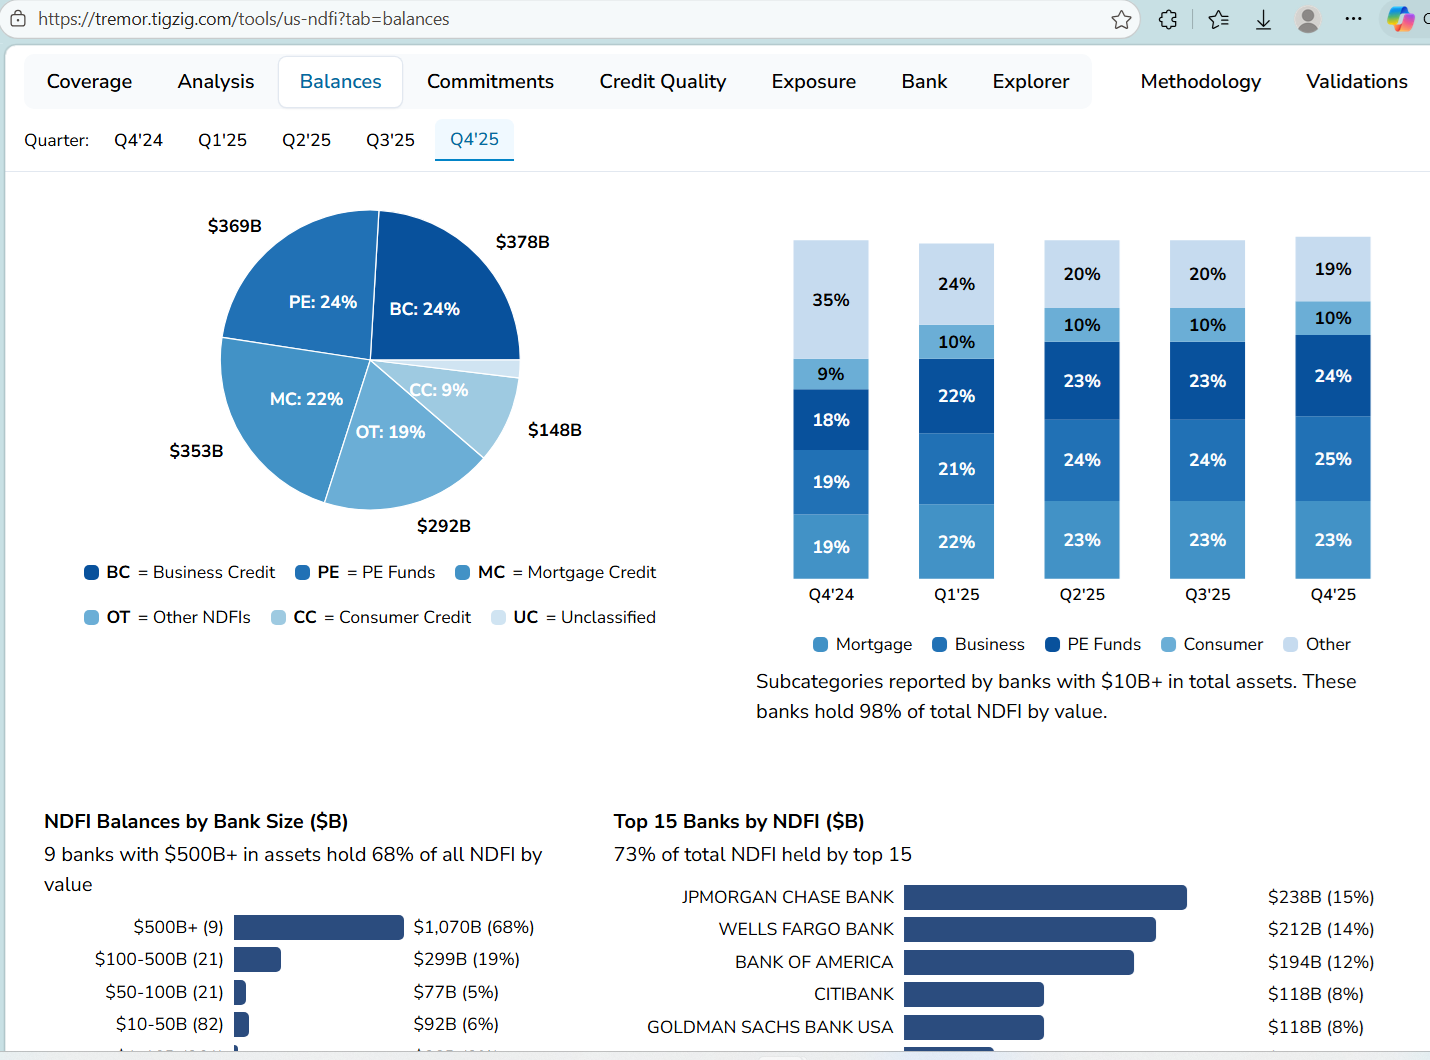
- Exposure levels and commitments broken by NDFI categories
- CET1 concentration and ACL reserve coverage across size segments
- Bank-level drill downs - click any bar to see the banks behind it
- Data explorer with filters across 55+ columns
- Methodology with MDRM codes. 7 levels of validation against FDIC and FRED
Full analysis decks inside the tool.
Plus - Dataset download. All 629 banks. All quarters. CSV.
tremor.tigzig.com ➔ US NDFI