That 9X return from Nifty Midcap is irrelevant if you couldn't survive the 73% of time it was in drawdown
Published: June 22, 2025
I analyzed 18 years of data for three iconic Indian investments: the Nifty 50, L&T, and the Nifty Midcap 100.
The results on paper are spectacular. But they hide a brutal psychological truth.
I designed the Anxiety Index to quantify the psychological impact. An index of 73% means you spent 73% of your holding period watching your investment sit below a previous peak (exact definitions at the end)
- To earn that 9X in midcaps, you had to endure a 73% Anxiety (Index)
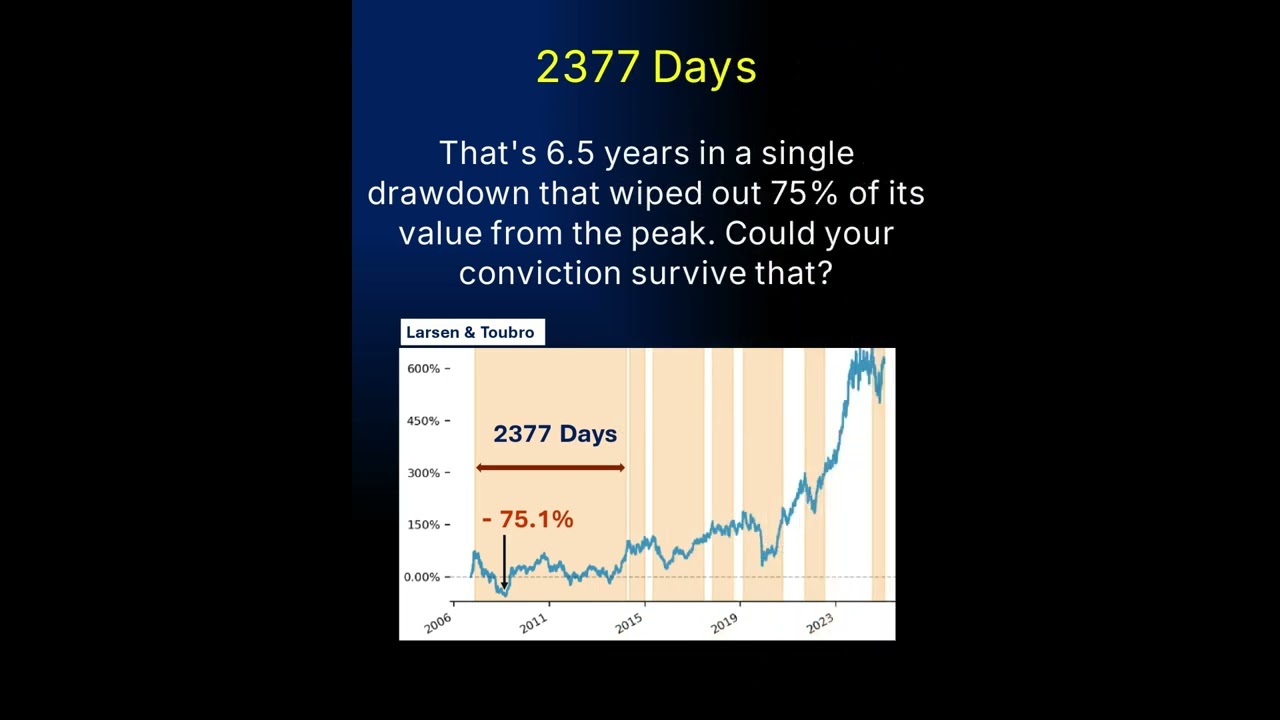
- For L&T's impressive 7X growth, the price was a 75% Anxiety (Index), including a single drawdown that lasted 2,377 days.
Let that sink in. 6.5 years watching your investment be worth less than it was before. Even the 'safer' Nifty 50 spent 63% of the time in a drawdown.
Your biggest risk isn't a number on a spreadsheet. It's your own behavior in the face of a prolonged, gut-wrenching drawdown.
Your financial plan is irrelevant if you don't have the conviction to execute it when you are in depths of a bear market
Before you chase the next 10X idea, ask yourself:
- Do I have the temperament to go nowhere for 5+ years?
- Is my financial life structured to survive needing money at the worst possible time?
- Is my asset allocation built for my psychology, not just for a model?
Past performance is no guarantee of future results. But it is a hell of a teacher about the price of returns.
Quantify the psychological price of your own investments. I built TIGZIG Quants for this analysis - it's free. Analyze any stock, metal, or crypto across your chosen time window.
P.S.
Drawdown measures the fall from an asset's most recent peak. You can be profitable overall but still be in a 20% drawdown. Anxiety Index is my metric for quantifying the psychological cost of watching your portfolio drop from a peak and waiting for it to recover. It is calculated by summing the days of most significant drawdown periods (I take the worst seven) and expressing this as a percentage of the total time.
This is not investment advice. I'm a CA, data scientist, ex-trader and long time investor building tools for my own research. The code is open-source.