FDIC Q2 2026 Numbers Are Live on TREMOR. 102 Quarters of Bank Balances, Delinquency and Charge-Offs.
Published: August 27, 2026
FDIC Q2 2026 numbers now live on Tigzig TREMOR. 102 quarters of balances, delinquency and charge-offs, for every FDIC-insured bank in the country, going back to 2001. Use the interactive tool to run your own cuts or download the full data and analyze offline.
A few quick points as I was going over the numbers.
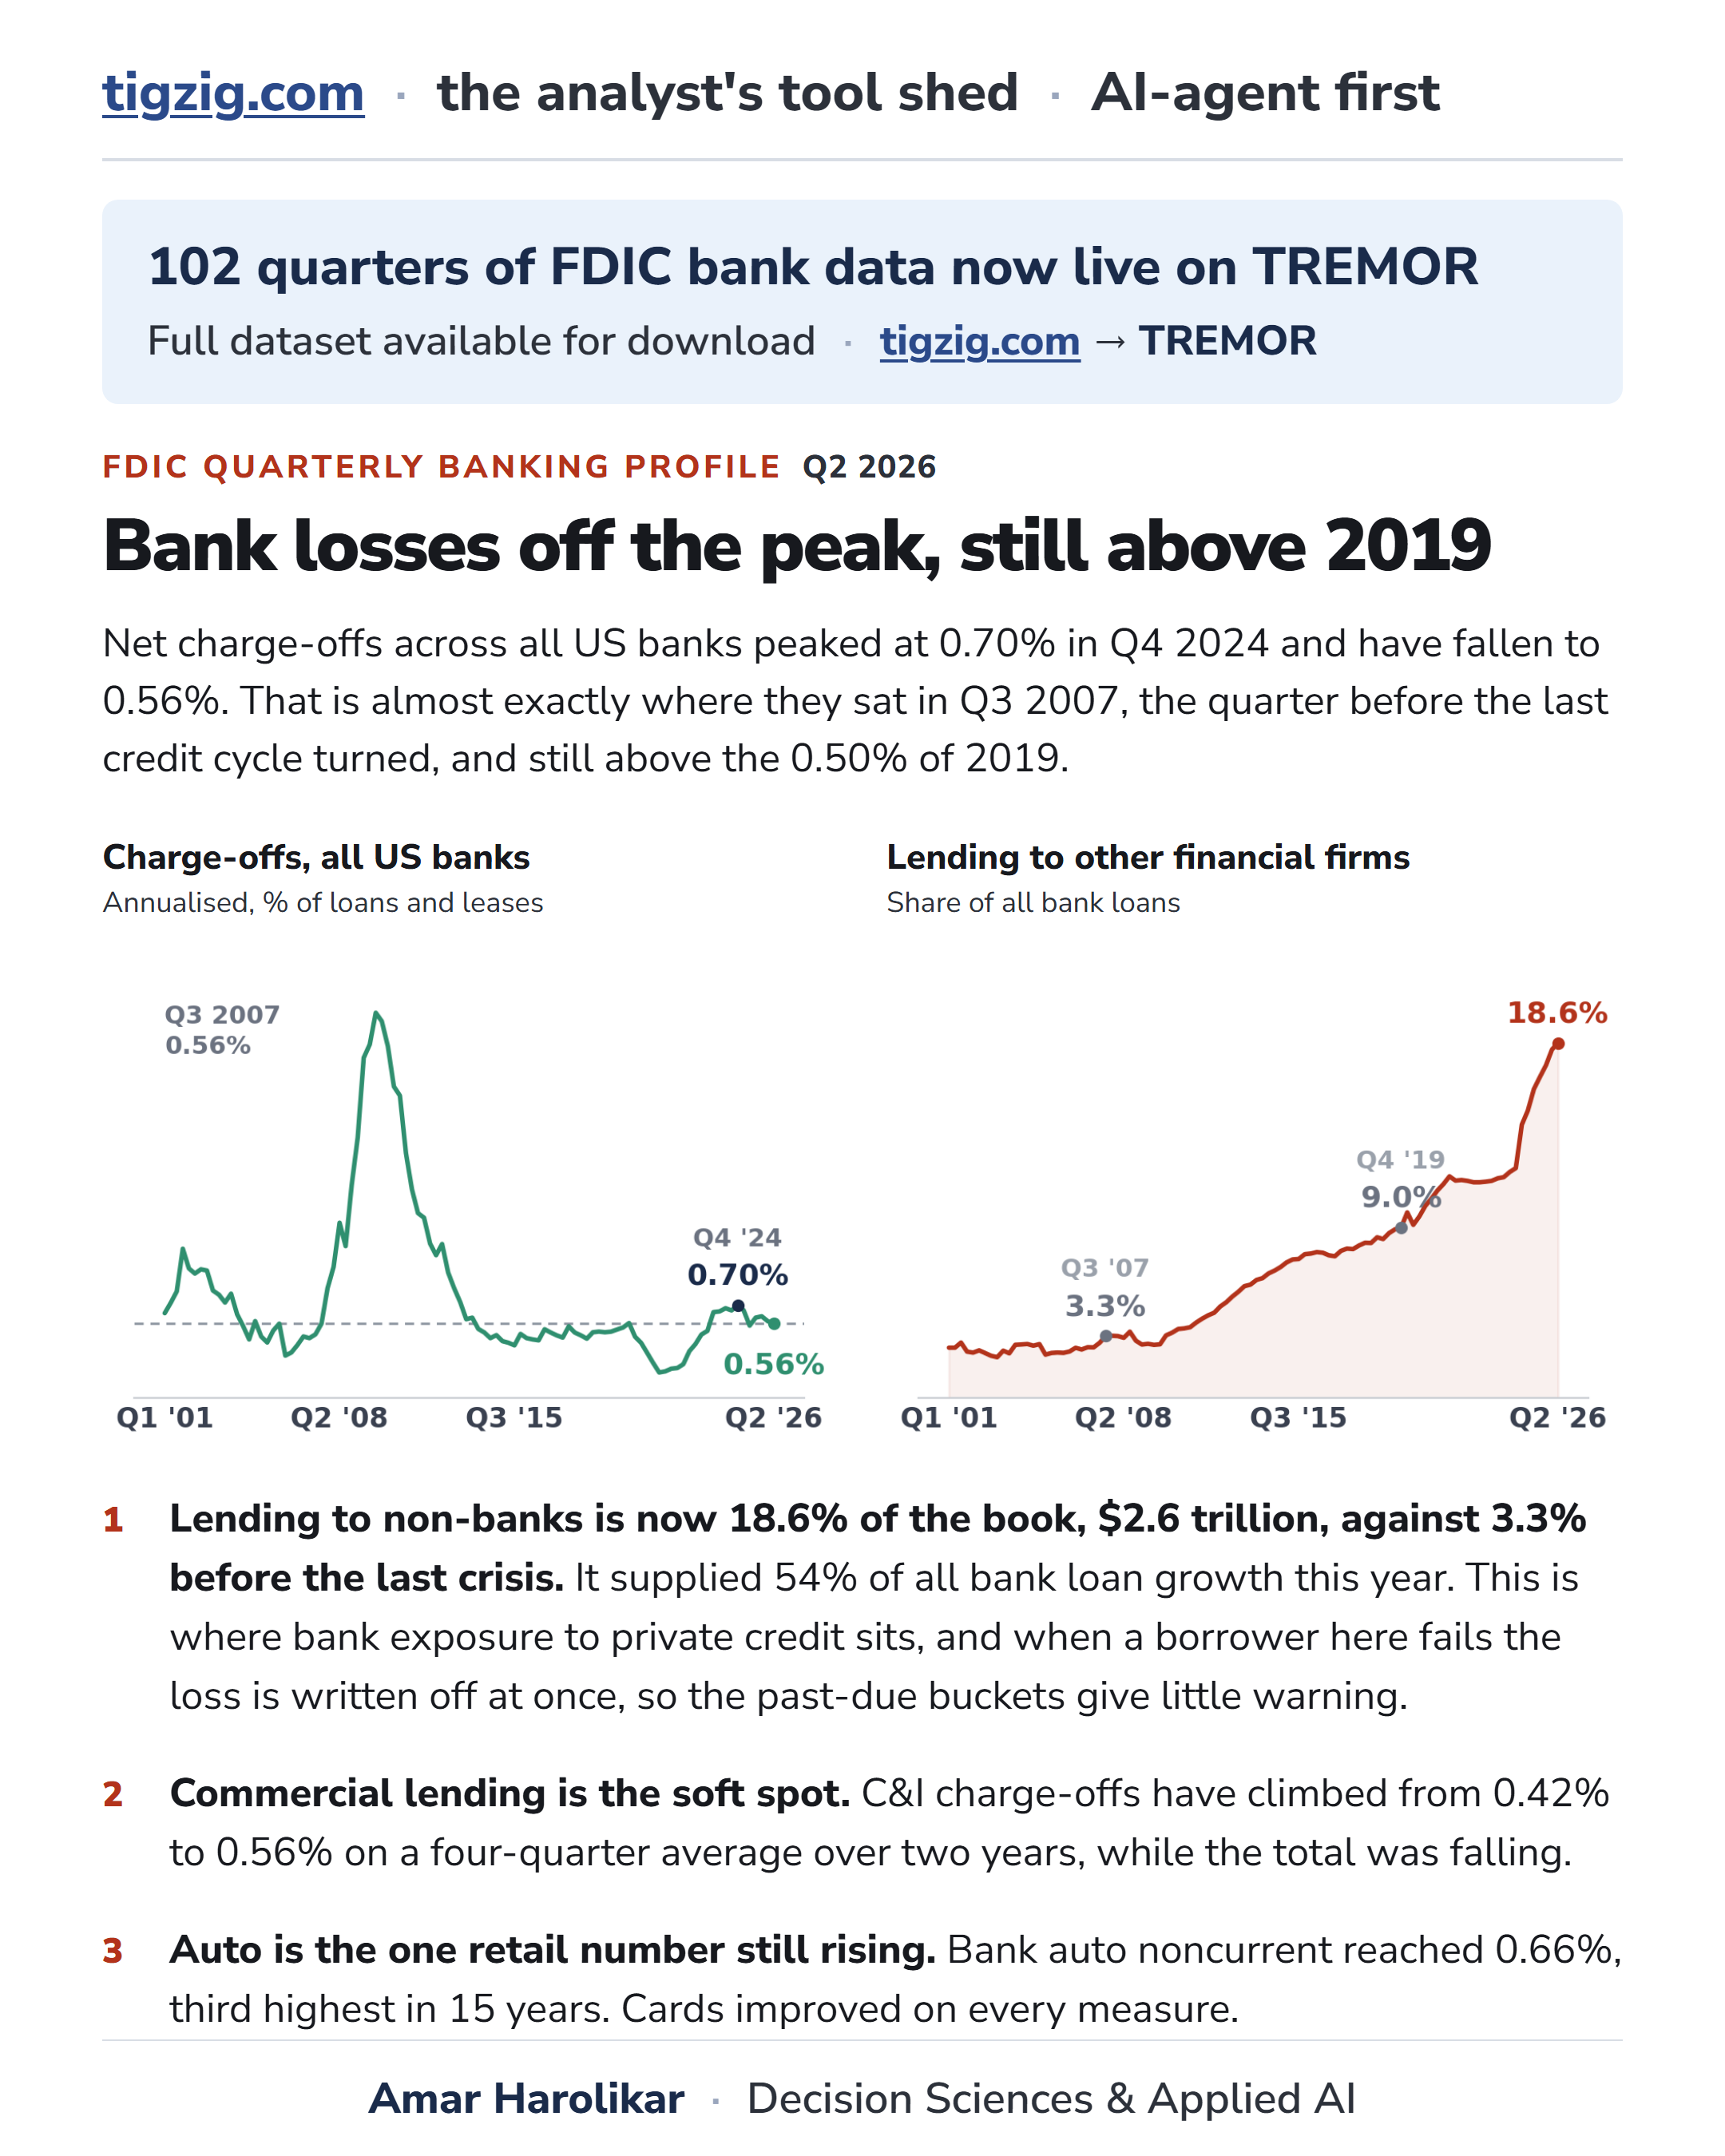
Charge-offs across all US banks peaked at 0.70% in Q4 2024 and have come down to 0.56%. That is almost exactly where they sat in Q3 2007, the quarter before the last credit cycle turned, and it is still above the 0.50% of 2019. So the direction has changed, though the level has not gone back to "normal".
The second one is what the loan book is now made of. Lending to other financial firms is 18.6% of all bank loans, $2.6 trillion, against 3.3% before the last crisis, and it supplied 54% of all the loan growth over the past year. This is where bank exposure to private credit sits. The reported delinquency on it is close to zero, 0.11%, and I would be careful reading that as comfort. A bank lending to a nonbank reports whether the nonbank is paying the bank, and nothing at all about the borrowers underneath it. In Q3 2007 the same bucket reported 0.83%. By Q3 2009 it reported 3.44%.
C&I shows some signs of pressure, and auto is the only retail number still going up.
tigzig.com/tremor ➜ TREMOR
Quick sector notes
C&I noncurrent is 0.93%, against 0.78% at the end of 2019 and 0.63% in Q3 2007. Charge-offs are 0.57%, against 0.40% at the end of 2019 and 0.46% in Q3 2007. So on both measures C&I is running above where it was going into the last cycle. It did come off a little this quarter, noncurrent 0.99% to 0.93%, and I would want another quarter or two before calling that anything.
Real estate noncurrent is 1.28%, against 1.12% at the end of 2019 and 1.27% in Q3 2007. It has risen in eight of the last ten quarters, and it also eased slightly this quarter, 1.31% to 1.28%.
Auto noncurrent went to 0.66% from 0.63%, the third highest reading in the fifteen years FDIC has reported it separately. It is the only retail measure that rose this quarter.
Credit cards improved on everything, noncurrent 1.64% to 1.44% and charge-offs 4.12% to 3.95%. I would not read that as a turn, because card delinquency falls from Q1 to Q2 in 22 of the last 25 years, so most of it points to season.
Net net, real estate and C&I are 63% of what banks lend, and both are sitting above their 2019 levels while the headline number was improving.
What "noncurrent" actually means
FDIC's headline credit measure is called noncurrent, and it is 90+ days past due plus nonaccrual added together. Nonaccrual is not an ageing bucket at all. It is the bank deciding it no longer expects to collect and stopping interest accrual, and it can happen before an account is 90 days late, or when it is not late at all.
Across all US banks this quarter that splits as $39.9 billion genuinely 90+ days past due and still accruing, and $91.0 billion on nonaccrual, so the judgement call is 70% of the total. As rates, 0.28% is the 90+ days past due rate and 0.65% is the nonaccrual rate, which add to the 0.93% noncurrent headline.
Both measures are on the tool separately now, so you can see how differently the split behaves by segment. Credit cards are almost entirely past due with very little nonaccrual, and C&I is nearly all nonaccrual.
Working on something similar? How I work covers the rates, the availability and what I take on.