Open Source Asset Comparison Tool: Compare Stocks, Indices, Crypto & Commodities in One Dashboard
Published: June 18, 2025
Ever tried comparing Apple, TCS, Nifty, Gold & Oil in one report - without juggling multiple platforms or drowning in paid apps?
I use Trading View regularly. Used Amibroker back in my full-time trading days. Koyfin, Portfolio Visualizer, Portfolio Metrics - solid tools.
But here's my problem: I don't want model portfolios.
I want to compare across markets and assets classes - Nifty vs Gold vs Microsoft vs Brent. Fast.
What I wanted
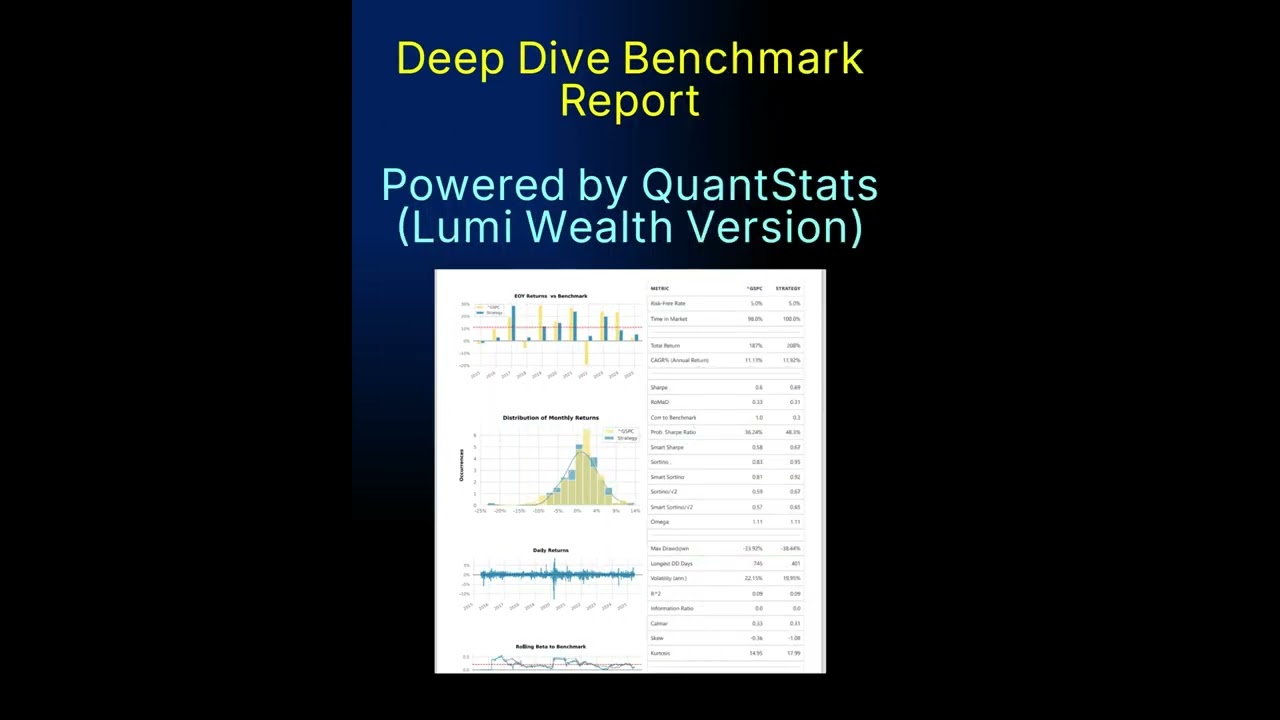
- Daily returns chart - all securities in one chart
- Drawdowns, CAGR, Sharpe, Sortino - single visual
- Date-aligned CSV downloads
- Technical analysis report
- Run combos of assets and timeframes
- All in 30 seconds, not hours. In same tab.
Try doing that on free tools - you'll hit limits, create 'portfolios' for single stocks, run into missing securities or juggle multiple tabs.
So I built TIGZIG Quants
My workflow now:
- Quick comparison on TIGZIG Quants
- Deeper TA -> Trading View
- Deeper Research -> Platforms and offline work
Is this the ultimate solution? Absolutely not!
But it solves my problem: fast, no-nonsense comparisons between unrelated assets.
Quick disclosure: I'm a Chartered Accountant and data scientist, not a portfolio manager. I built this for my personal research, and while it's a powerful tool, it isn't investment advice. Do your own due diligence always
This is build-as-you-go. Right now, CAGR is point-to-point (not a fan - too sensitive to endpoints). Rolling metrics & ML forecasts coming soon.
Ready to try it?
- Agent - Smart assistant
- Suite - Faster, no-frills version (needs exact Yahoo symbols)
Want to build your own version? Hit the Doc button in the app for source codes and build guides + methodology, validations and recon report. Built with MCP servers, n8n, and React.