Analysis
19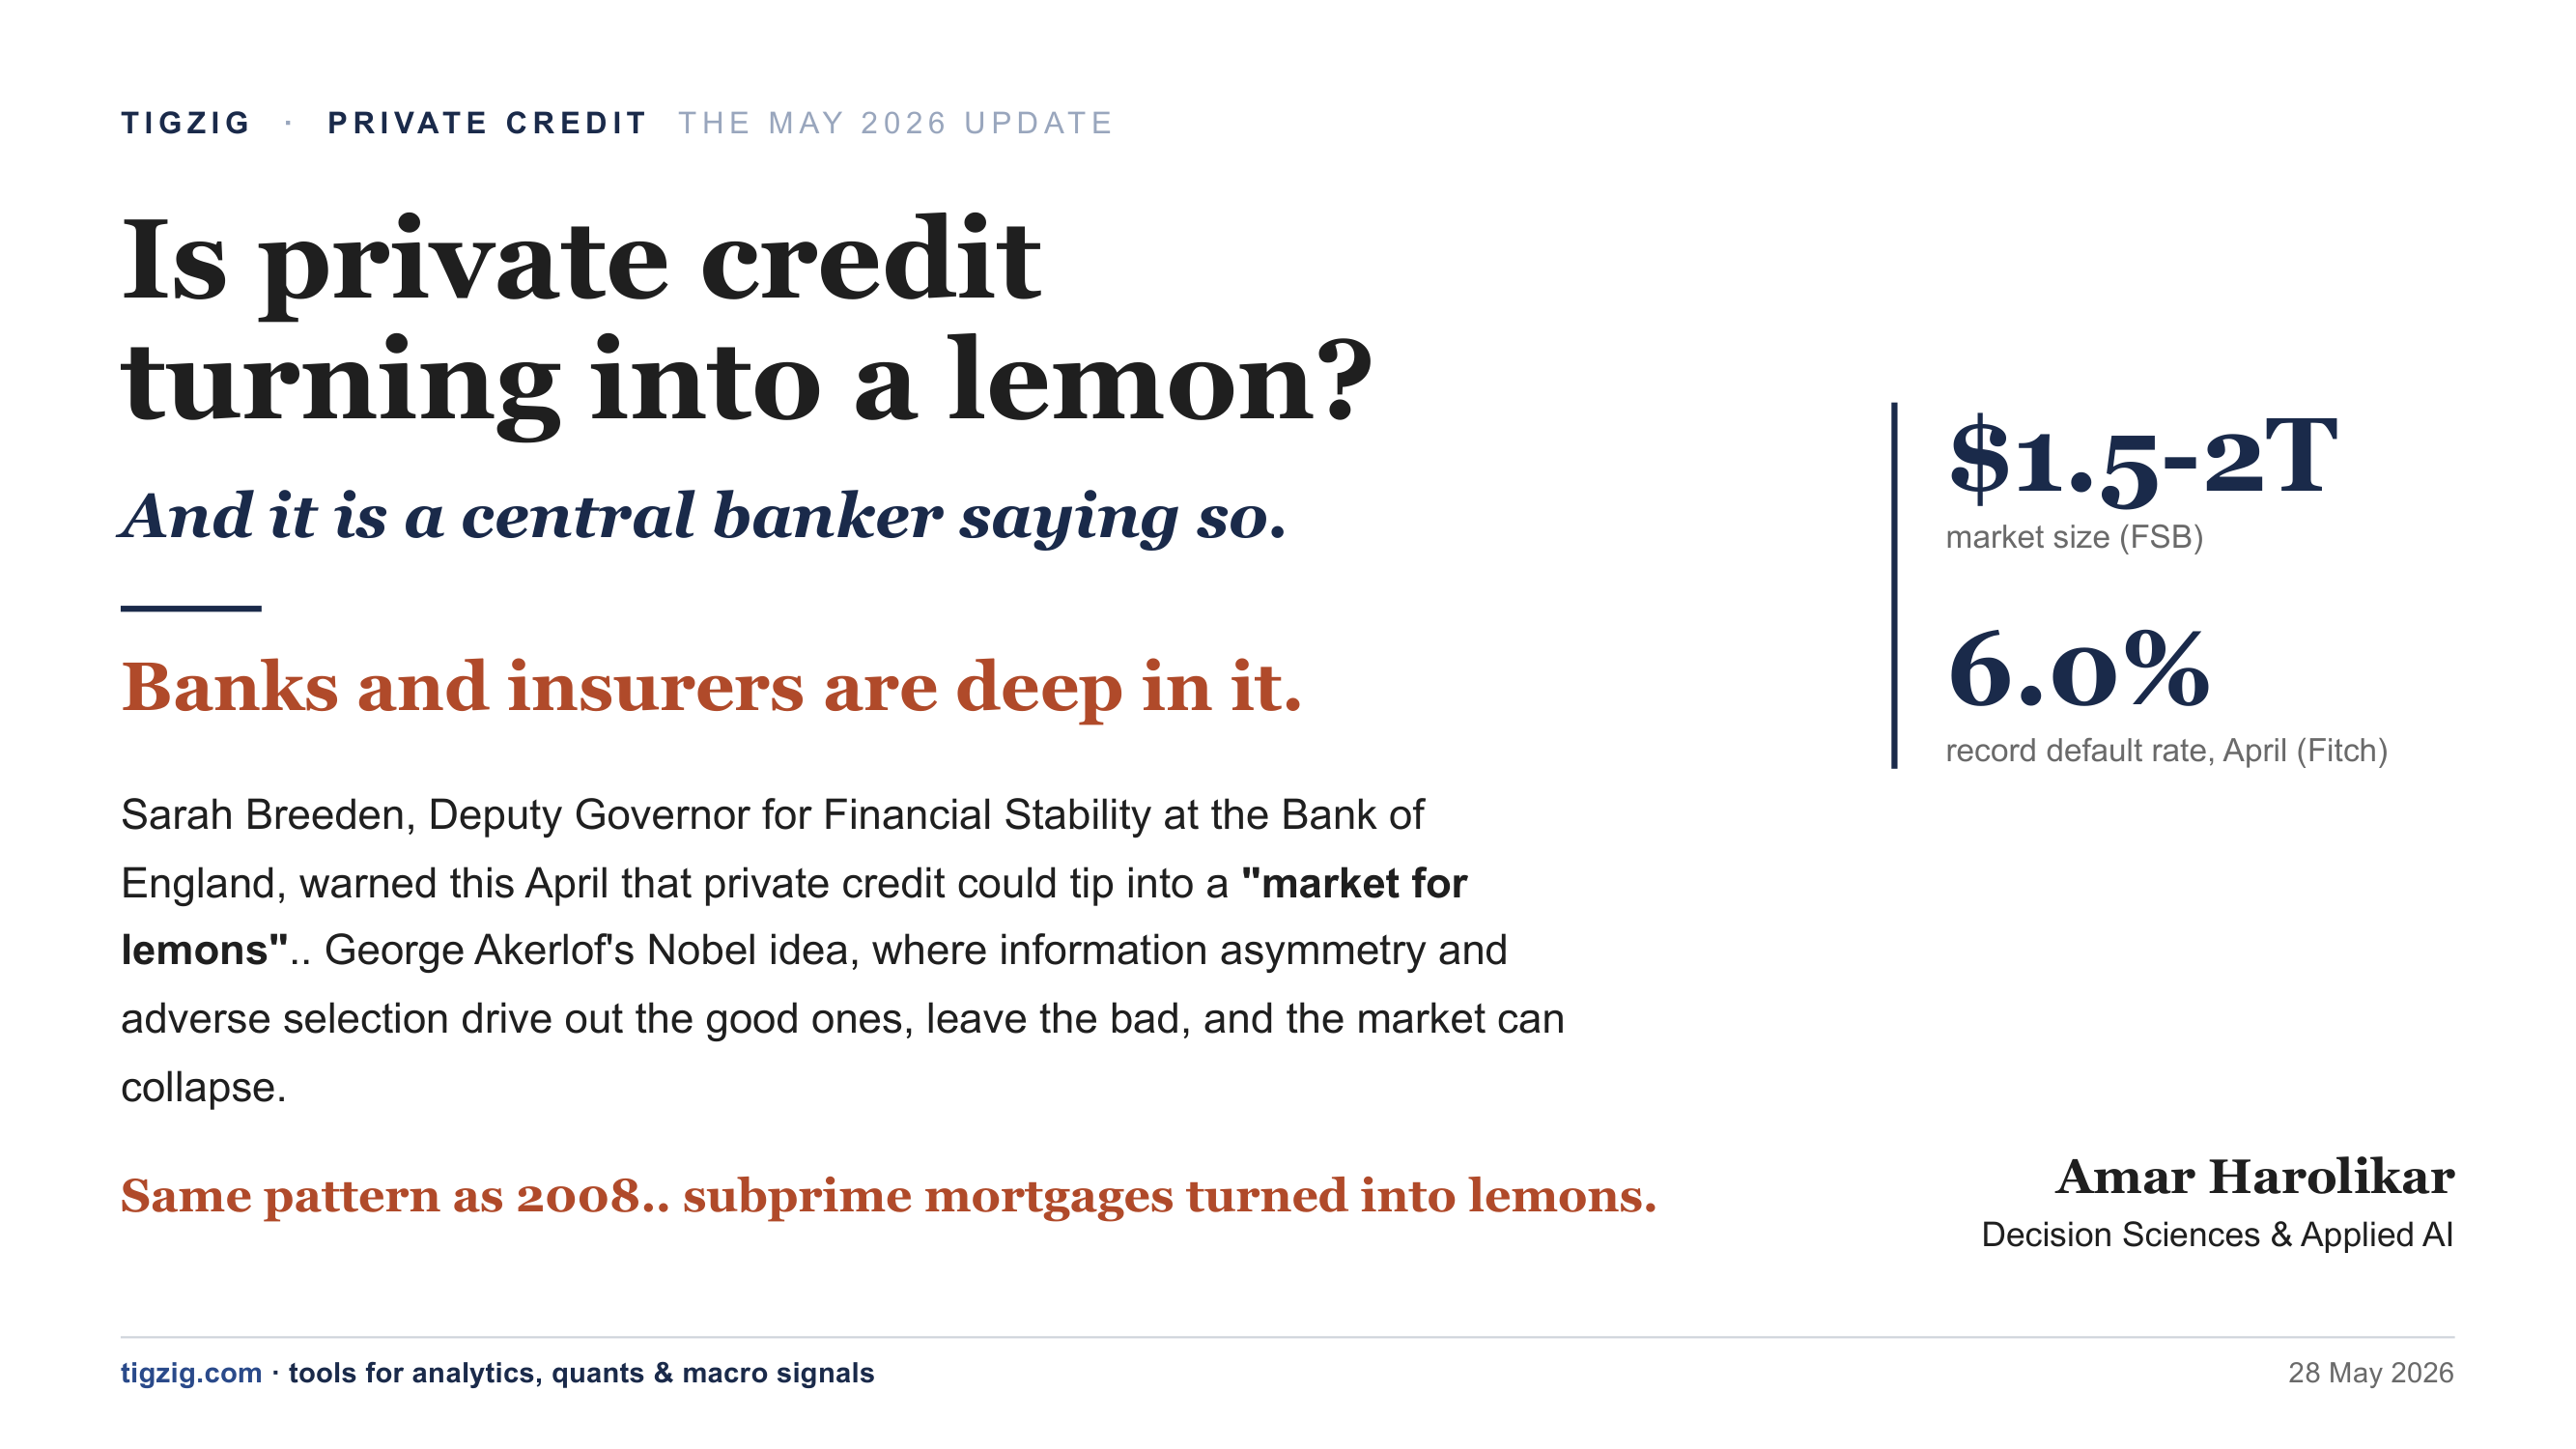
Is Private Credit Turning Into a Lemon? Bank of England Says So. Default Rate at a Record 6.0%. Banks and Insurers Deep In It.
Fourth dispatch in the private credit series. Bank of England's Sarah Breeden invokes Akerlof's 'market for lemons' - information asymmetry and adverse selection driving out the good ones. Fitch private credit default rate hits a record 6.0% in April (trailing 12 months); 9 in 10 'defaults' are PIK / interest deferral / maturity extensions, not bankruptcies. KKR rescues its own $12.3B FSK fund with $300M after JPMorgan-led banks cut the credit line by $648M. Manhattan US Attorney (SDNY) probes BlackRock TCPC's loan valuations after a 19% off-cycle NAV cut. US banks have extended ~$300B credit lines to private credit funds (JPMorgan $22B, Citi $22B direct). Insurers hold 10%+ of assets in private credit, 15%+ for PE-affiliated insurers like Athene and Global Atlantic. FSB, IMF, BoE, ECB, OCC, Fed and DOJ all moved in eight weeks. Layered-leverage pattern mirrors 2008 subprime. Includes 19-slide deck and 30+ source citations.
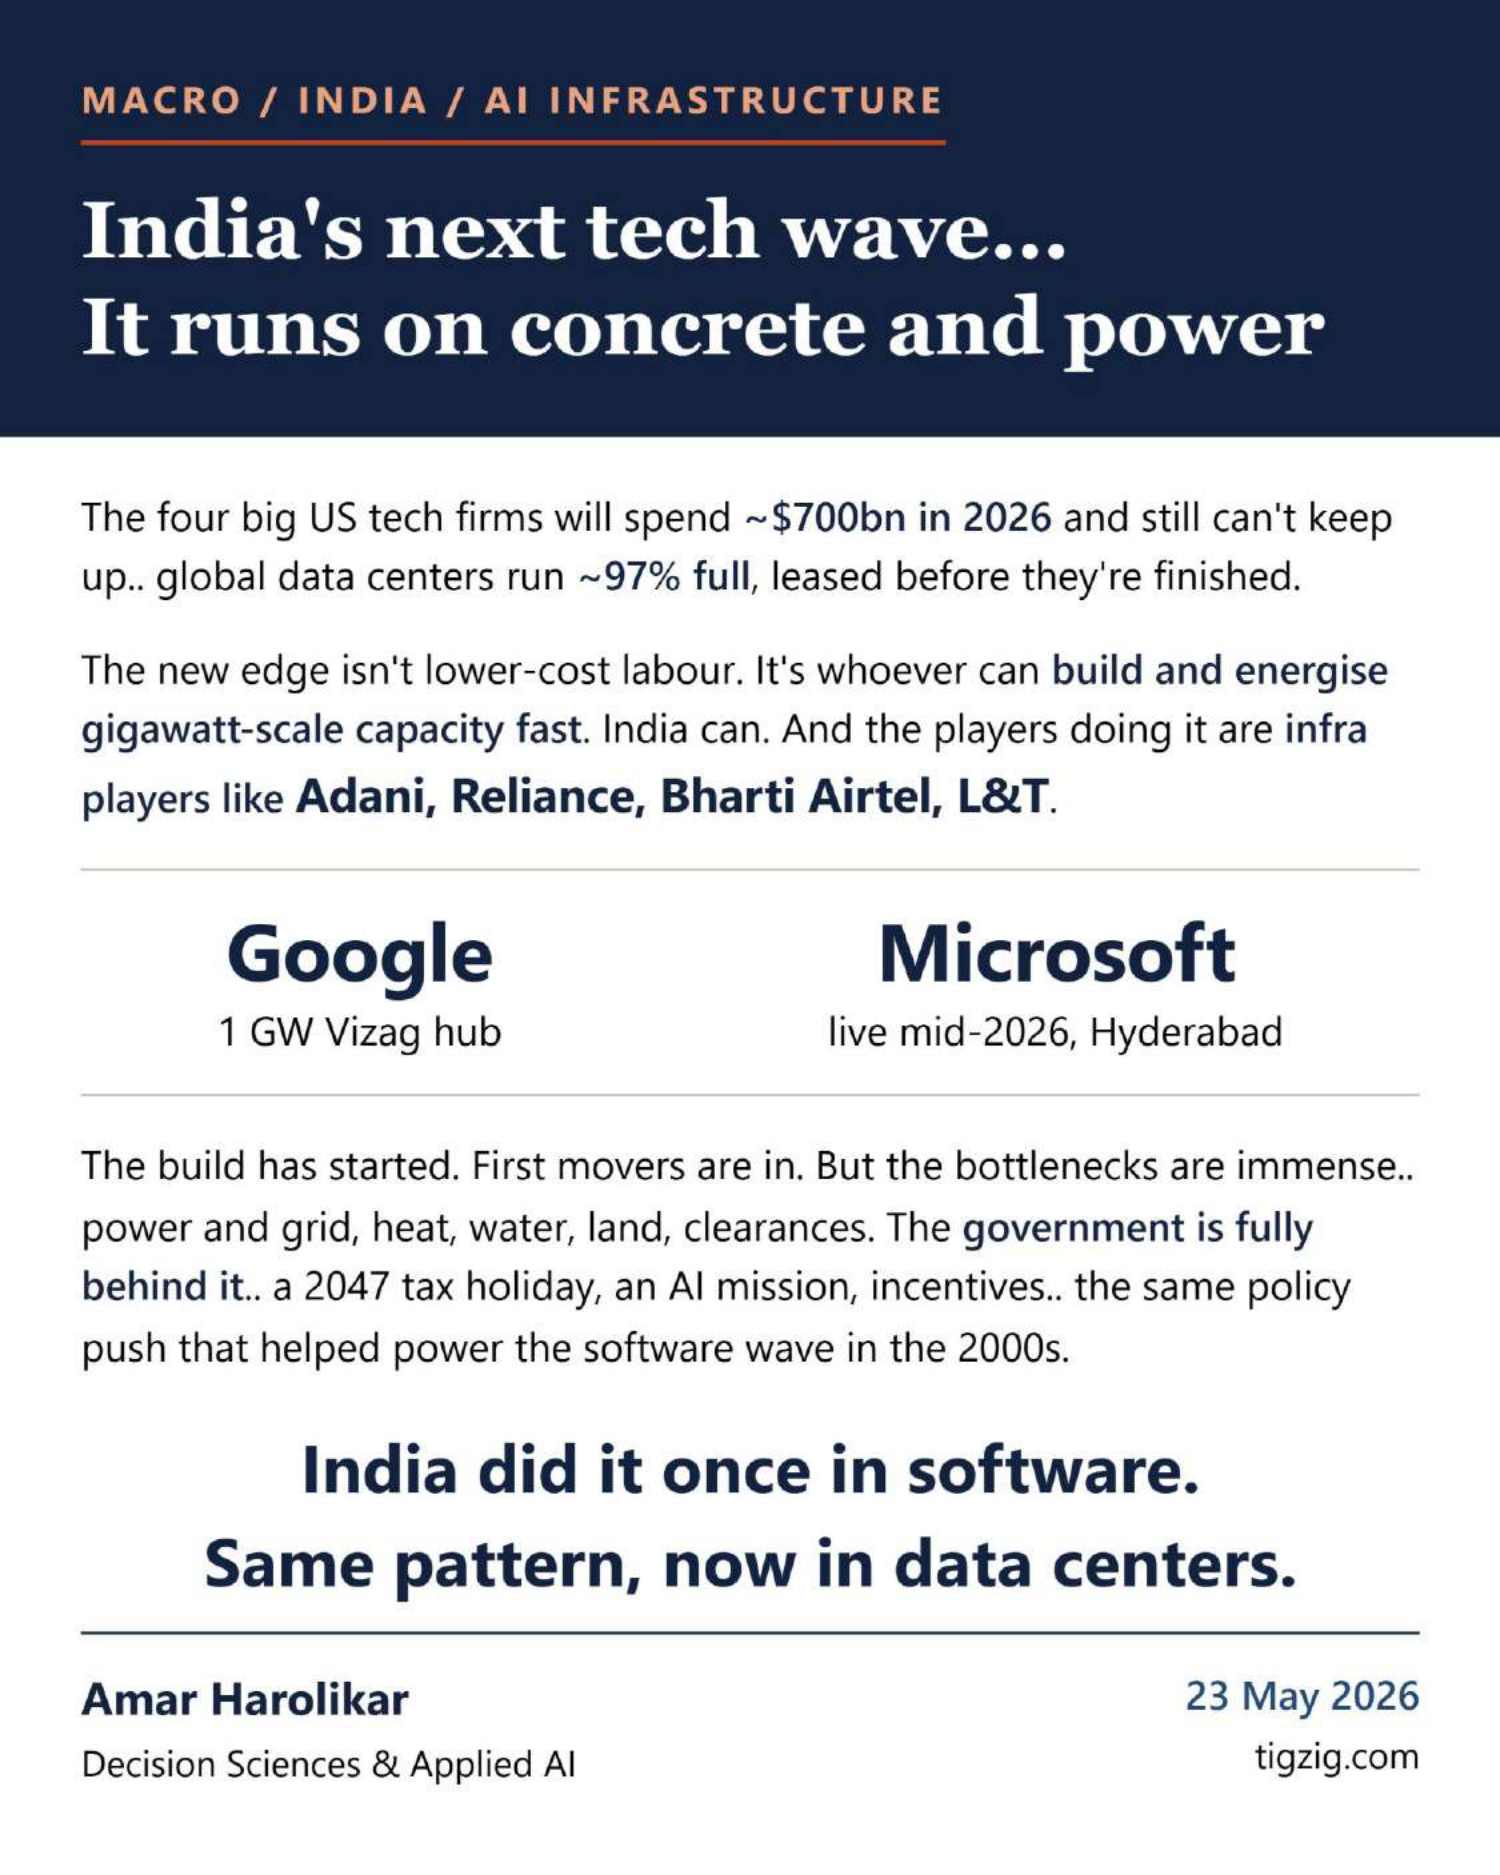
India's Next Tech Wave. AI Data Centers for the World. Adani, Reliance, Airtel, L&T. Same Pattern as Software in the 2000s.
India's next tech wave - AI data centers for the world - is being built by infra players Adani, Reliance, Bharti Airtel and L&T. World is out of compute and out of power - global data centers ~97% full, leased before they're finished. Big-4 US tech firms guided ~$700bn capex in 2026 and still can't keep up. First movers in India: Google's $15bn / 1 GW Vizag hub (largest outside US), Adani $100bn by 2035, Reliance $110bn / 7yr Jamnagar, Microsoft $17.5bn Hyderabad live mid-2026, AWS $12.7bn by 2030, TCS HyperVault. Government policy backing: 2047 tax holiday for foreign cloud firms, IndiaAI Mission, 15% safe harbour. India's edge isn't lower-cost labour - it's industrial build muscle for gigawatt-scale capacity. Risks covered: US-India relations and chip access, water and heat in stressed regions, land approvals. Includes 15-slide deck and full source links (JLL, McKinsey, CEEW, Jefferies, BIS, CNBC, Google, Microsoft, Adani, Reliance, etc.).
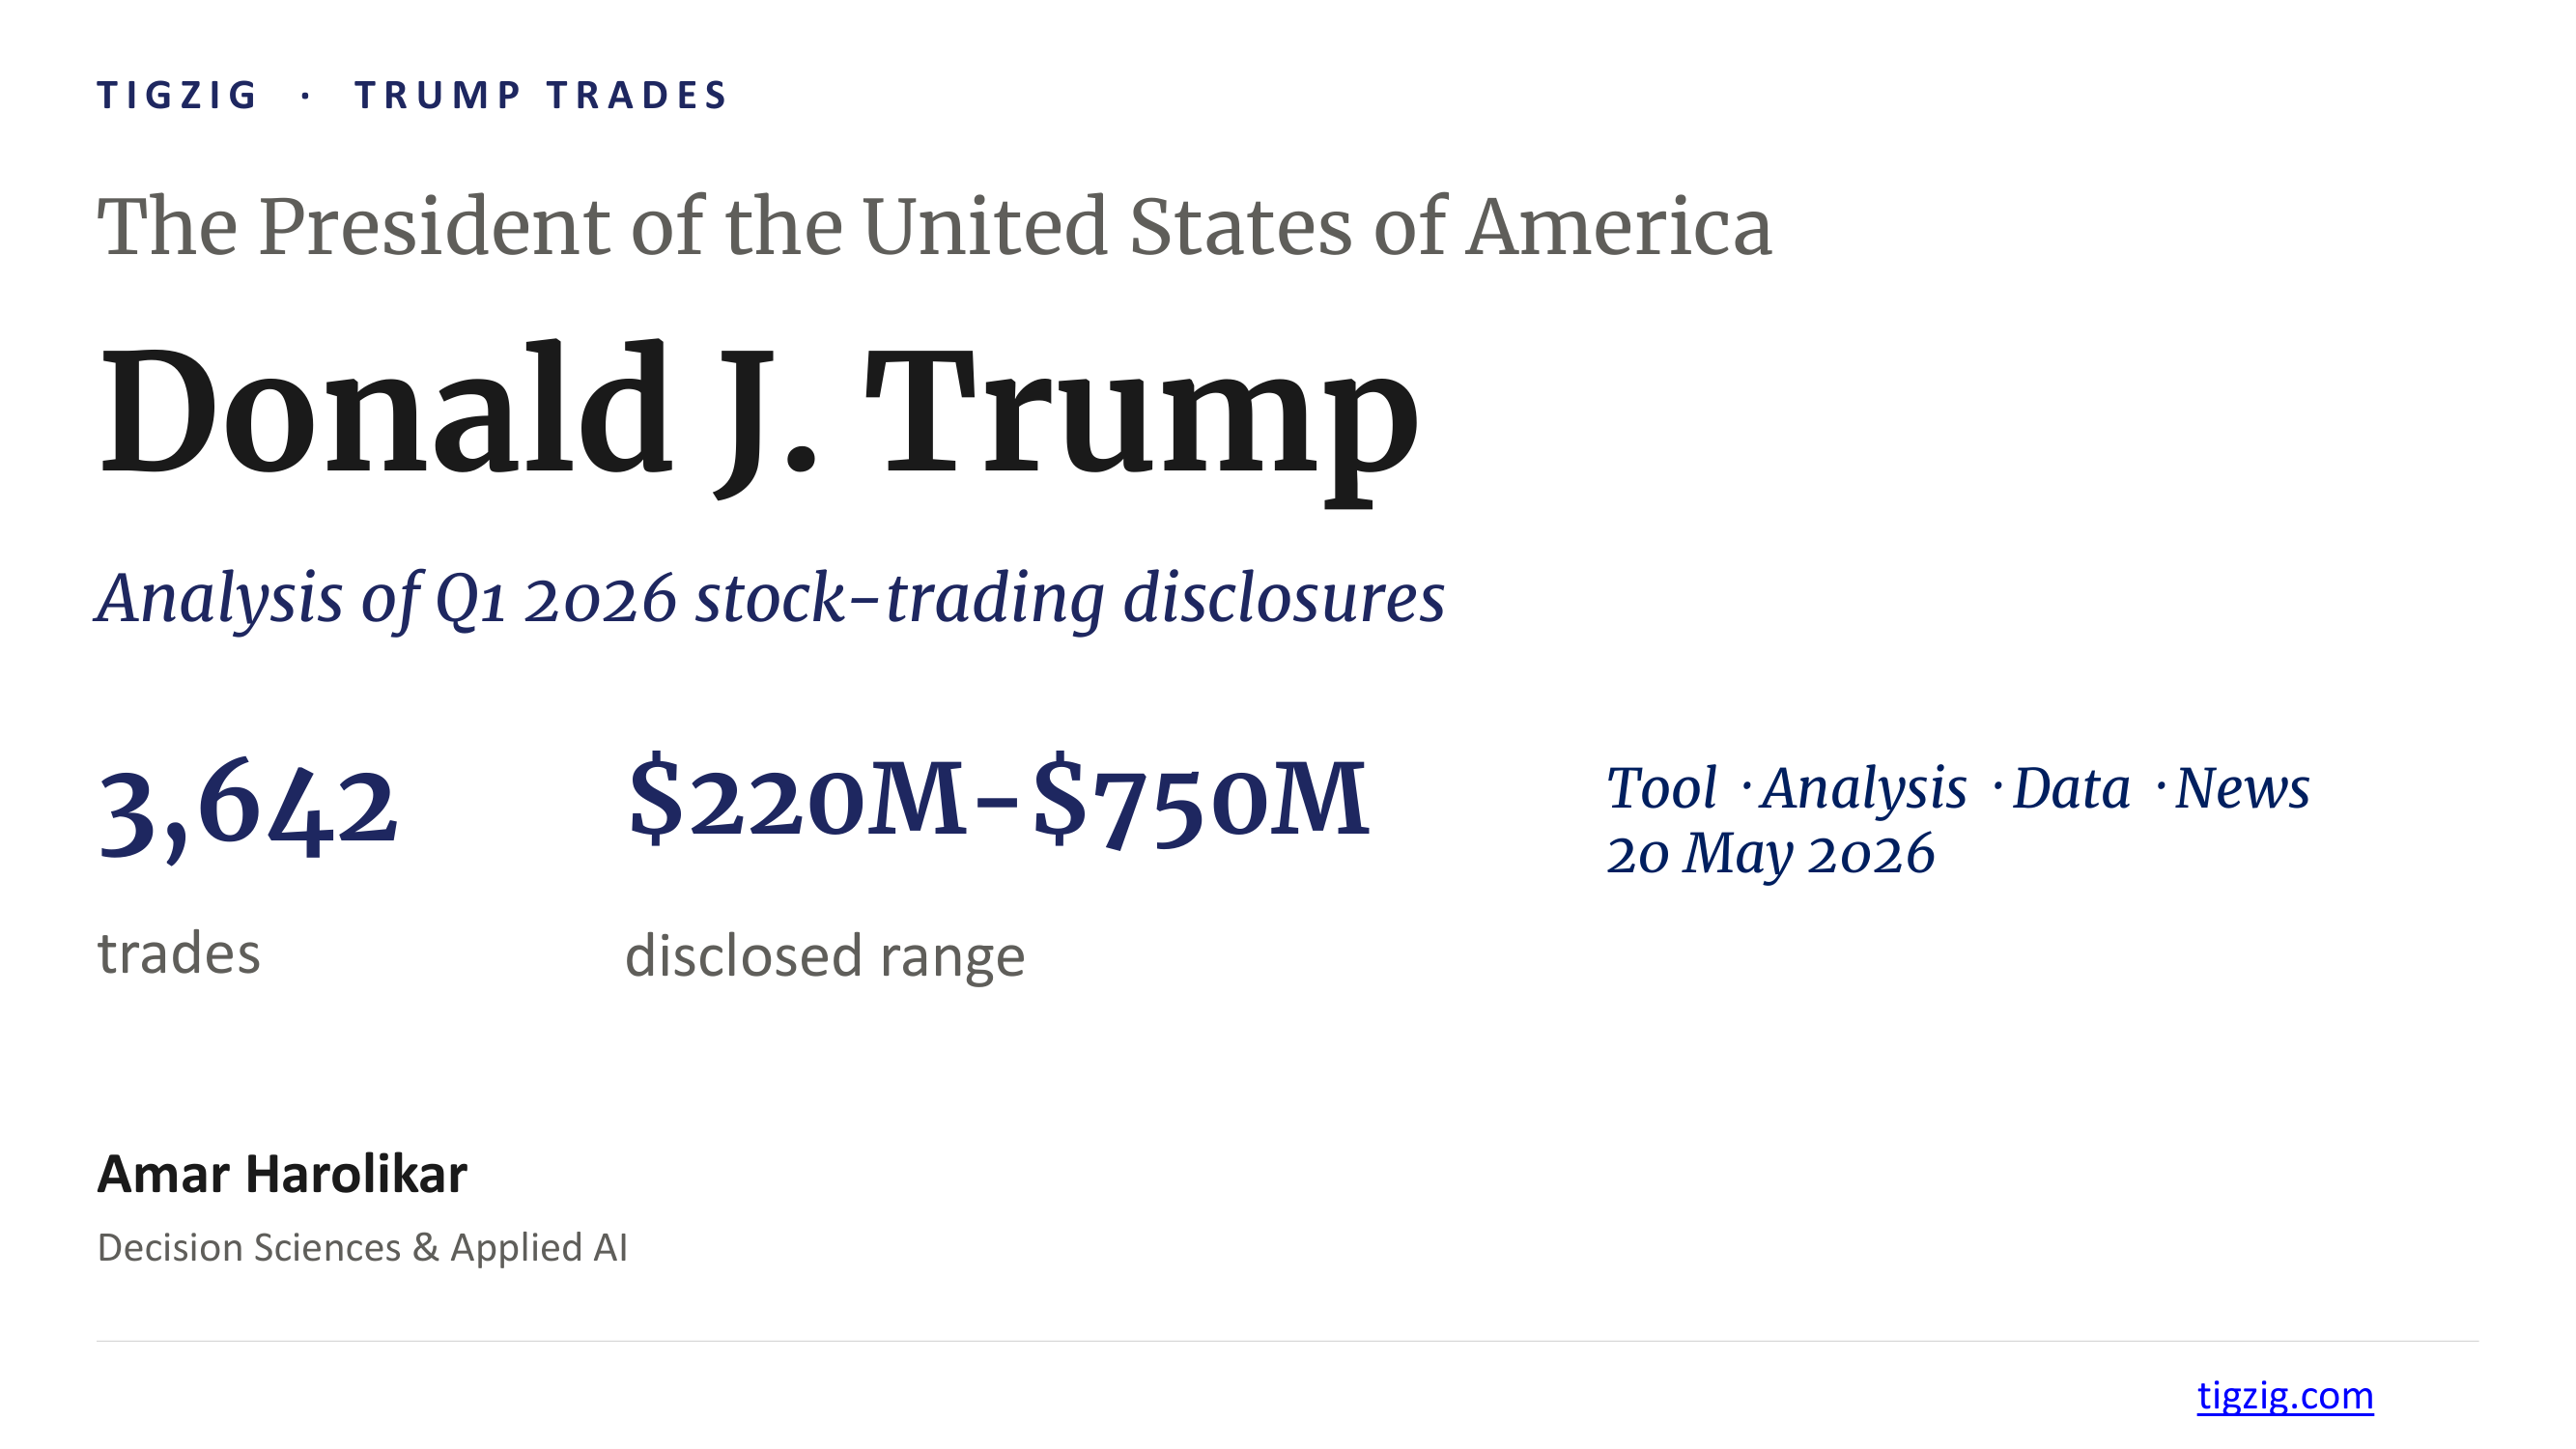
Trump Trades. From Mostly Bonds to 3,642 Equity Trades in One Filing. Free Tool to Search Every Transaction.
9 months of mostly bonds in President Trump's OGE filings broken by one filing on 14 May 2026 carrying 3,642 equity trades, $220M to $750M. Heavy activity in Nvidia, Apple, Microsoft, Amazon, Meta, Oracle. 15 filings since Aug 2025 - earlier 14 combined had 1,726 trades almost all bonds. Built a free interactive tool on top of the OGE PDFs - every transaction searchable across 1,058 tickers, click any company to see trade timeline overlaid on price chart, CSV download. Short analysis deck included on most active tickers, top buys, top sells, and policy overlaps press has flagged.
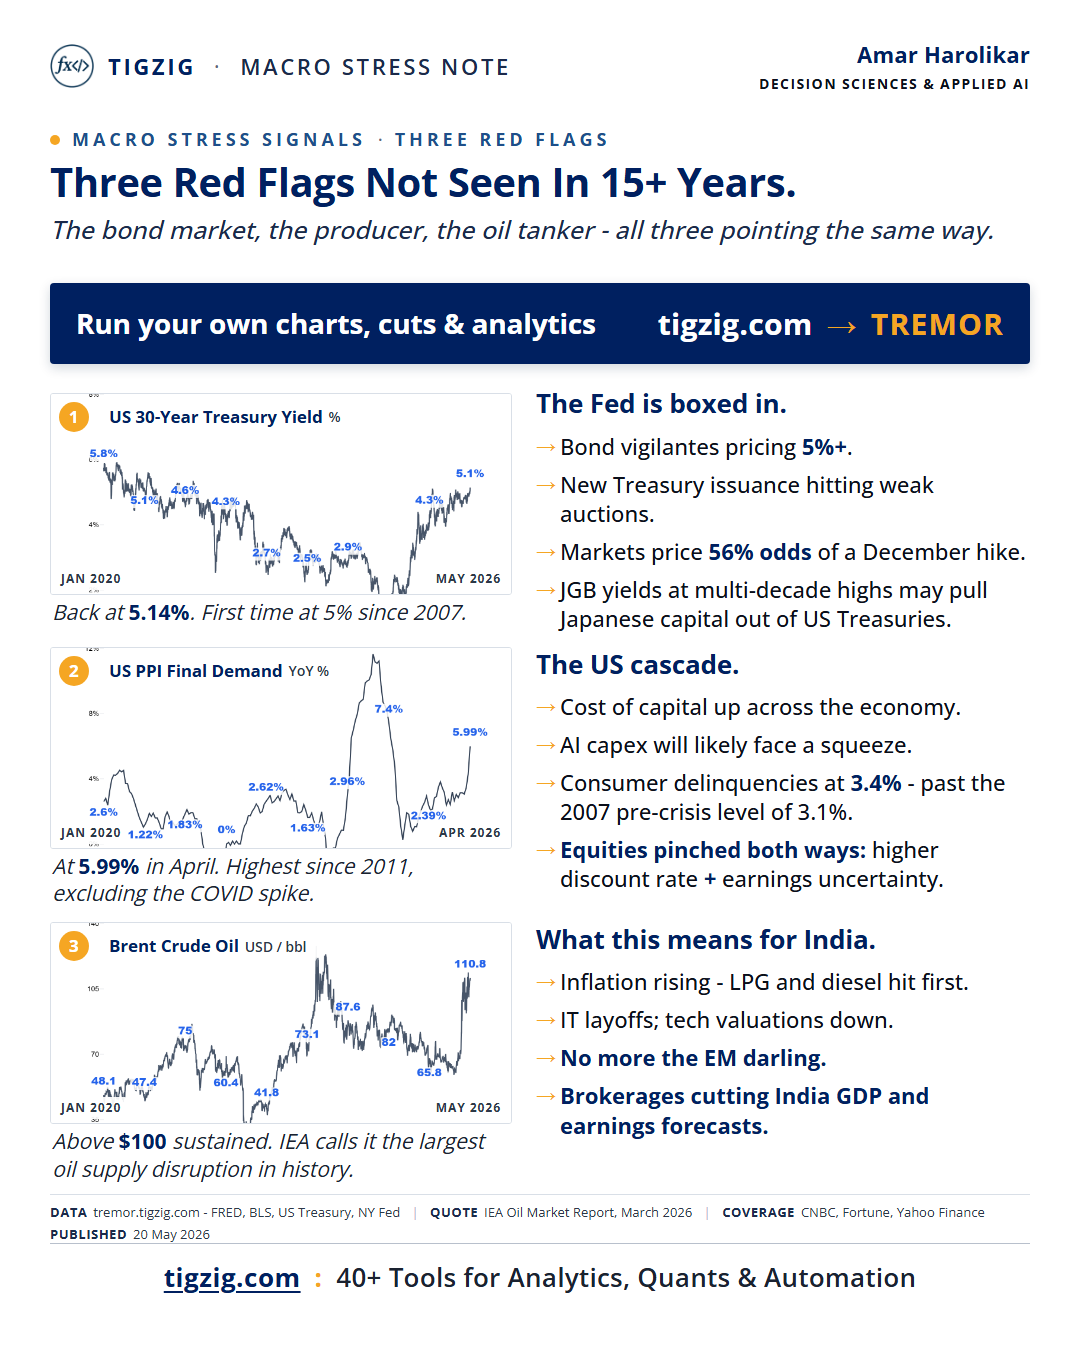
Three Red Flags Hit Together. 30Y at 5.14%, PPI at 5.99%, Brent Above $100. Setup Worse Than 2000 or 2007.
Three macro red flags hit at the same time, each a major disruptor on its own: US 30-year Treasury yield 5.14% (first since 2007), US Producer prices 5.99% (15-year high ex-COVID), Brent above $100 (IEA calls it the largest oil supply disruption in history). Alongside: S&P 7,400 with CAPE 39.6 (2nd-highest in 145 years), auto loan losses past 2007 GFC peak, unemployment near Q3 2007 levels, Mag 7 ~35% of S&P (NVIDIA alone 8.9%). The last time these general patterns showed up: 2000 and 2007. 2026 is looking worse.
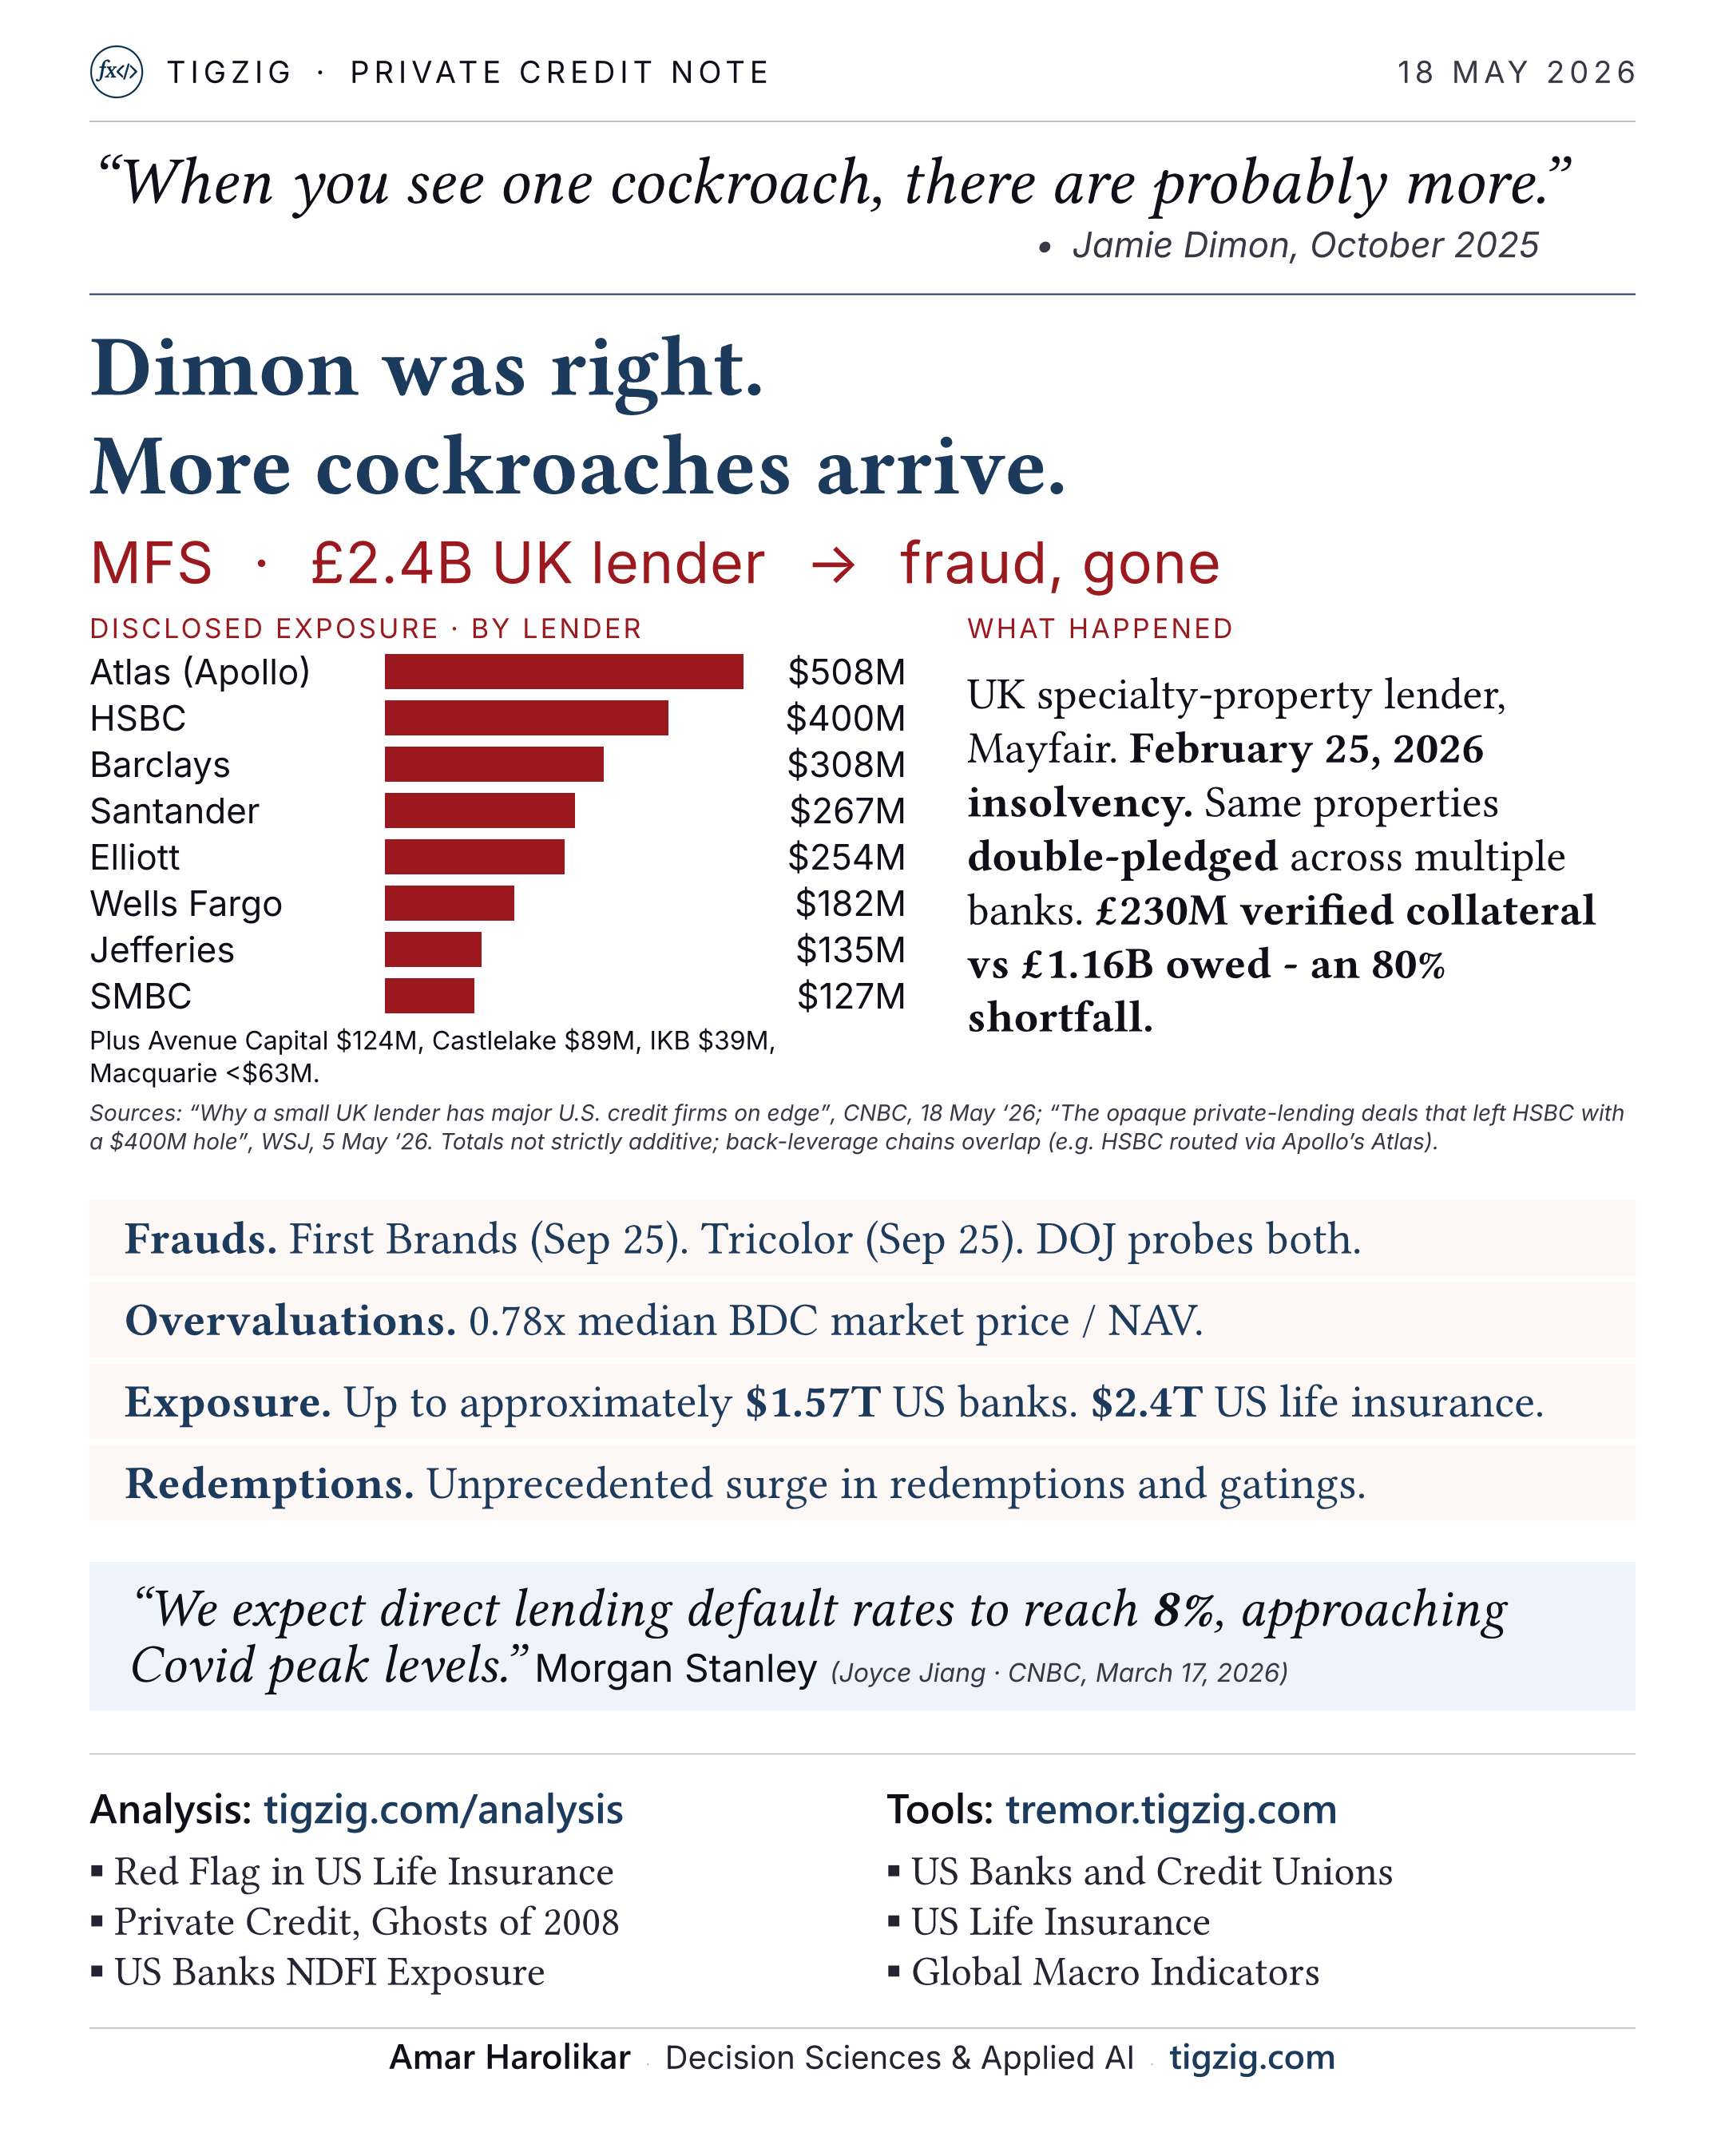
Dimon Was Right. More Cockroaches Arrive. UK Lender MFS Collapses - $2.5B Across 12+ Global Banks.
UK lender MFS collapsed in February with $2.5B exposure across 12+ global banks - Barclays $308M, HSBC $400M, Atlas/Apollo $508M, Santander $267M, Elliott $254M, Wells Fargo $182M. £2.4B loan book, fraud and double-pledging allegations. £230M verified collateral against £1.16B owed (80% shortfall). Affiliated lending chain: HSBC > Apollo Atlas > Zircon Bridging > MFS.
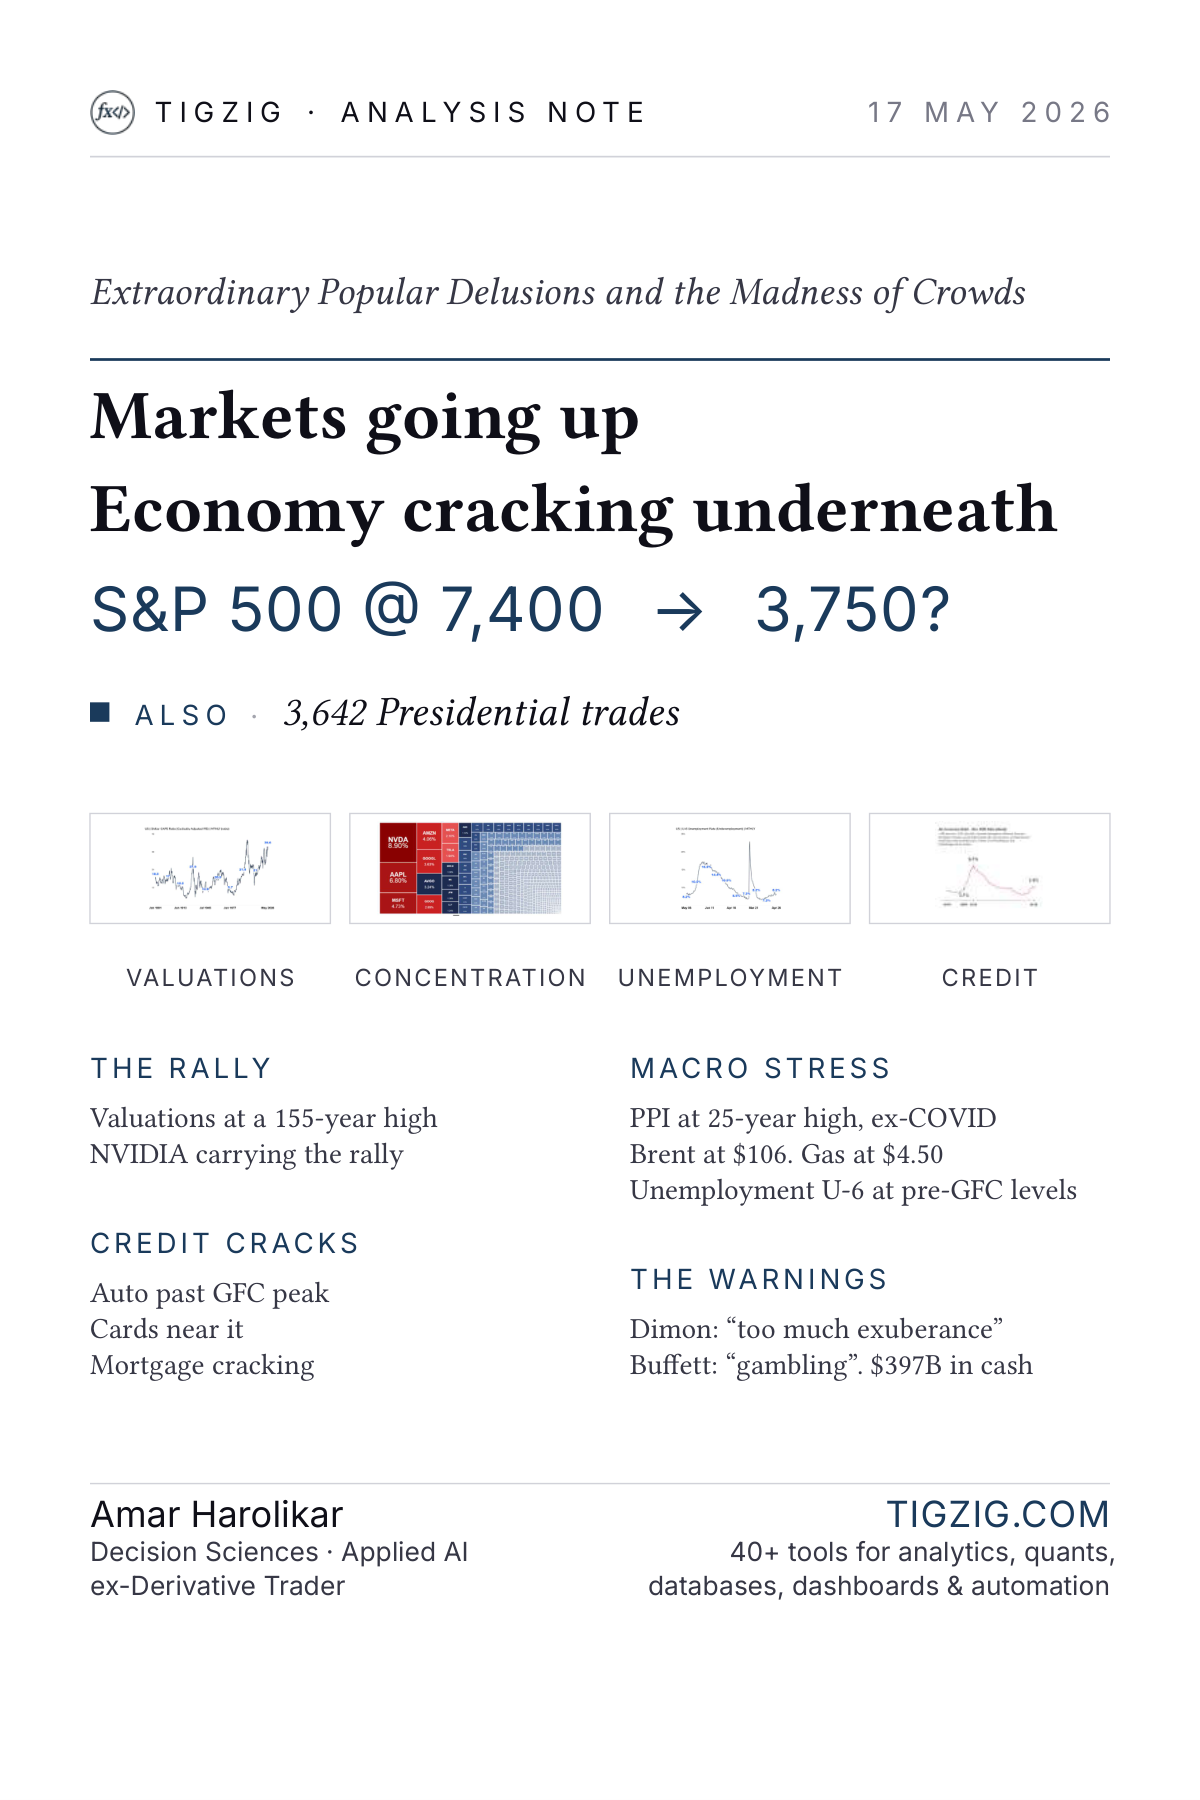
S&P at 7,400. Irrational Exuberance. The Last Two Times This Setup Held, the Index Halved.
S&P 500 at 7,400 with Irrational Exuberance. Last two times setup held: 2000 dot com -49% in 30 months, 2007 subprime -57% in 17 months. Apply pattern math, S&P lands 3,200-3,800. CAPE 39.6 (2nd time in 145 years), auto delinquencies past GFC peak, U-6 back to pre-GFC, PPI 25-year high ex-COVID, Brent $106. Dimon: too much exuberance. Buffett on $397B cash.
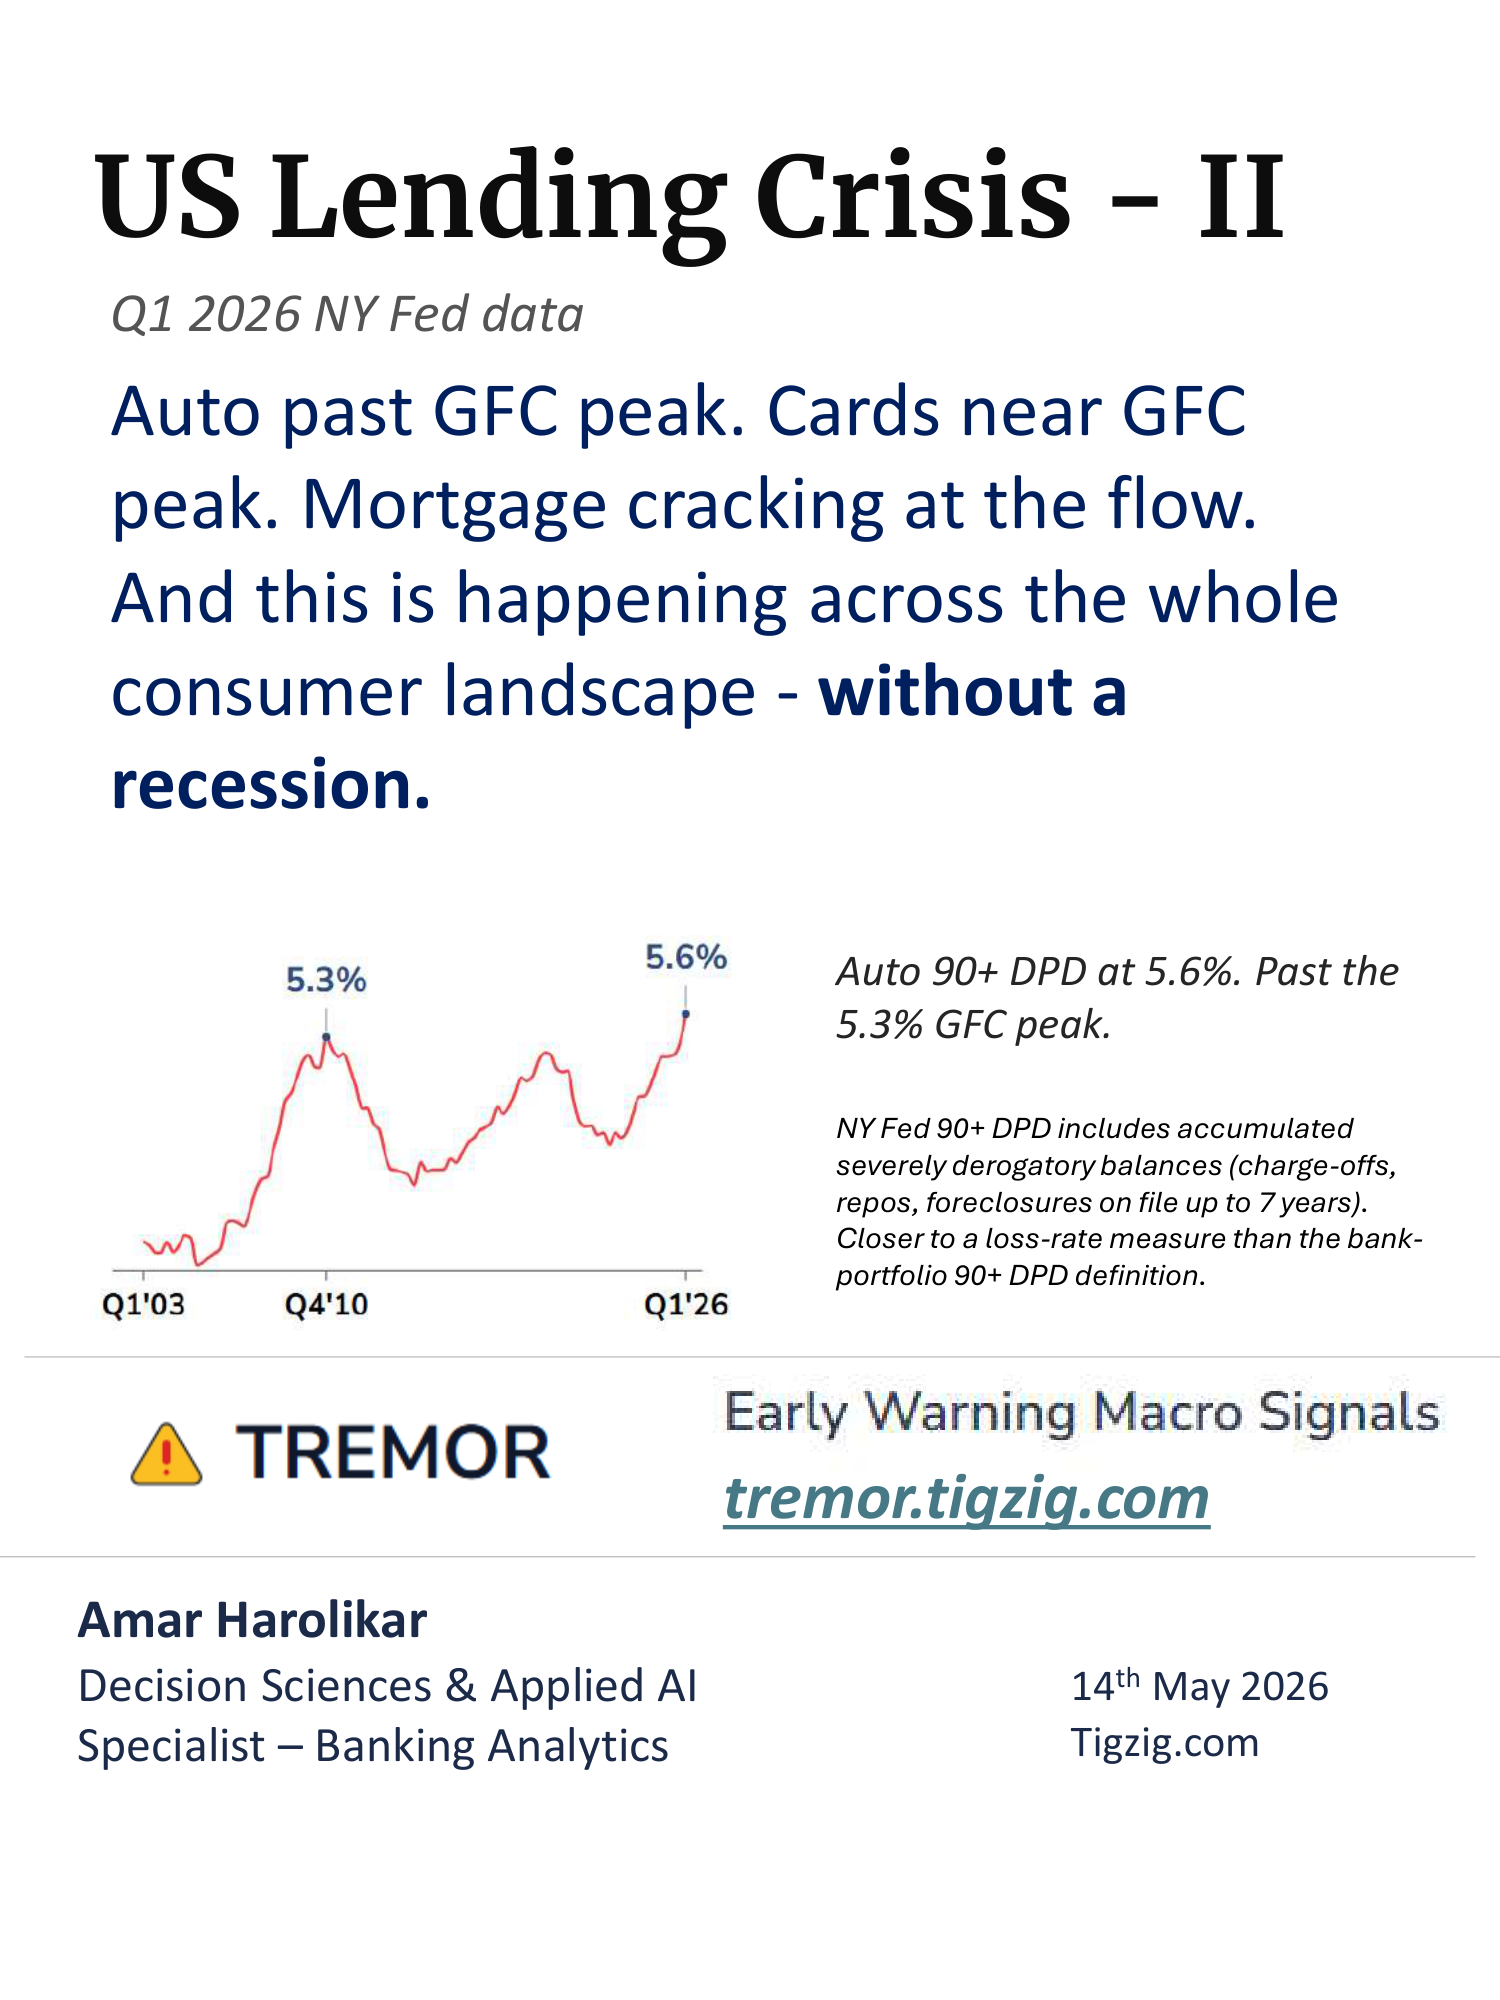
US Consumer Lending Is Already at Crisis-Level Numbers - Without a Recession. NY Fed Q1 2026 Data.
NY Fed Q1 2026 release. Auto delinquencies past GFC peak. Cards near it. Mortgage stock calm but flow rate cracking. HELOC usage and delinquencies rising. Home prices down 9% from 2022 peak. U-6 unemployment back to pre-GFC 2007 levels. Underwater mortgages up in 45 states YoY. Crisis numbers without a recession.
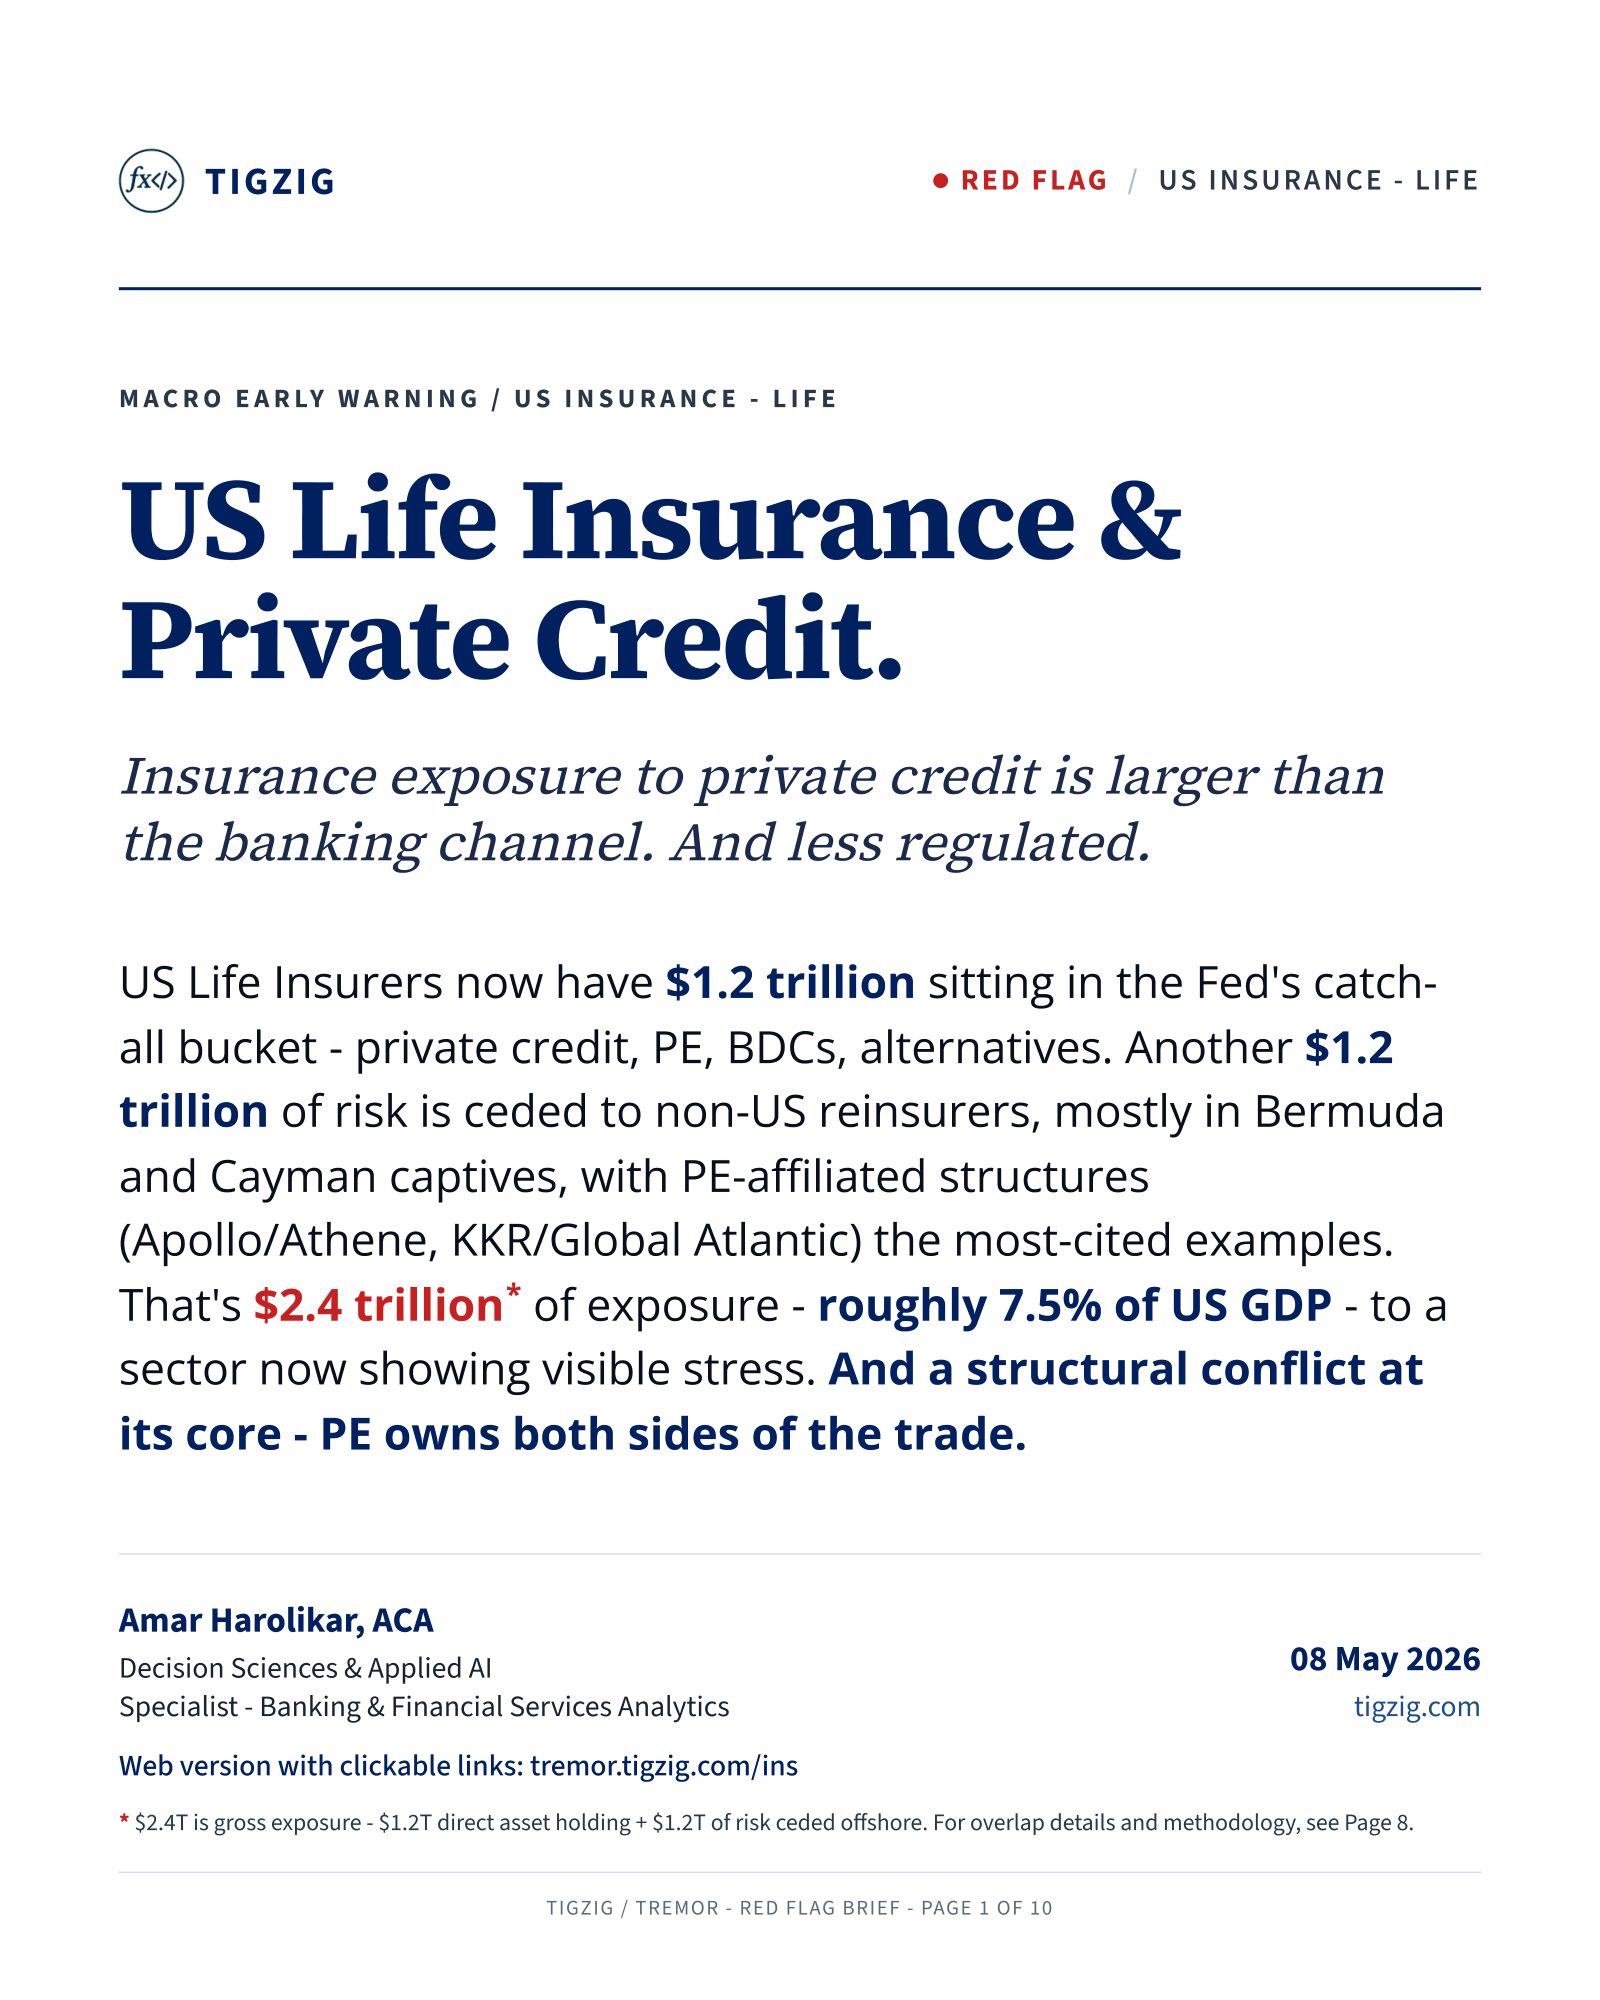
Red Flag in US Life Insurance. $2.4T (7.5% of GDP) in Private Credit and Offshore Reinsurance.
US Life Insurers have $2.4T (7.5% of US GDP) in private credit and offshore reinsurance. $1.2T in Fed Unidentified Misc Assets, $1.2T offshore reinsurance memo. Both nearly doubled in 5 years. PE-affiliated loop - same firms own insurers, credit funds and offshore reinsurers. Doom loop risk if retirees surrender annuities en masse.
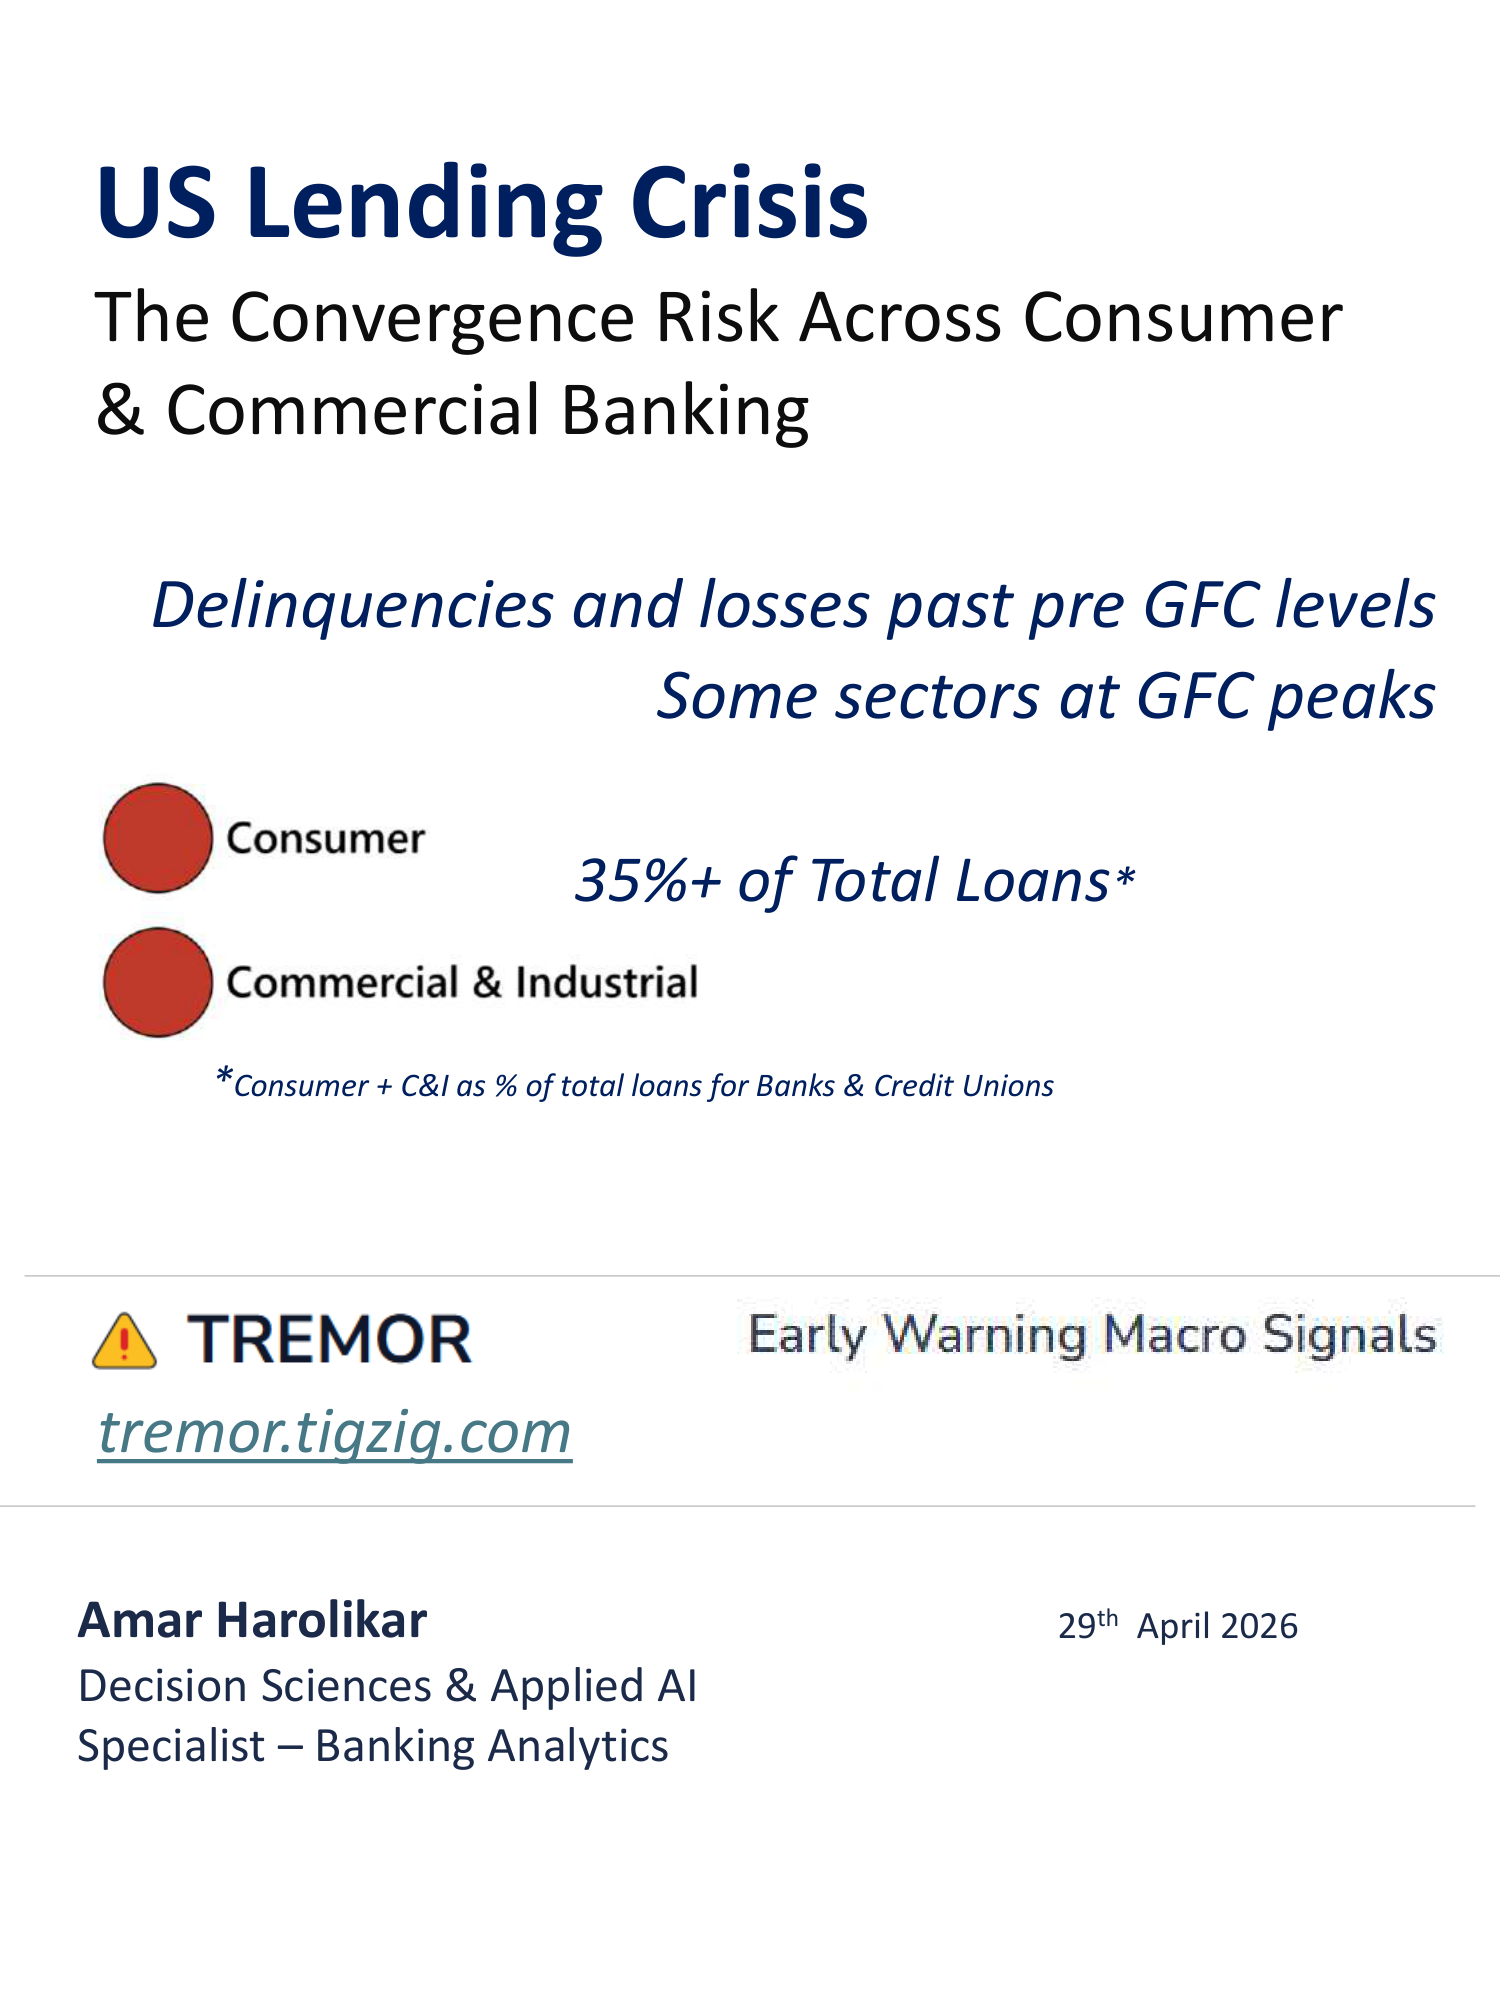
The Convergence Risk. Credit Stress Already Past 2007 Pre-Crisis. Five Aggravators Stacking On Top.
Multiple credit stress signals at the same time across US banks, credit unions, consumer debt. Past 2007 pre-crisis on most metrics. Auto loans already at GFC peak. 5 aggravators on top - AI labor shock, U-1 above 2007, GDP at 0.5%, Brent $100+, private credit stress with $2.5T+ exposure. Warnings from Jamie Dimon and Sarah Breeden.

US Credit Unions on TREMOR. Card Charge-Offs at 5.11% - Already Past the 2009 GFC Peak.
US Credit Unions analytics on TREMOR. 23 years, 86 quarters, $1.72T loans across 4,287 federally-insured credit unions from NCUA quarterly FPR. Card NCO at 5.11% past 4.68% GFC peak. Consumer NCO at 1.82% vs 0.99% pre-crisis. 18 segments, 30-59 DPD, 60+ DPD, NCO. CSV download with 74-field reference.
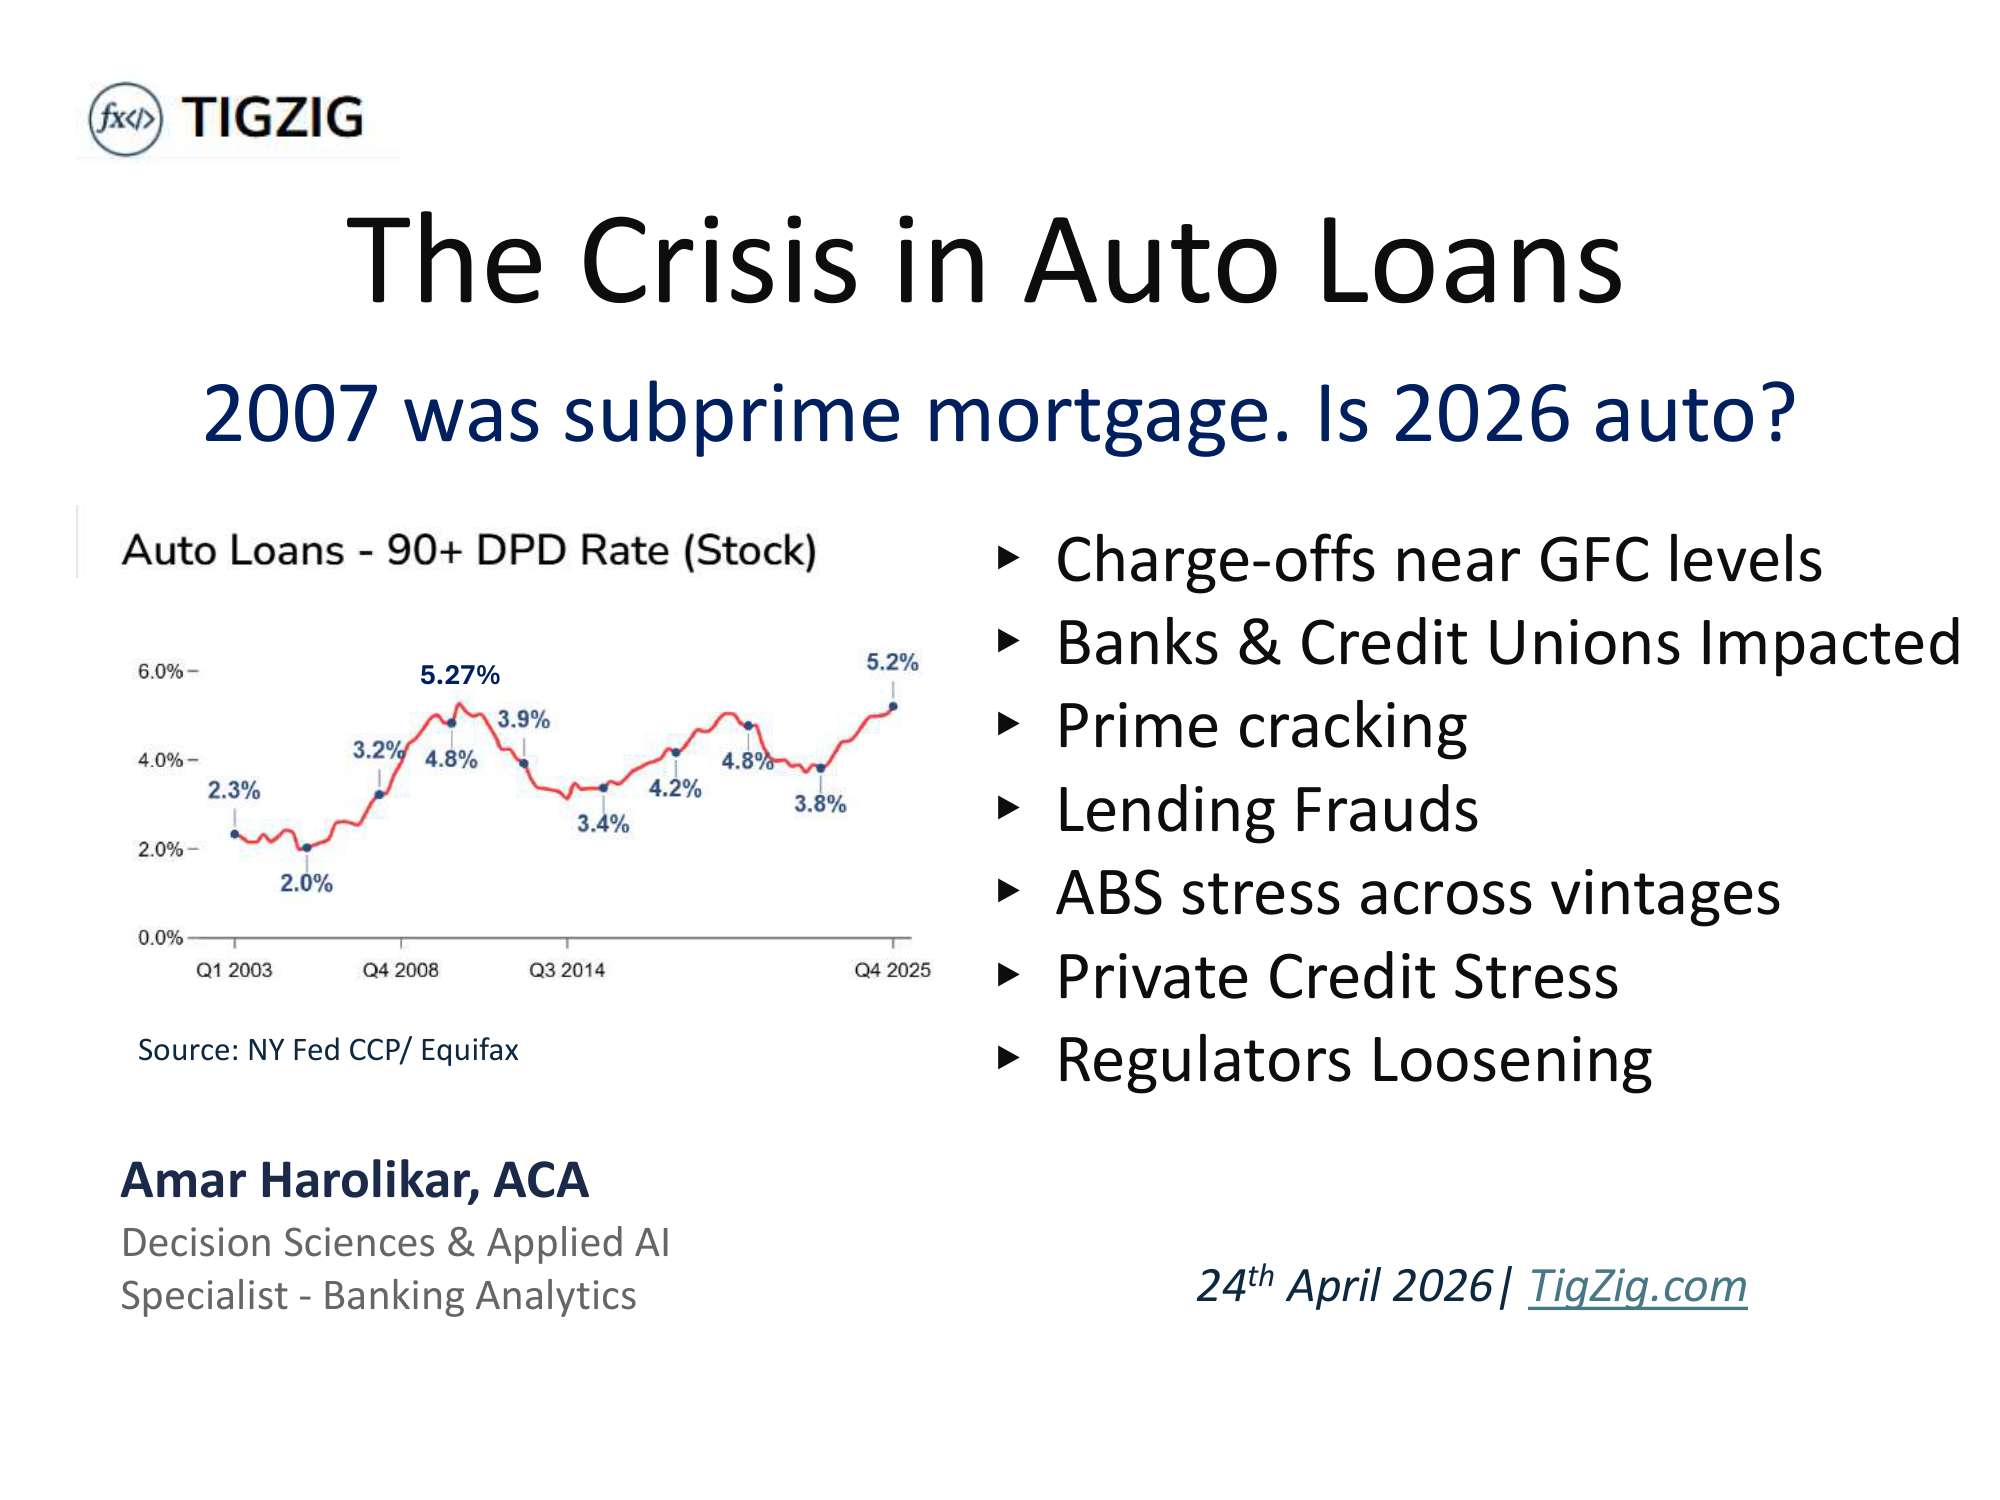
The Crisis in Auto Loans. 2007 was Sub-Prime Mortgage. Is 2026 Auto?
NY Fed Auto 90+DPD at 5.21% vs 5.27% at GFC peak. Bank auto NCO at 2x 2011 baseline. Credit union NCO at 0.95% record high. S&P ABS subprime NCO ~10%. Tricolor fraud $800M. First Brands fraud $2.3B. $1.67T direct exposure plus $350B in ABS. FDIC SDI, NY Fed CCP, NCUA, S&P Global, FFIEC analysis.
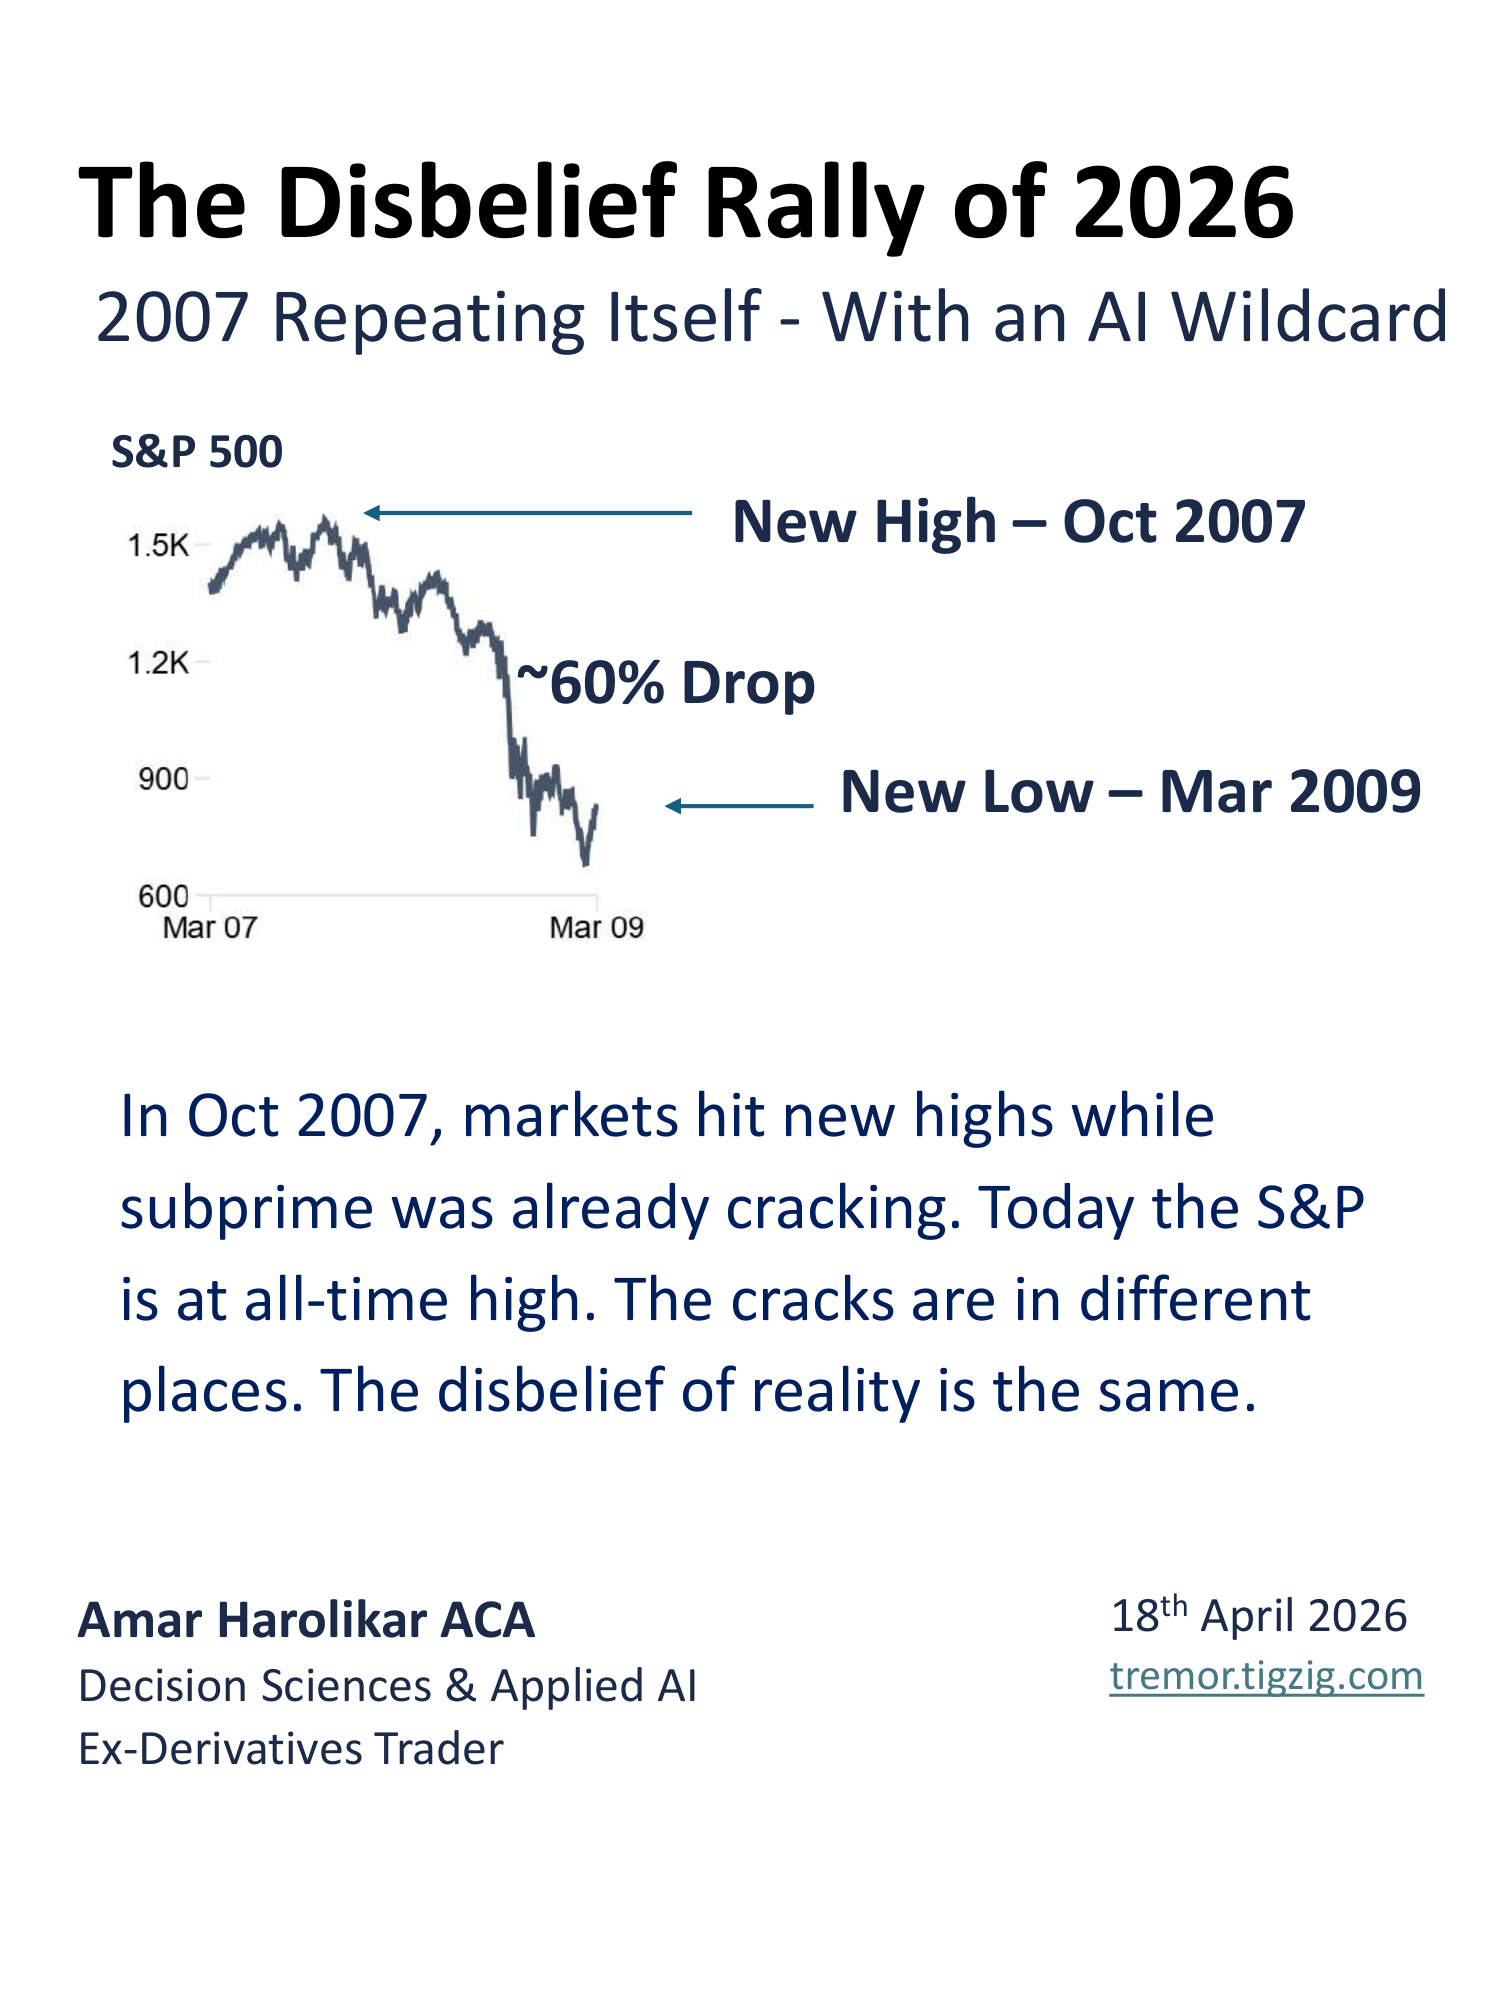
S&P at All-Time High. Under the Hood, Things Are Cracking. Just Like October 2007.
S&P at ATH while private credit at 2x 2007 subprime showing stress. Credit card and auto delinquencies above 2007 pre-crisis. Bank charge-offs higher than 2007. AI displacing workers at unprecedented pace inside a stress cycle. Tracking across FFIEC, FDIC, NY Fed, IEA, Challenger, Anthropic Economic Index.
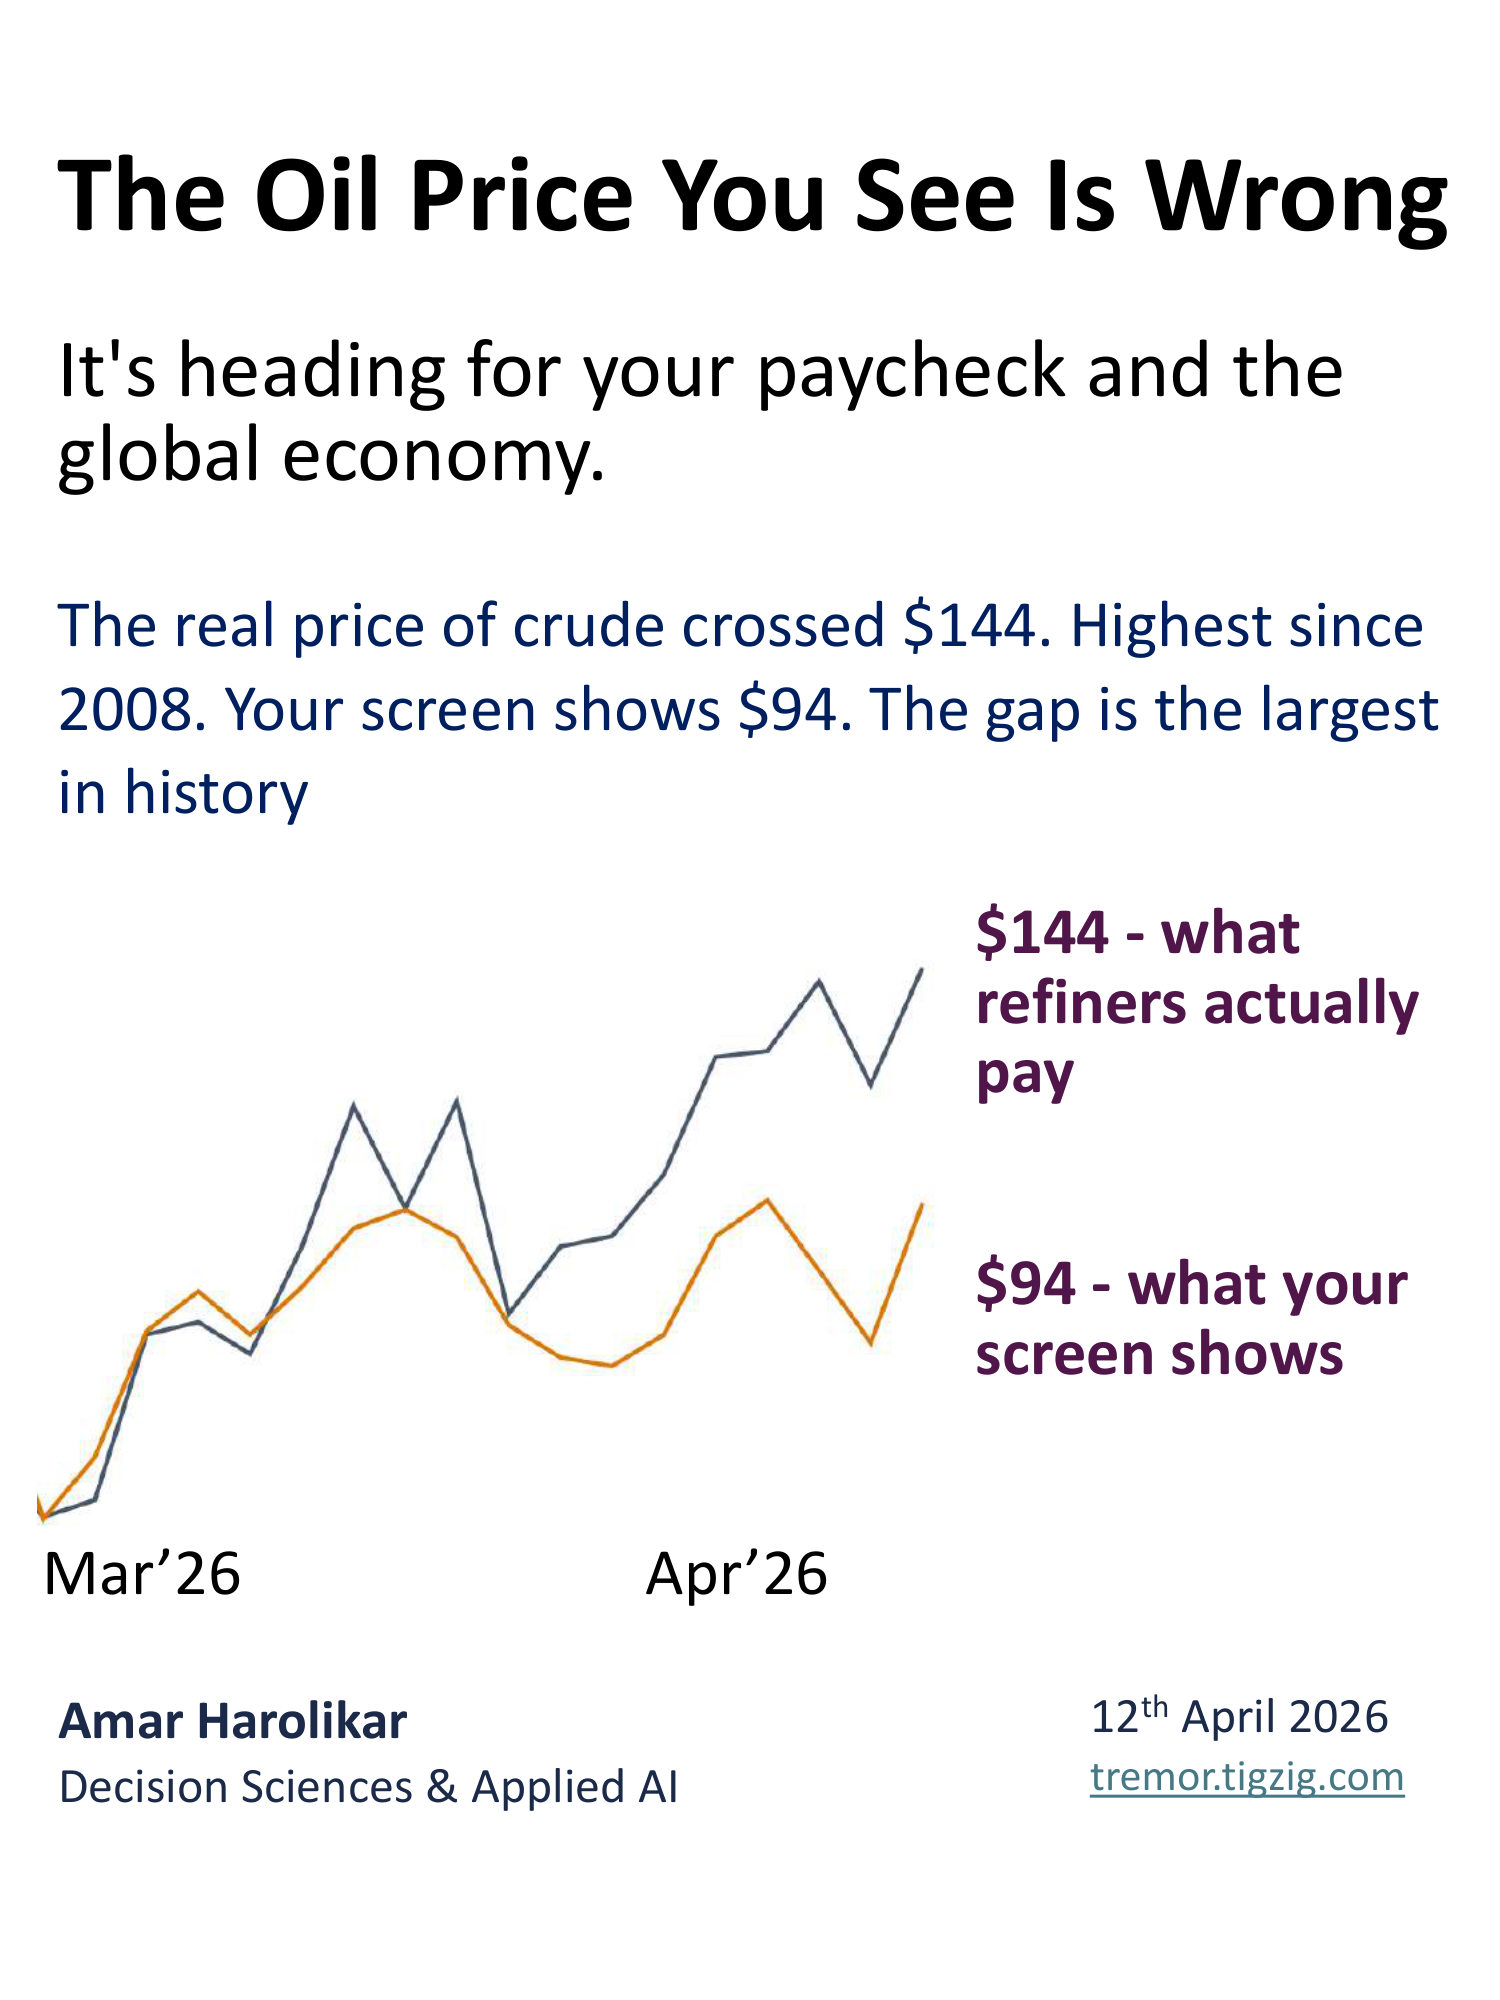
The Masking Effect in Oil Markets - The Price You See on Screens Is Hiding a $50 Supply Shock
Largest spot-futures divergence in oil market history. Brent futures at $94, physical crude at $144. Analysis of 9,864 trading days since 1987. 40 bids vs 4 offers in North Sea. Diesel near $200/bbl. US gasoline inventories at 16-year lows. Hormuz shut 40 days, Kuwait says 3-4 months to restore.
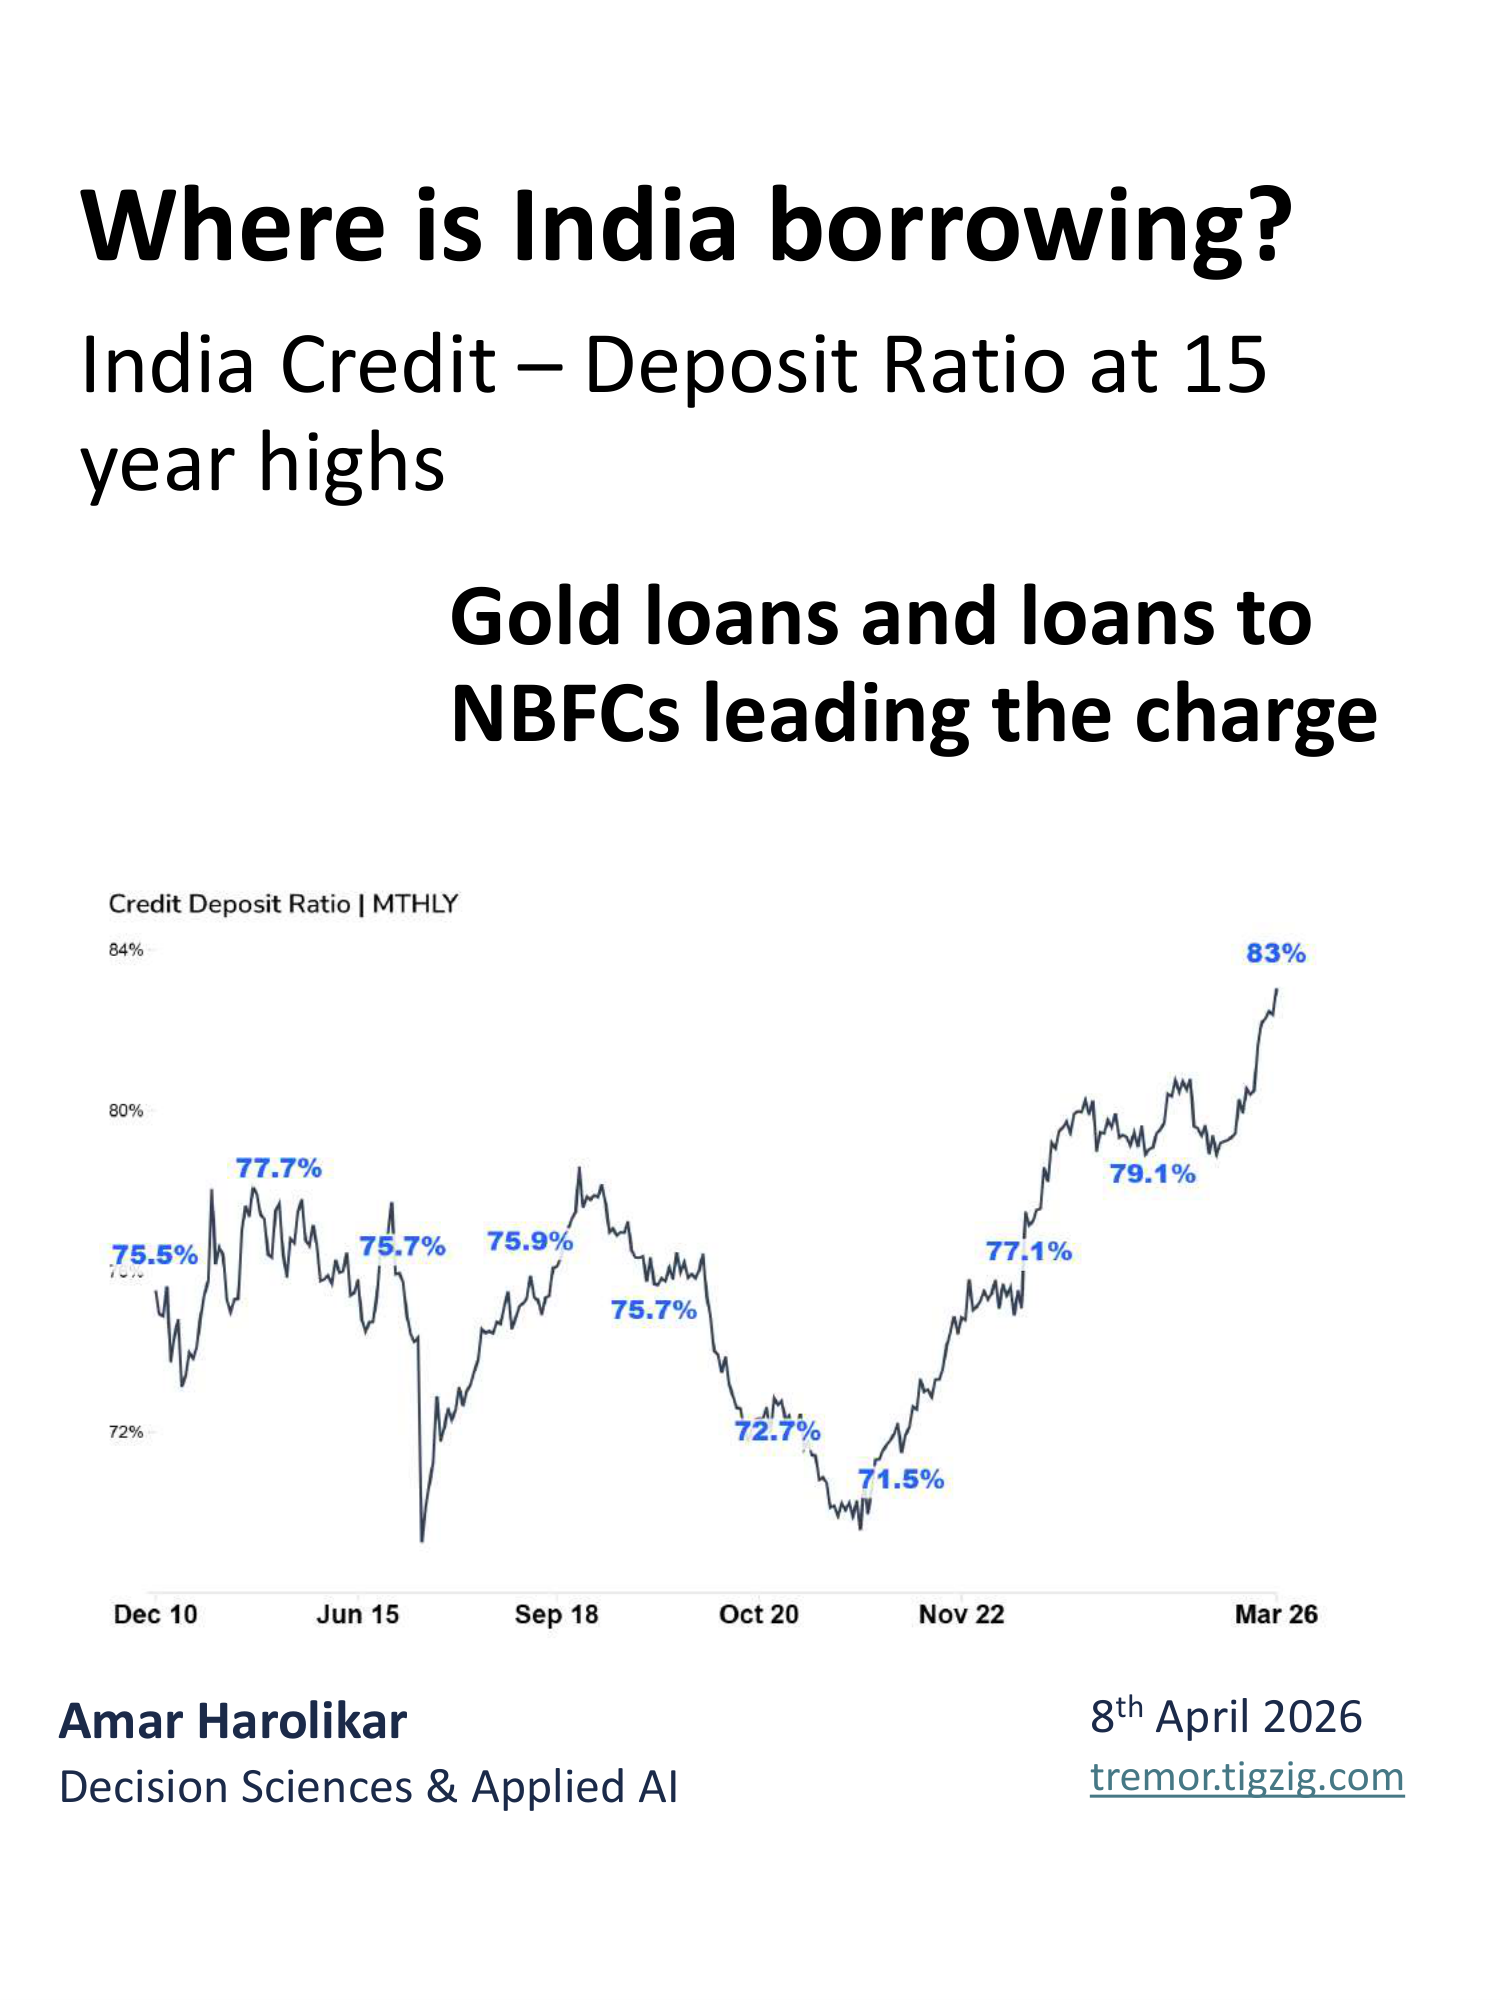
India's Credit-Deposit Ratio Just Hit 83%. A 15-Year High. Gold Loans Up 4x in Two Years.
India credit-deposit ratio at 83%, 15-year high. Gold loans up 4x in two years. NBFC loans up 21% in 9 months. Six sectors growing at 2x overall rate pulling one-third of new credit. Credit grew 12.3% vs deposits 9%. Housing growth slowed. RBI sectoral data analysis.
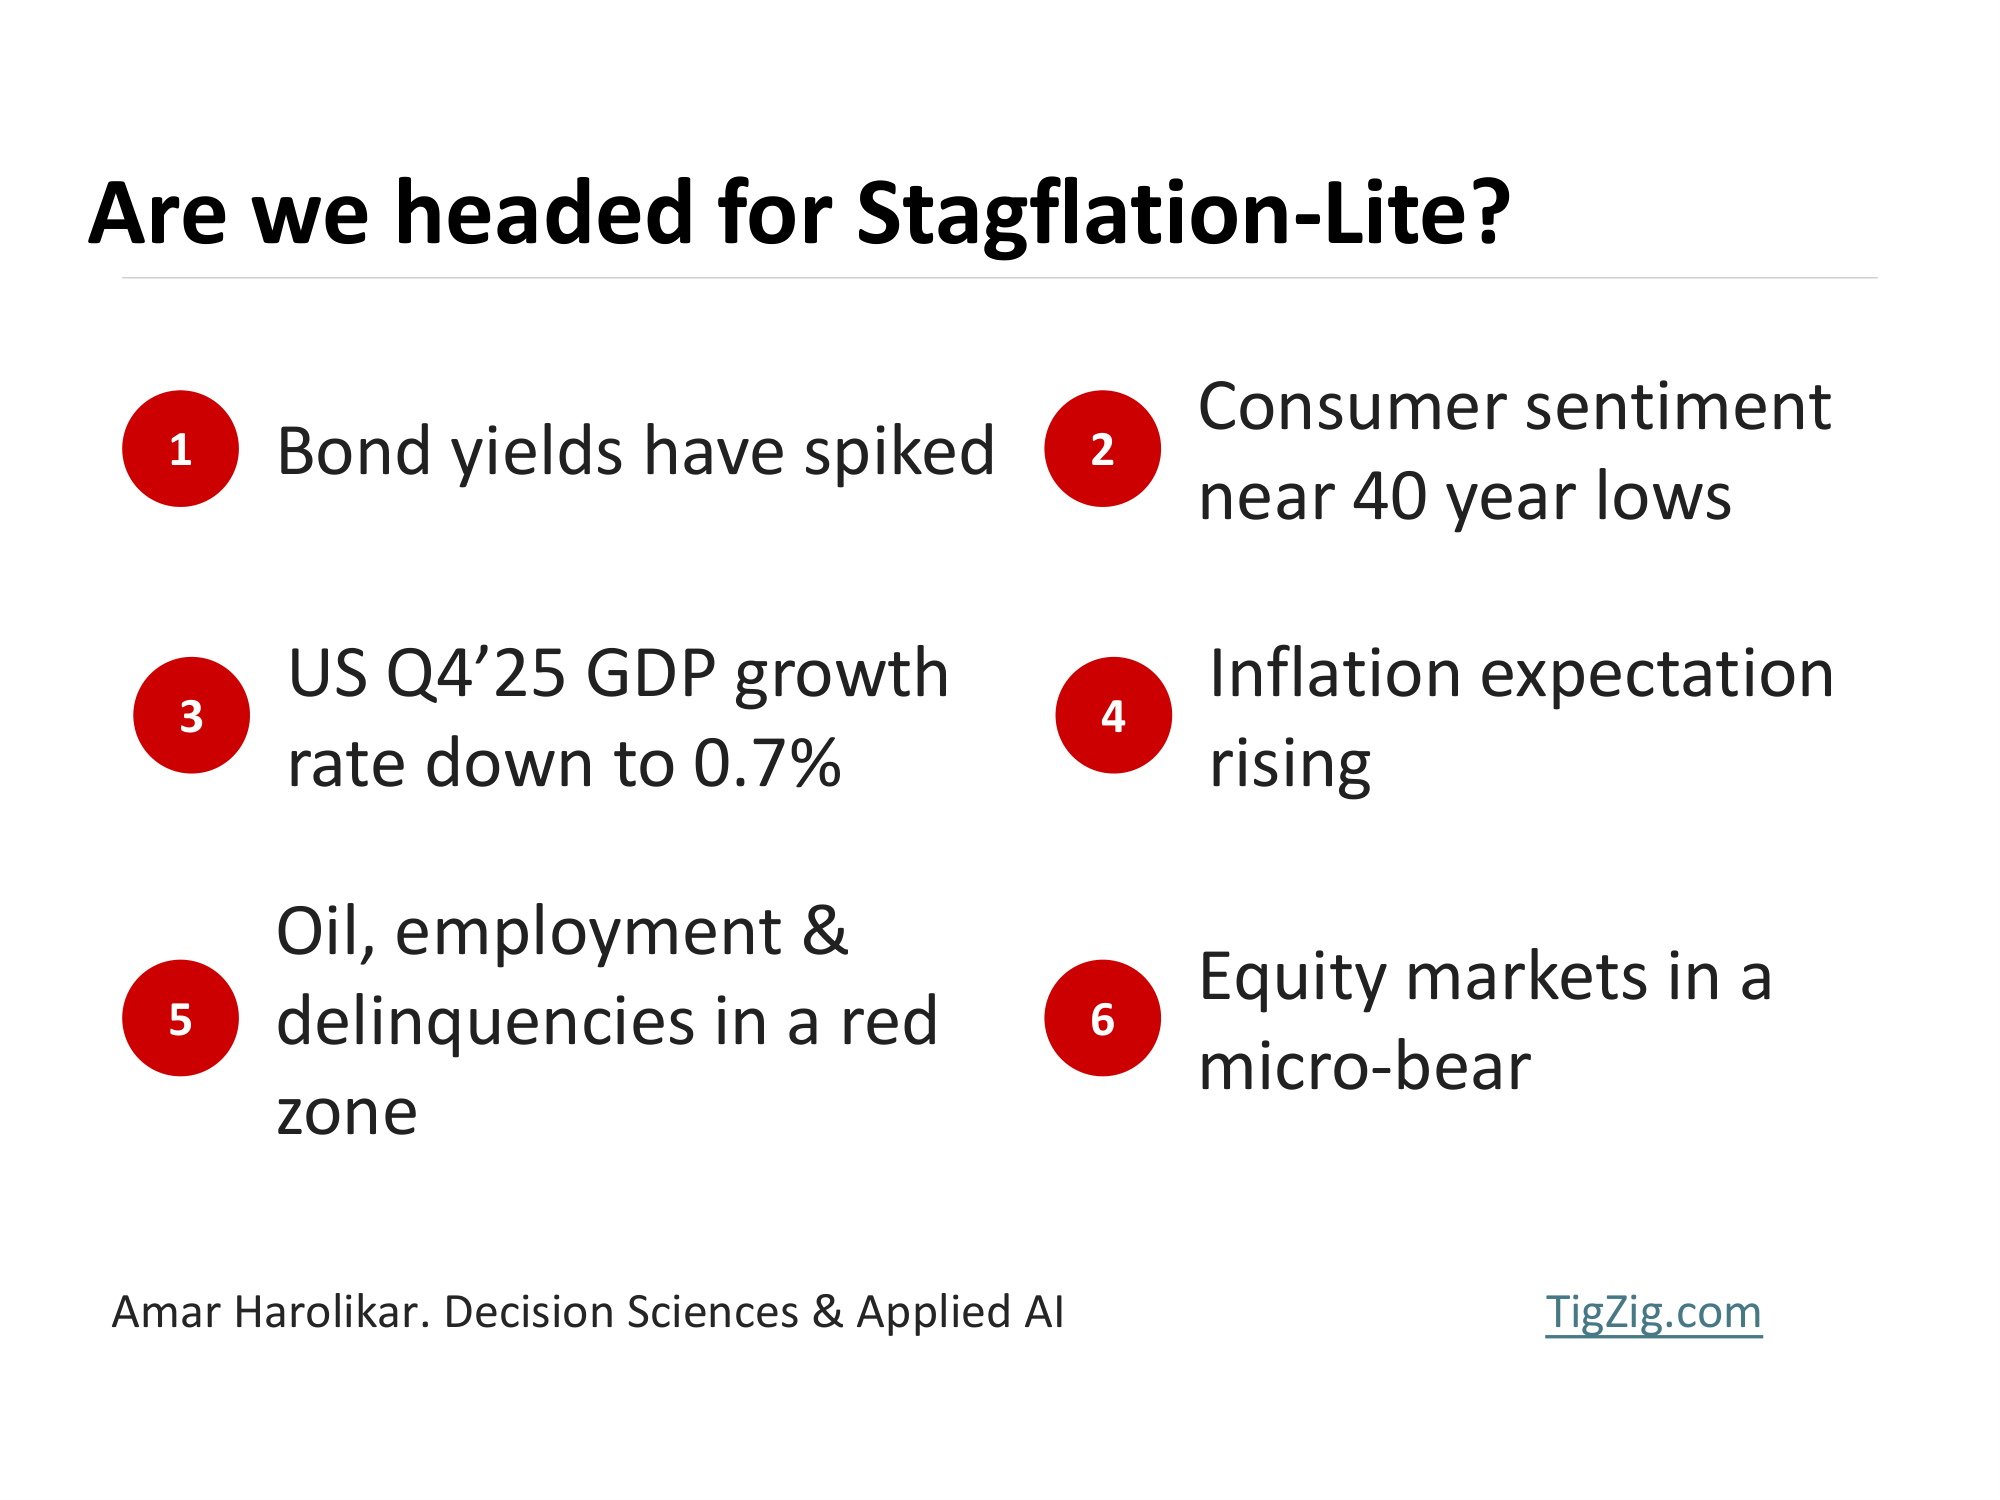
Are We Headed for Stagflation-Lite
Stagflation-Lite signals intensifying. Fed trapped between inflation and weak jobs. US 10Y at 4.4%, PPI at 3.4% with oil shock not yet in data, GDP at 0.7%, consumer sentiment 7th lowest in 40 years, Moody recession odds at 48.6%. Bond markets pricing in high inflation globally.
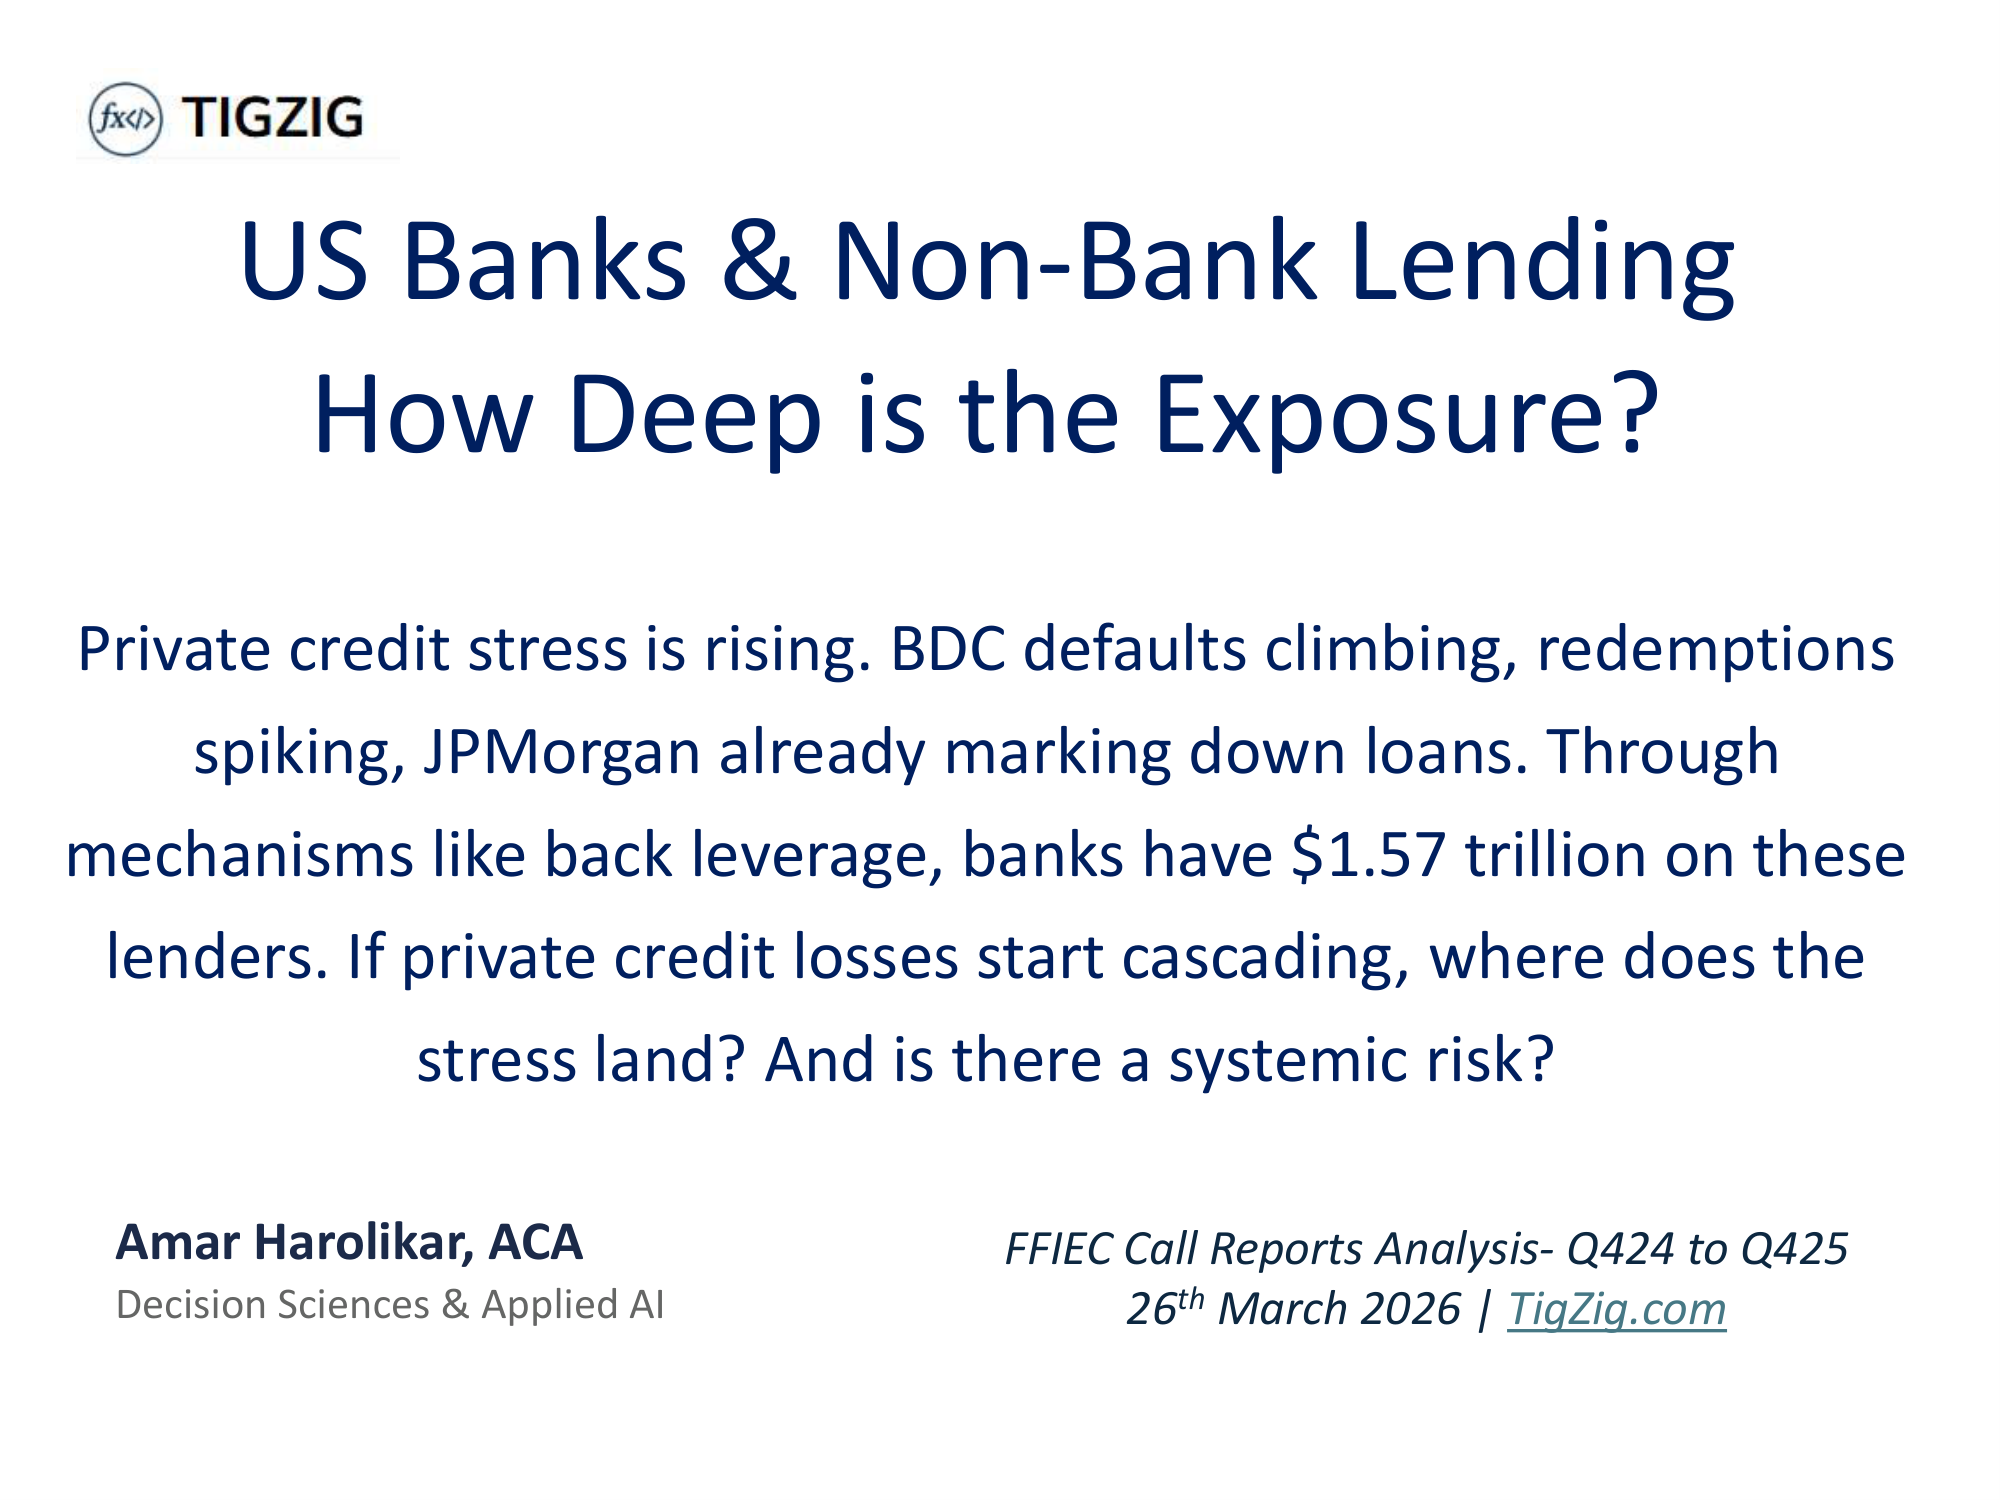
US Banks & Non-Bank Lending - How Deep is the Exposure? Is there a Systemic Risk?
US banks hold $1.57 trillion in loans to non-bank lenders facing redemptions and defaults. 41 banks have this single portfolio exceeding 100% of core capital. 62 banks have loan loss reserves covering less than 10% of exposure. Analysis from FFIEC Call Reports for 629 banks across 5 quarters, cross-validated against FDIC, FRED and S&P Global.
Private Credit - The $2.7 Trillion Shadow Lending Market Is Showing Cracks
Private credit showing cracks that remind Wall Street of 2008. Jamie Dimon and Lloyd Blankfein flagging risks. 40% of borrowers have negative cash flow. Blackstone scrambled to meet $3.8B in redemptions. Management companies down 30-50% in 6 months.
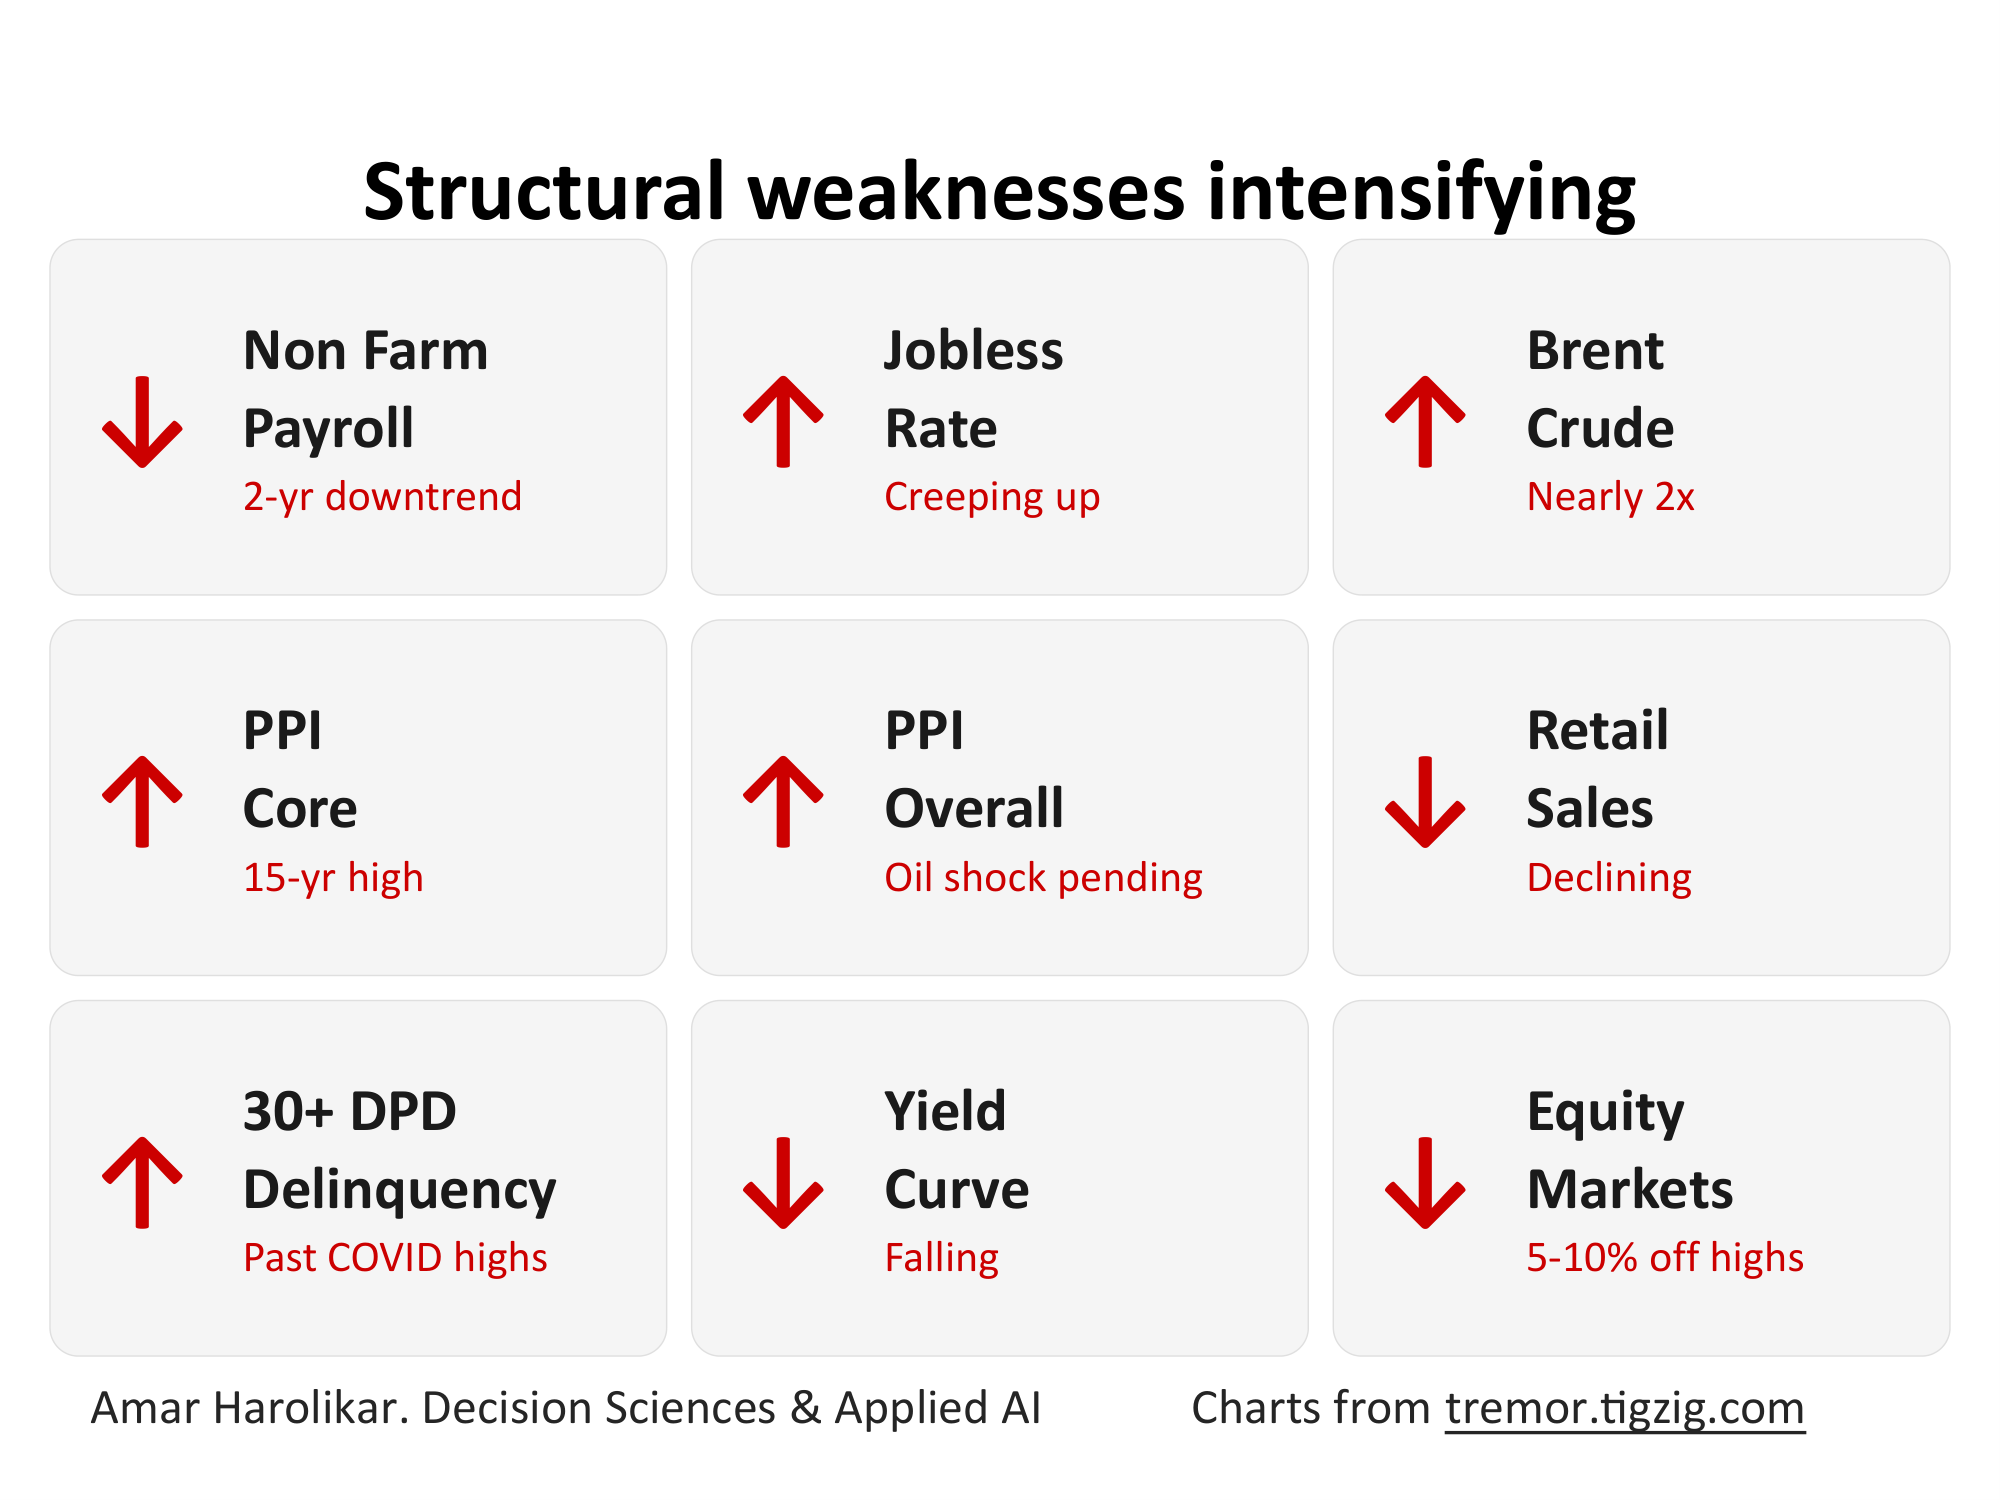
Structural Weakness Intensifying
3 major US macro data points in 3 days all pointing the same direction. Feb payrolls minus 92K against expectations of 59K rise. PPI Core at 3.87%. Fed held at 3.5-3.75%. Brent crude nearly doubled in 3 months. Delinquencies past COVID highs. Multiple macro signals flashing stress simultaneously.
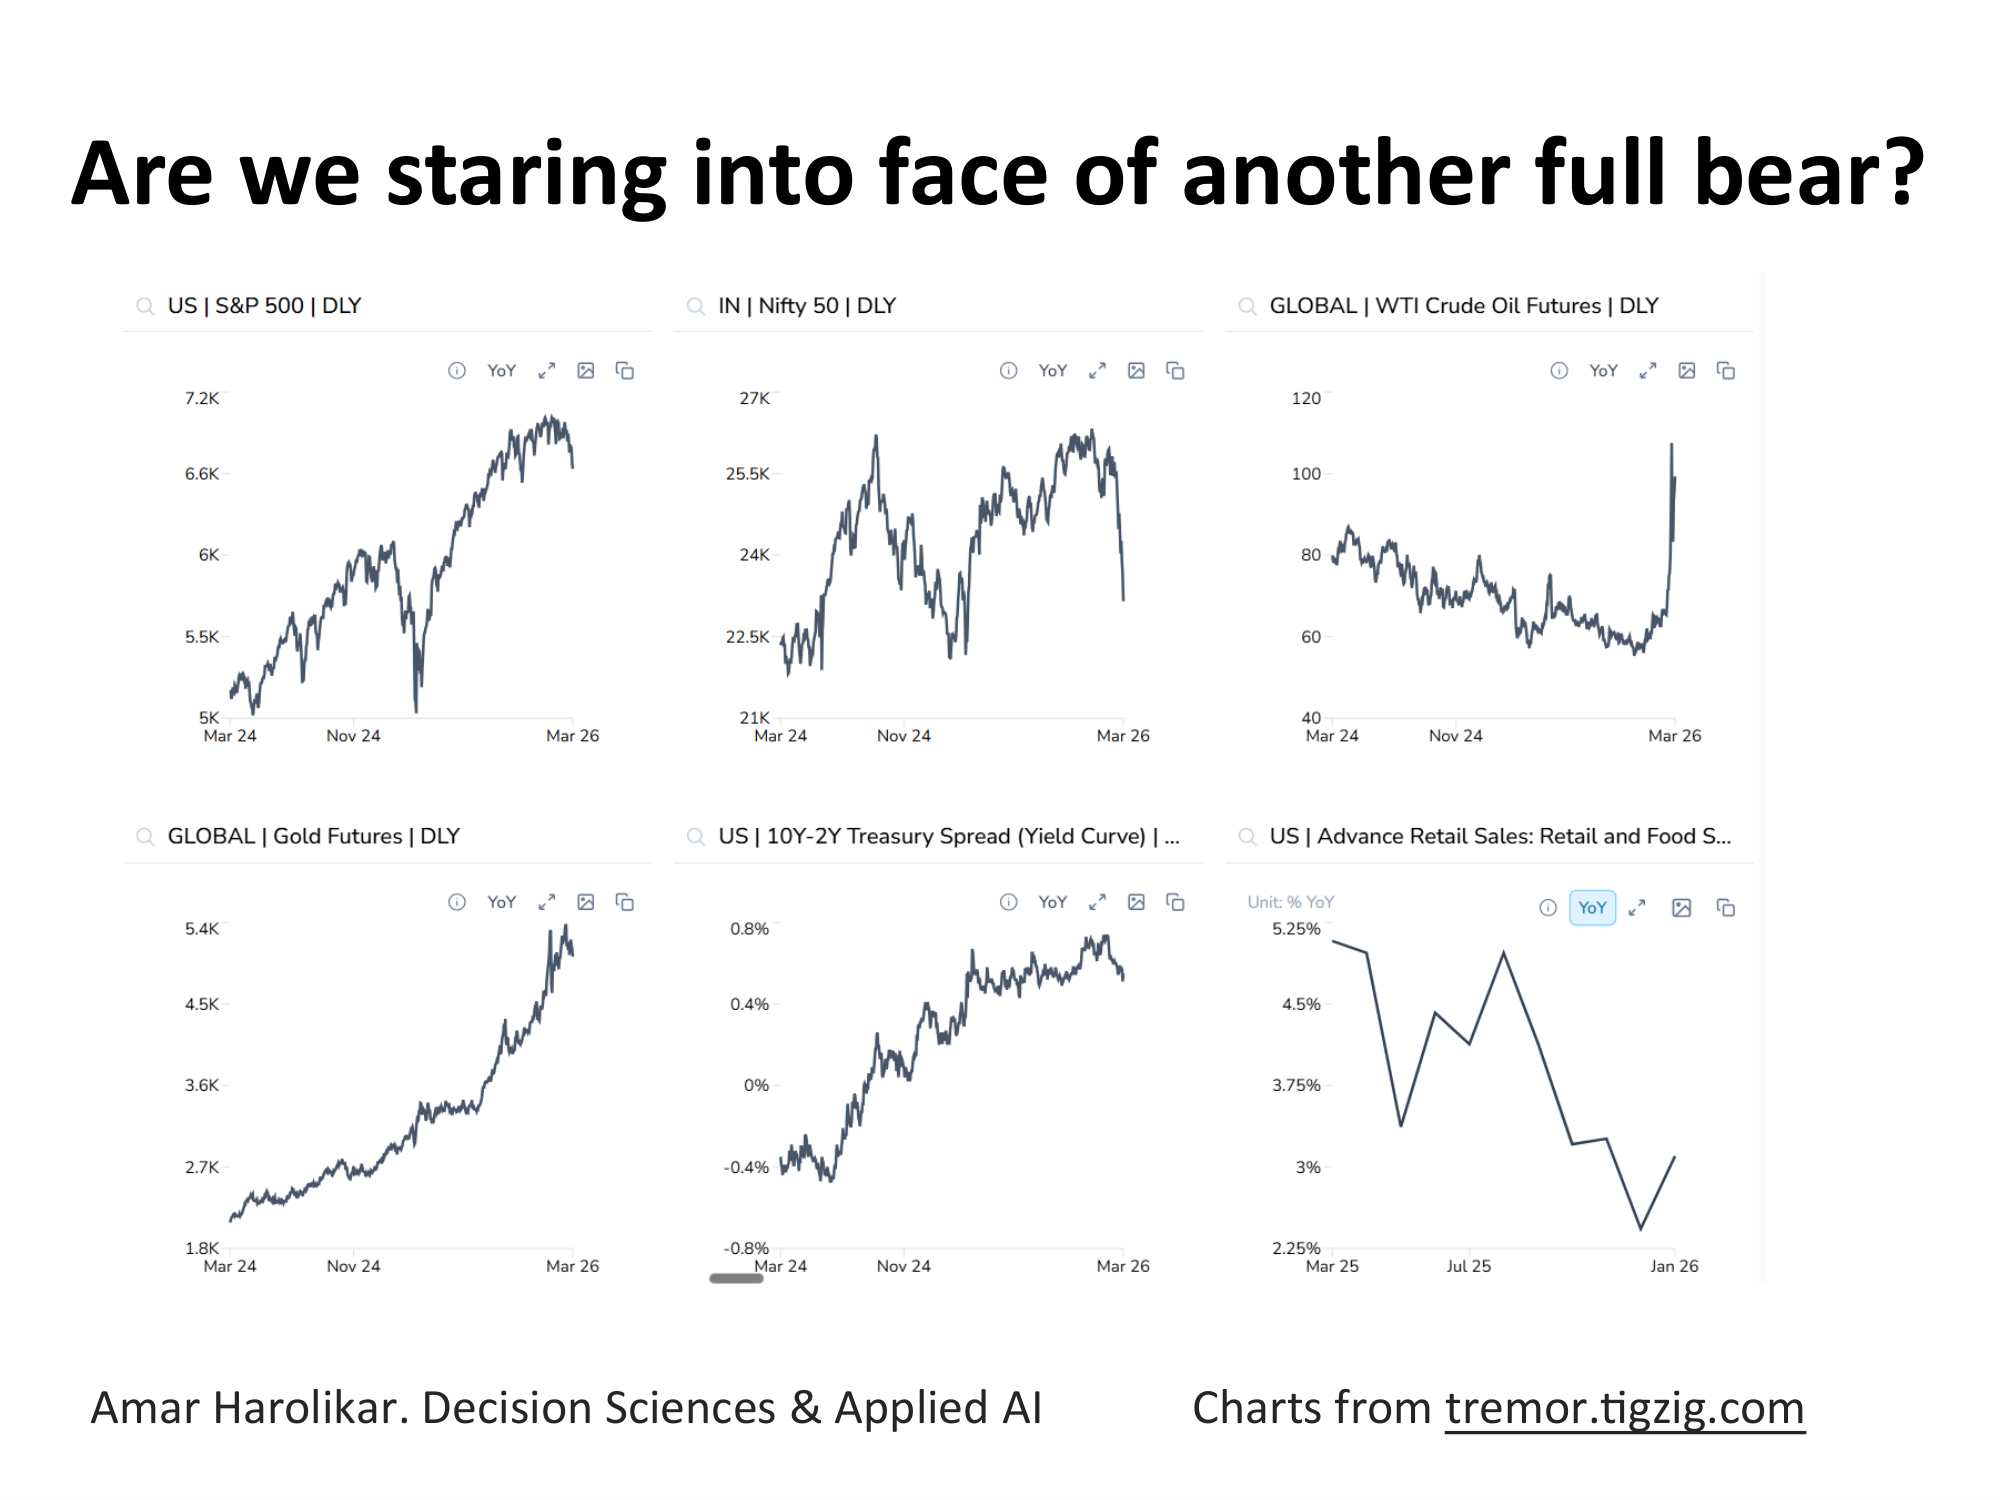
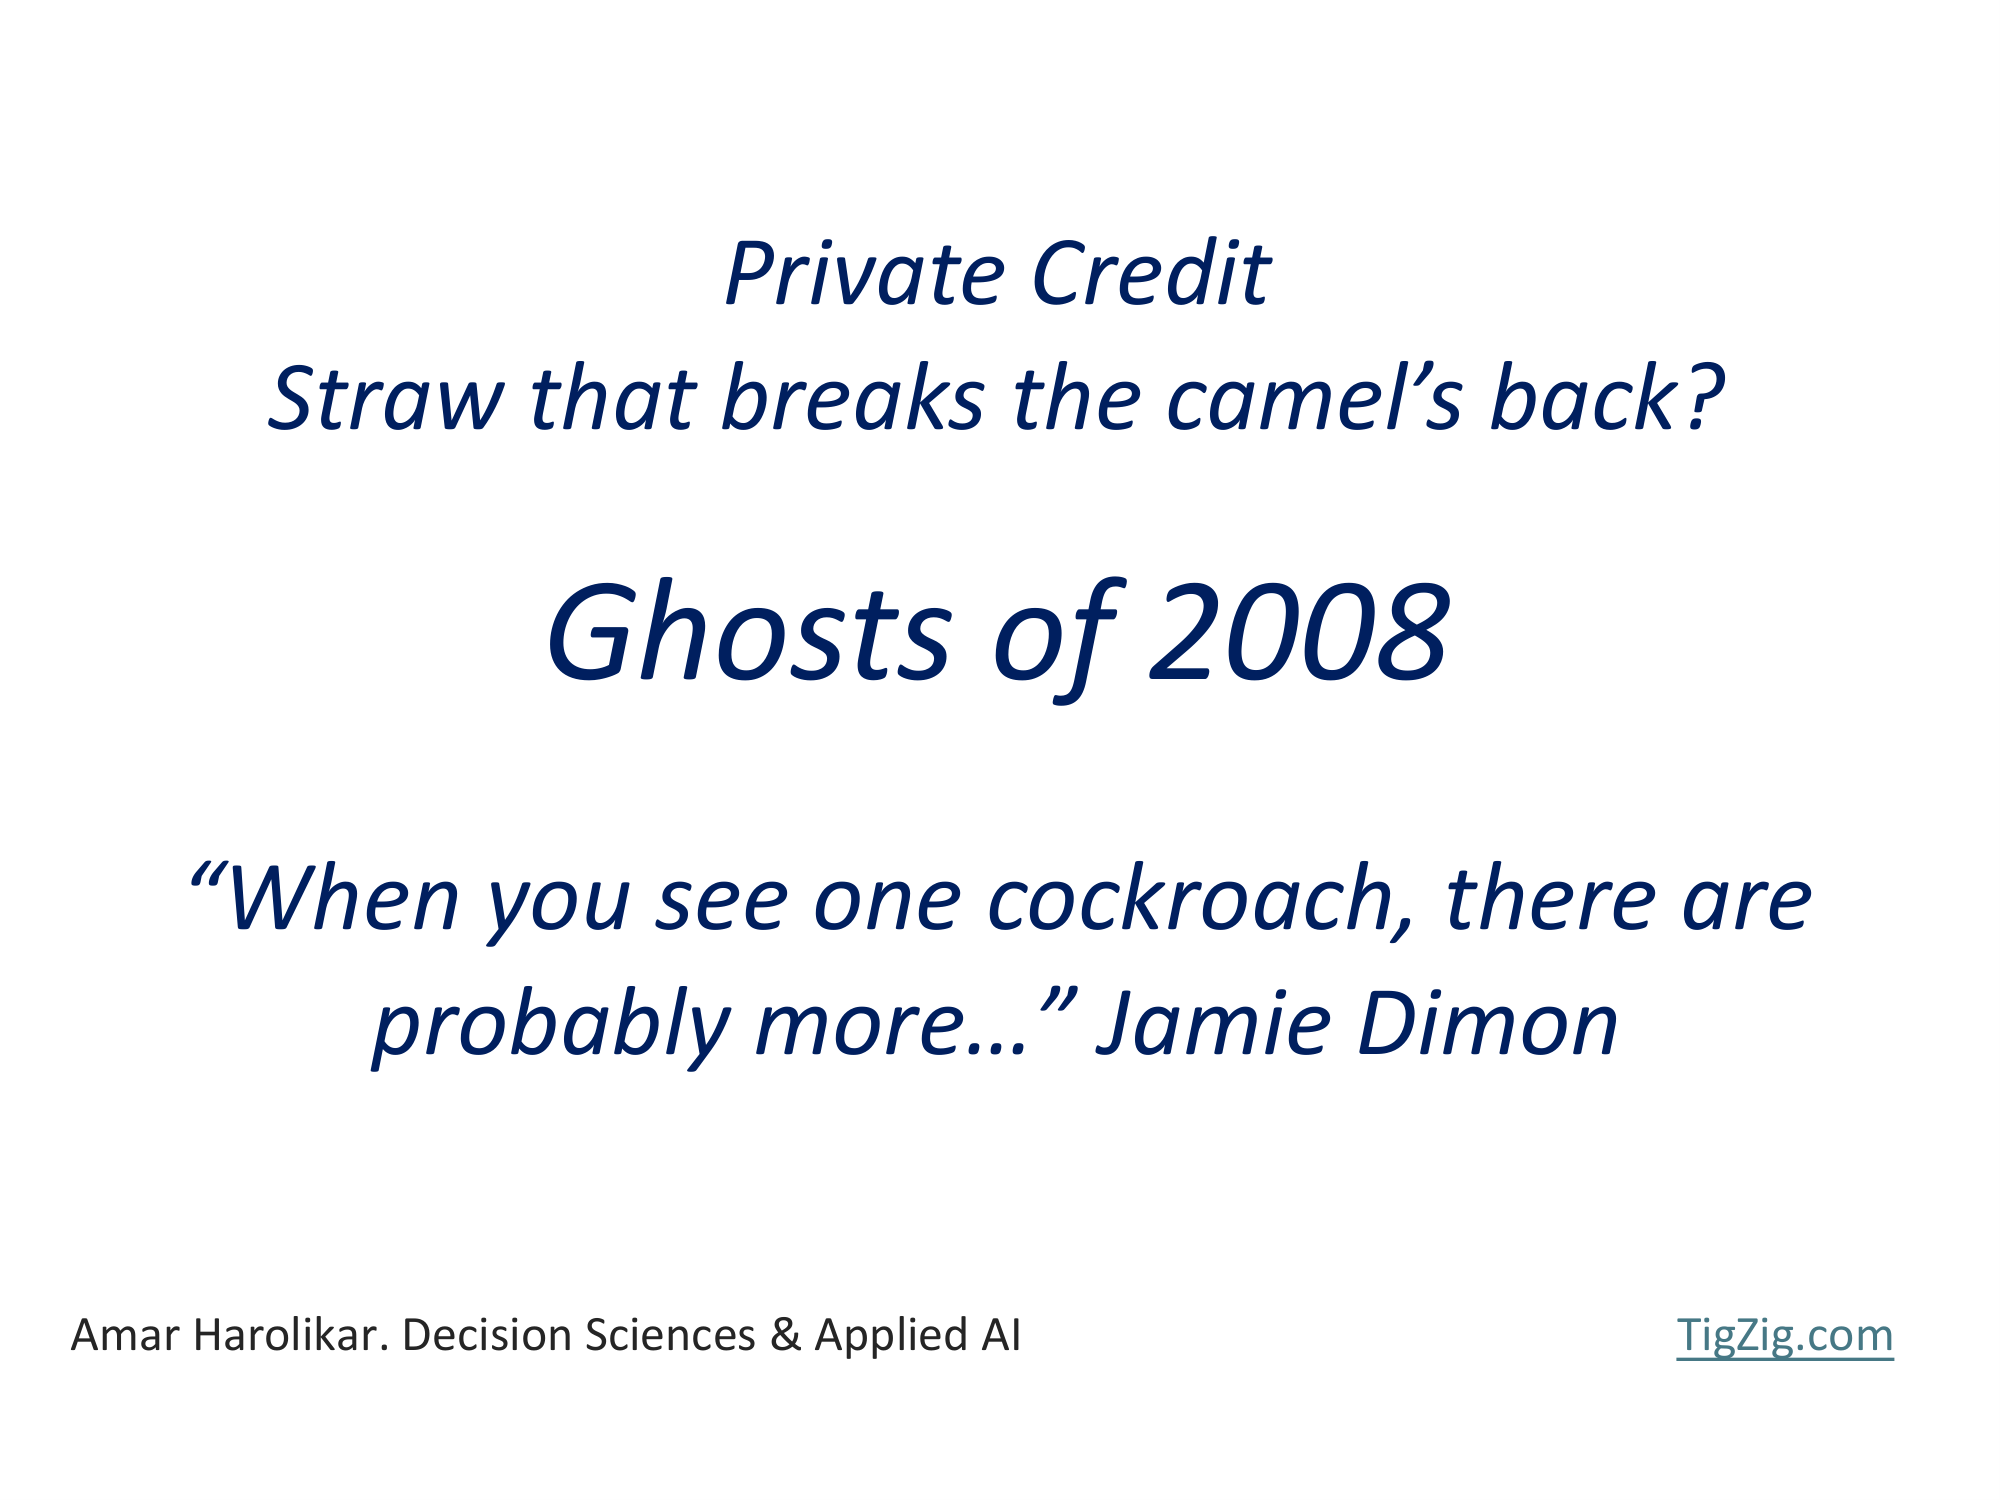
Tremor - Macro Early Warning Signals - March 2026
S&P down 5%, Nifty in bear territory down 12% from highs. CAPE at 40-year highs, gold going vertical, crude shooting towards 2008 levels, US delinquencies crossing COVID highs. When macro signals move together - tremors before a quake. 12 chart slides from tremor.tigzig.com.
Tool & Data Releases
16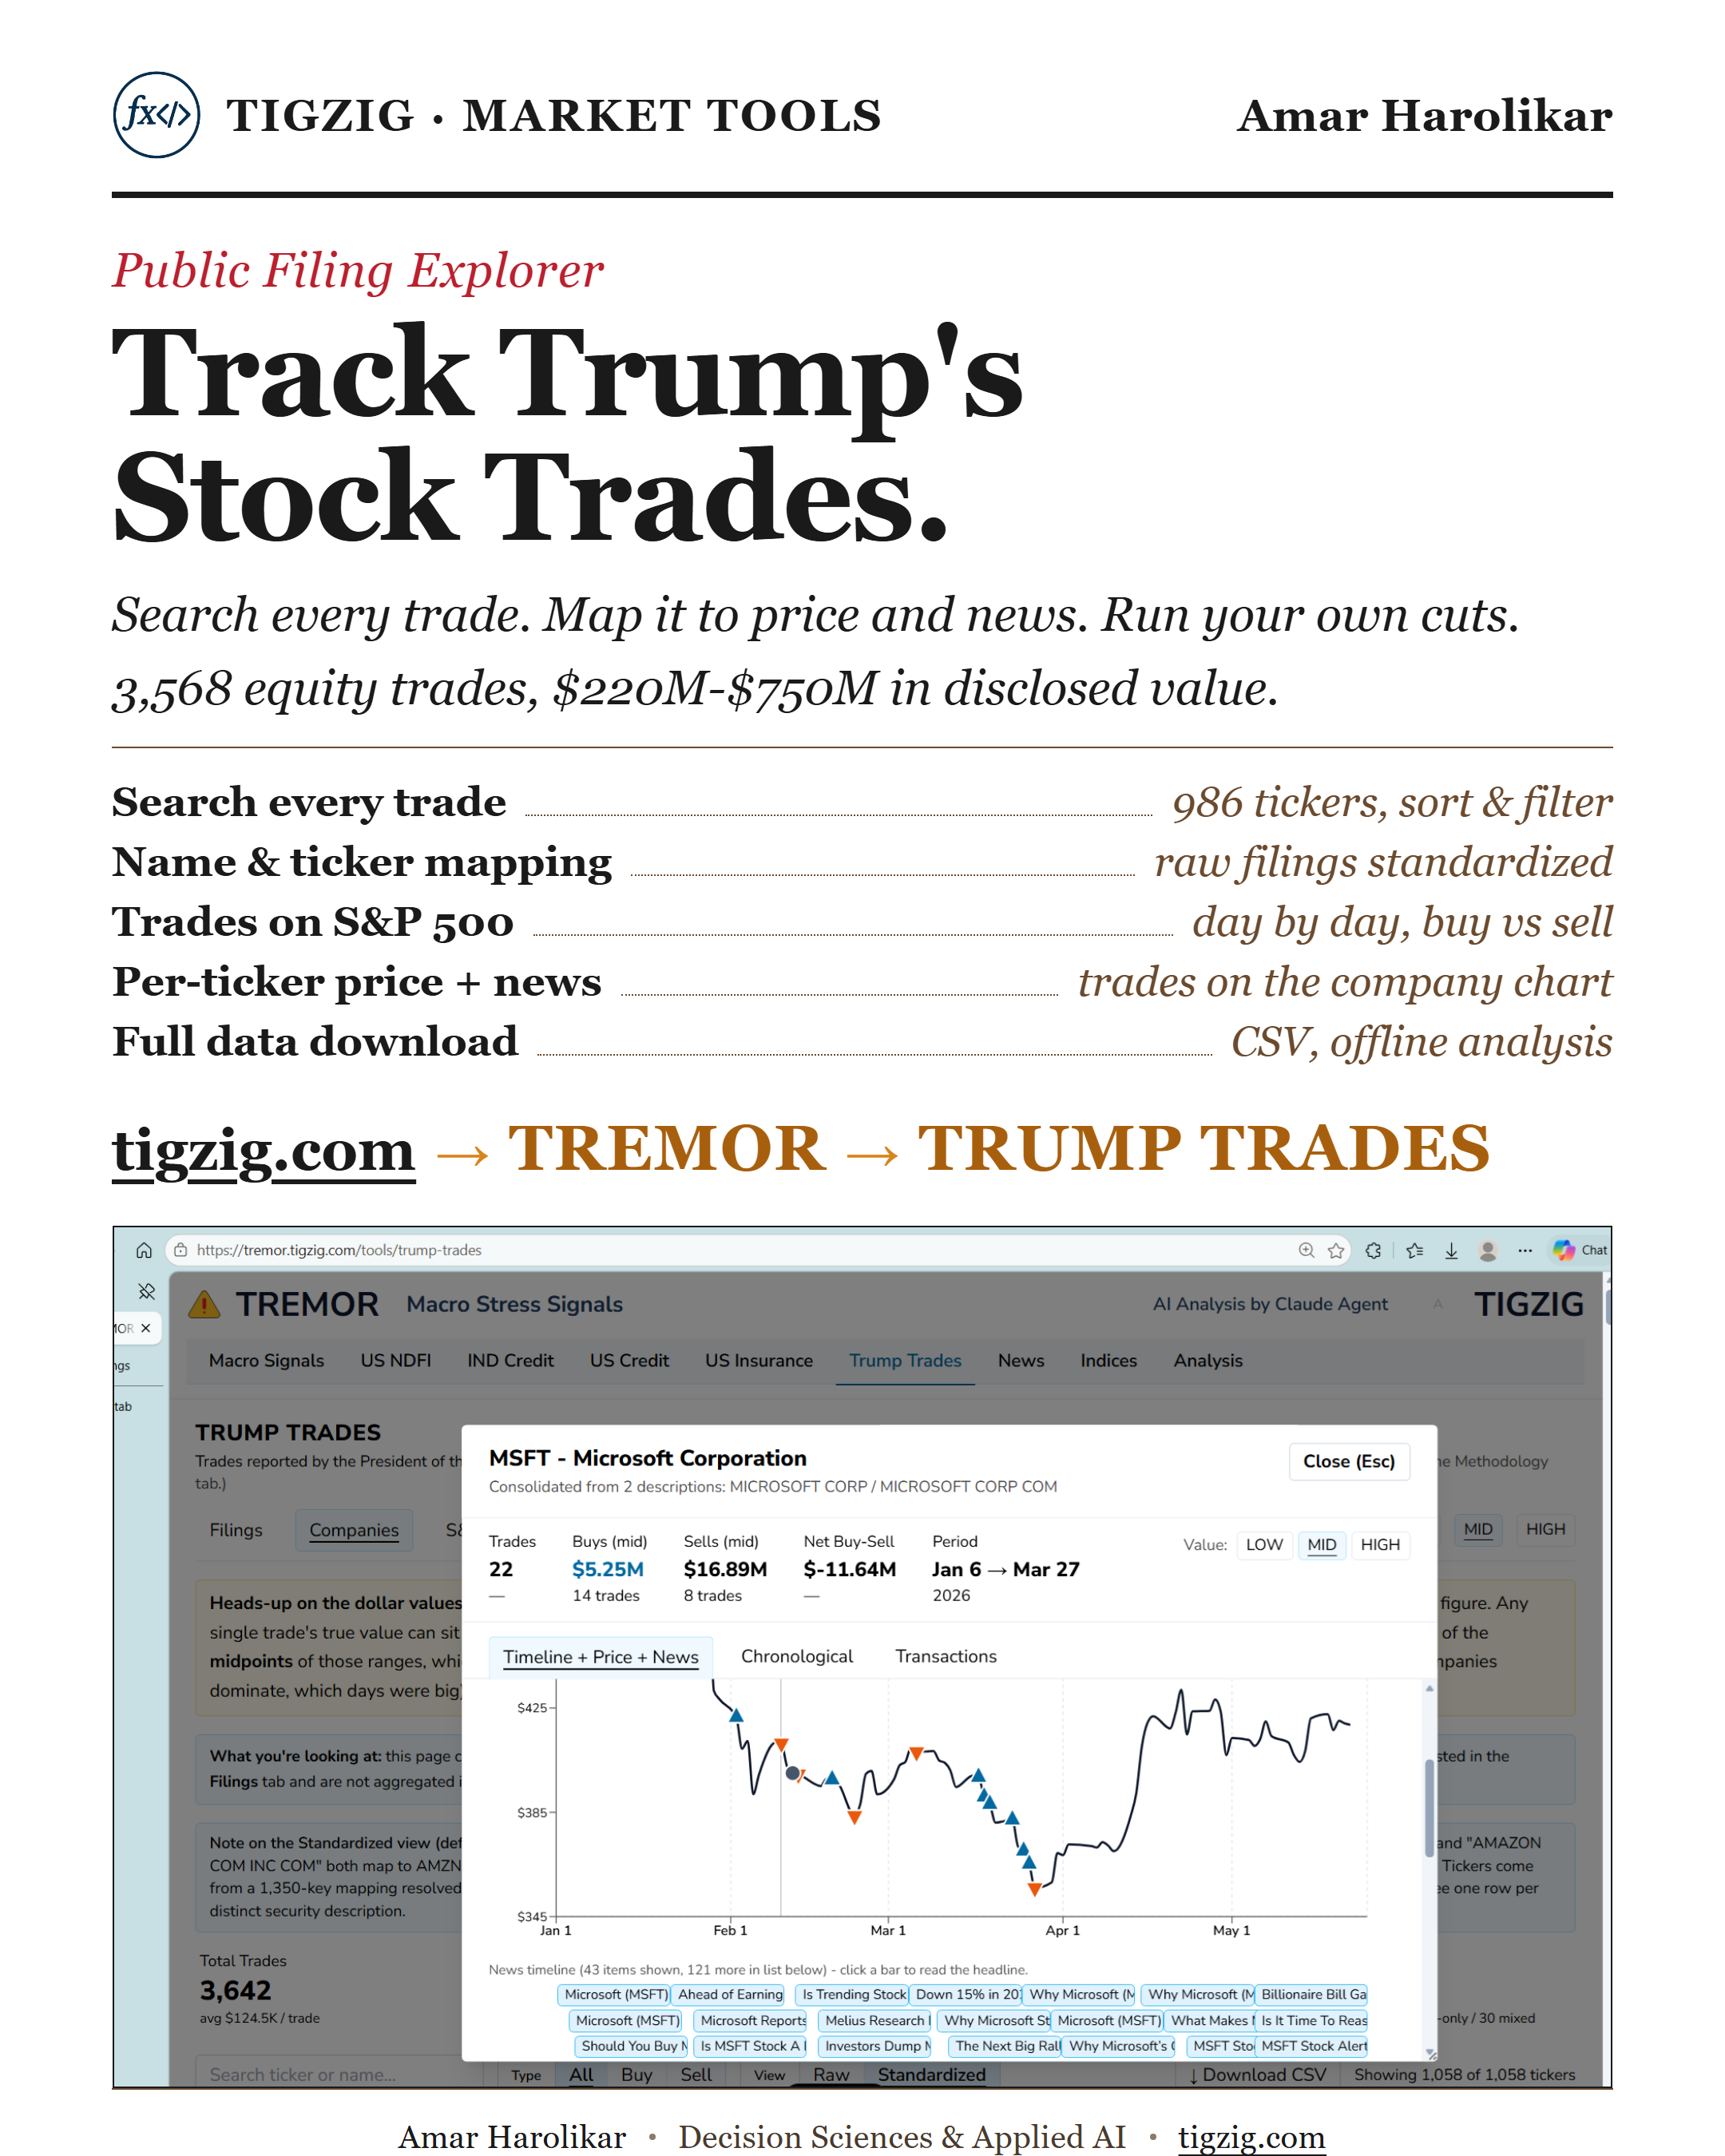
Track Trump's Stock Trades. Public Filing Explorer. 3,568 Trades, 986 Tickers, $220M-$750M. Searchable on TREMOR.
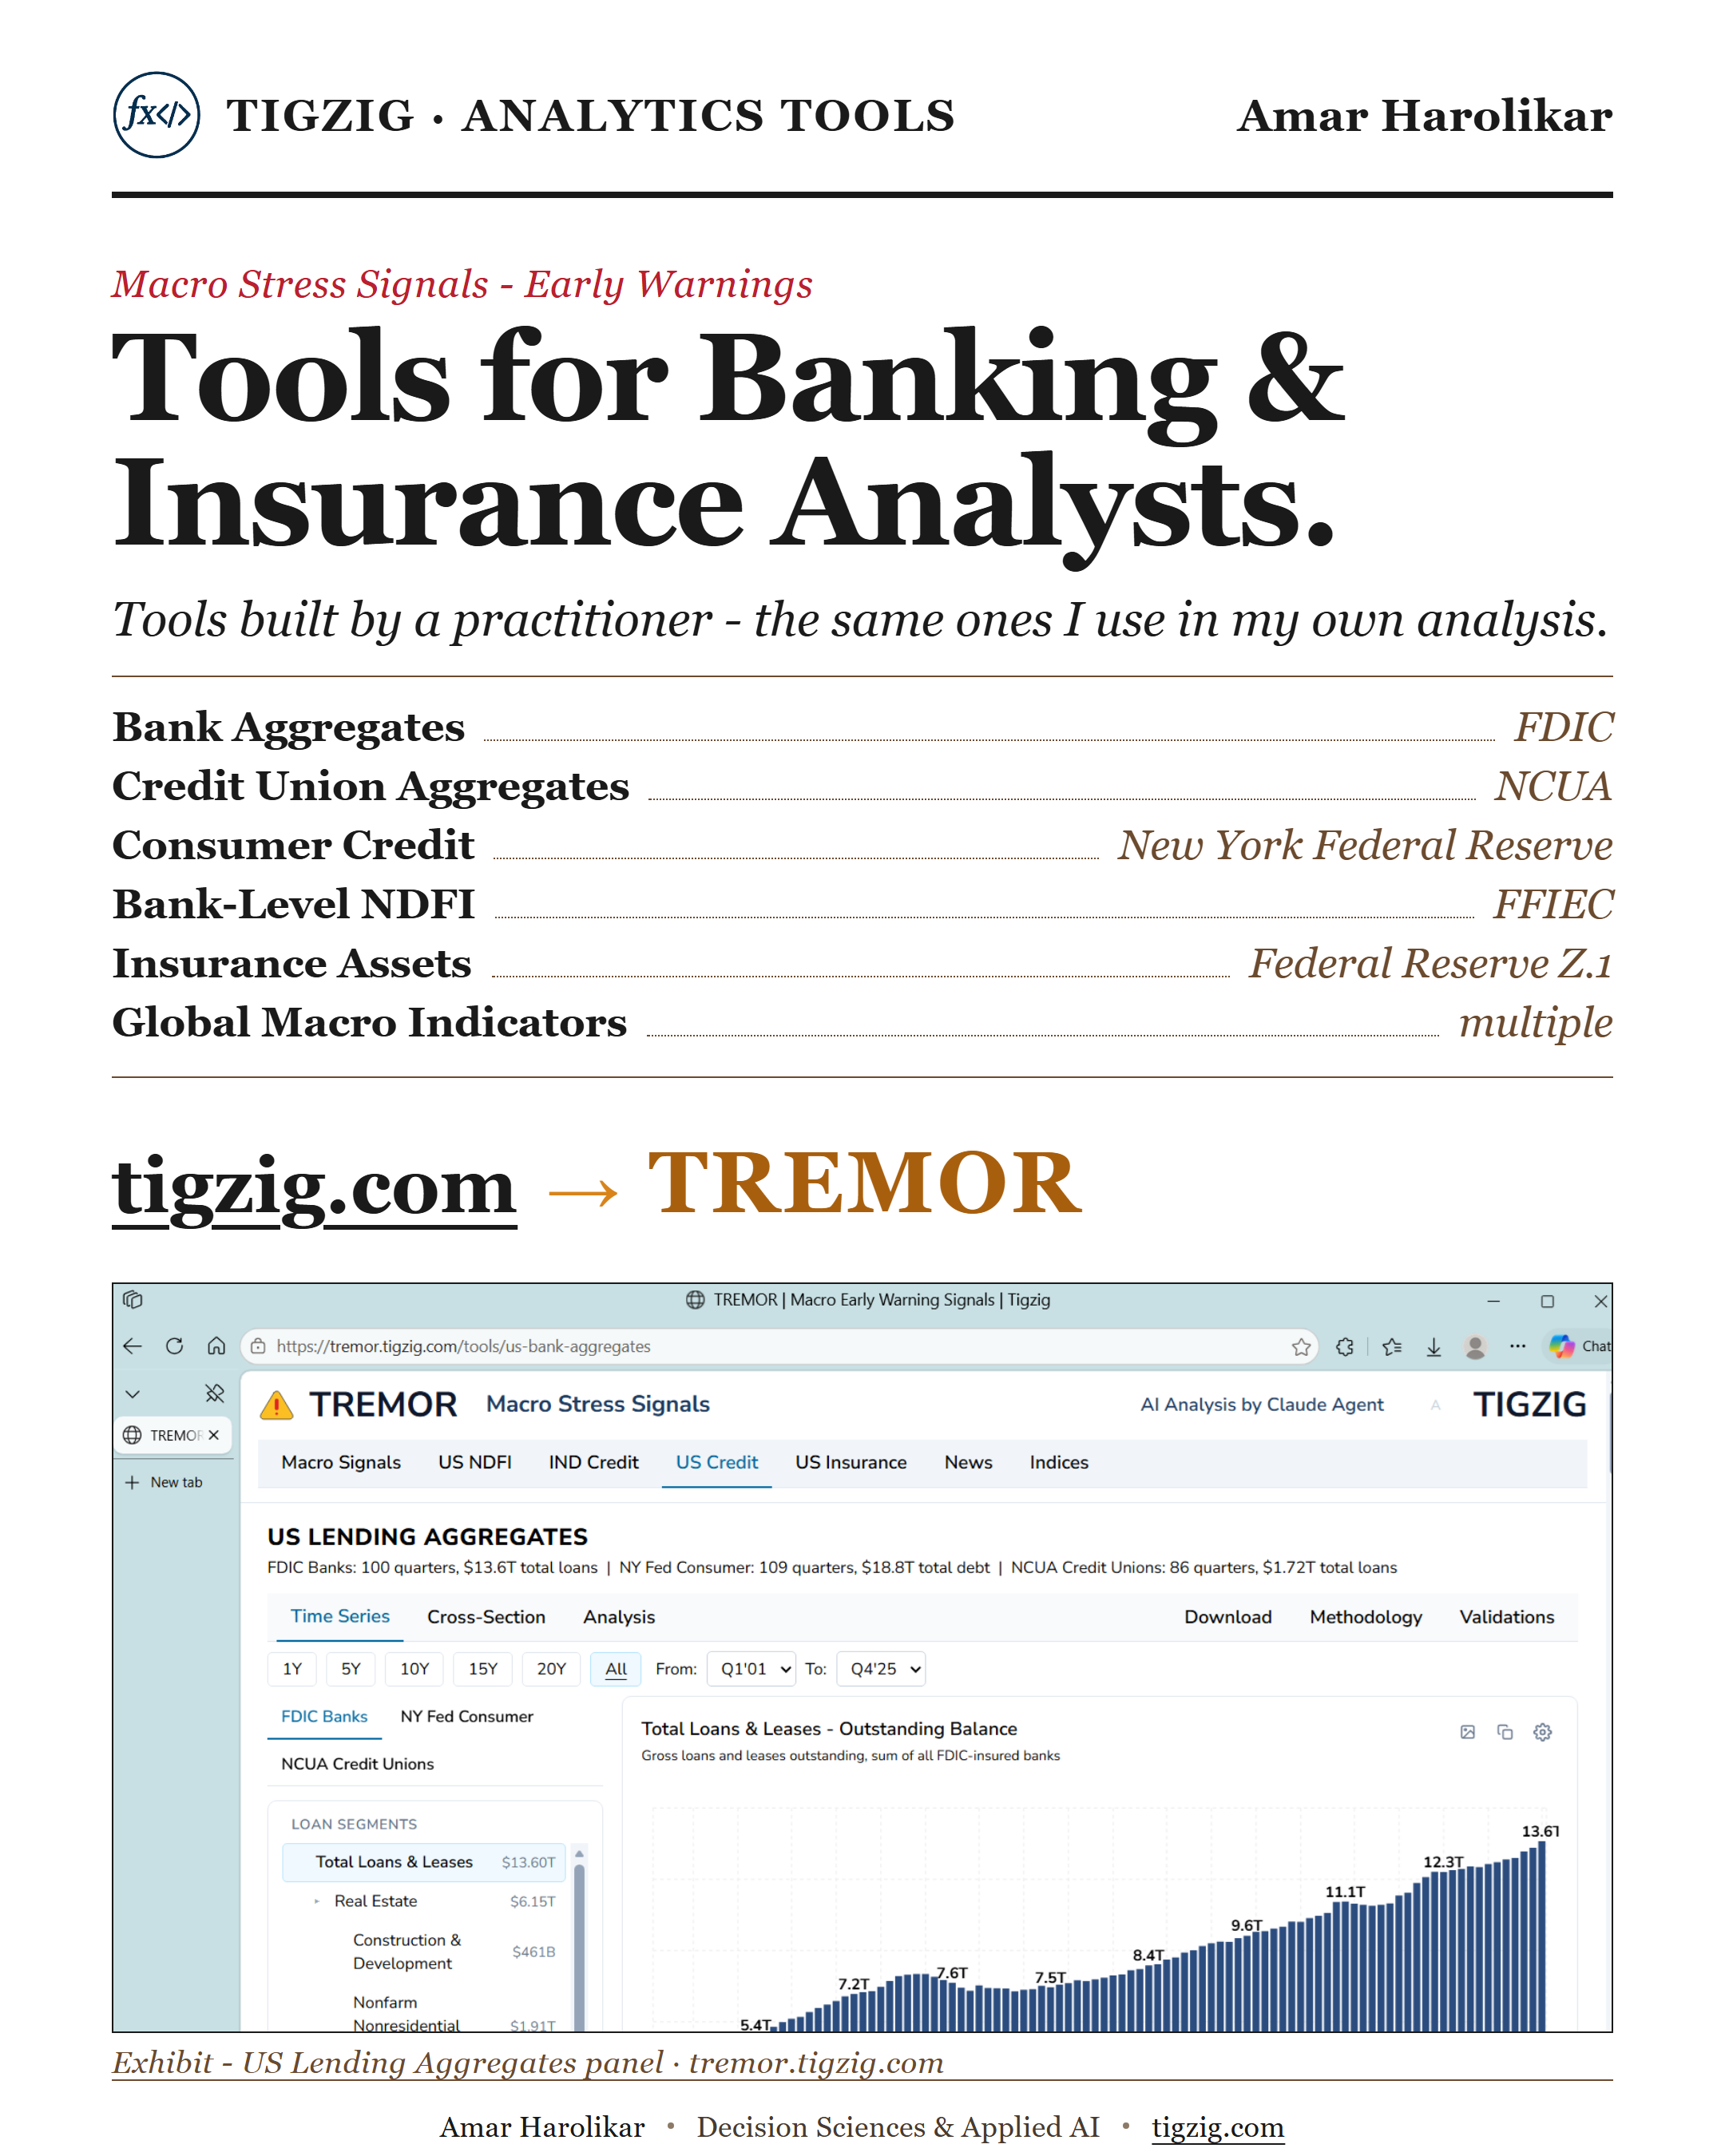
TREMOR. Six Free Tools for Banking and Insurance Analysts. Multi-Layer Validated. Built by a Practitioner.
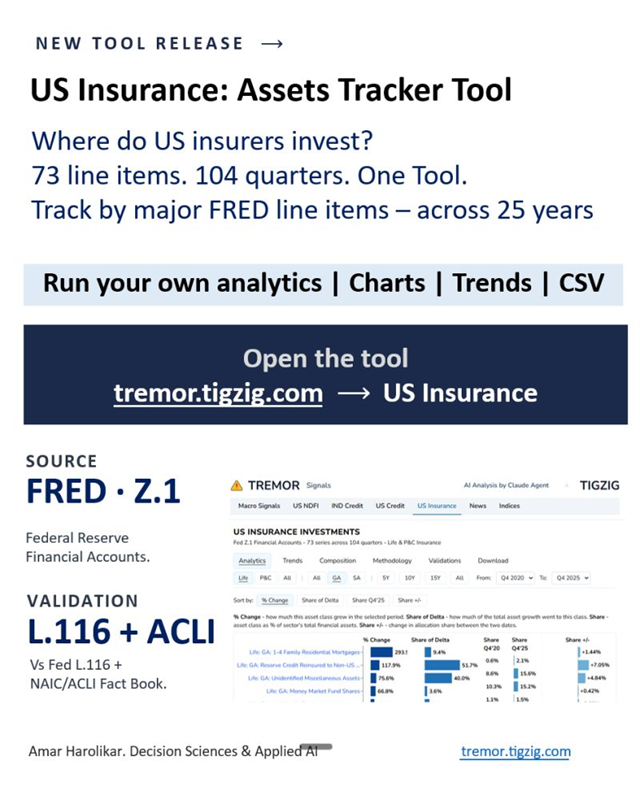
US Insurance Assets Tracker - 25 Years of Data, 73 Series, Life & P&C
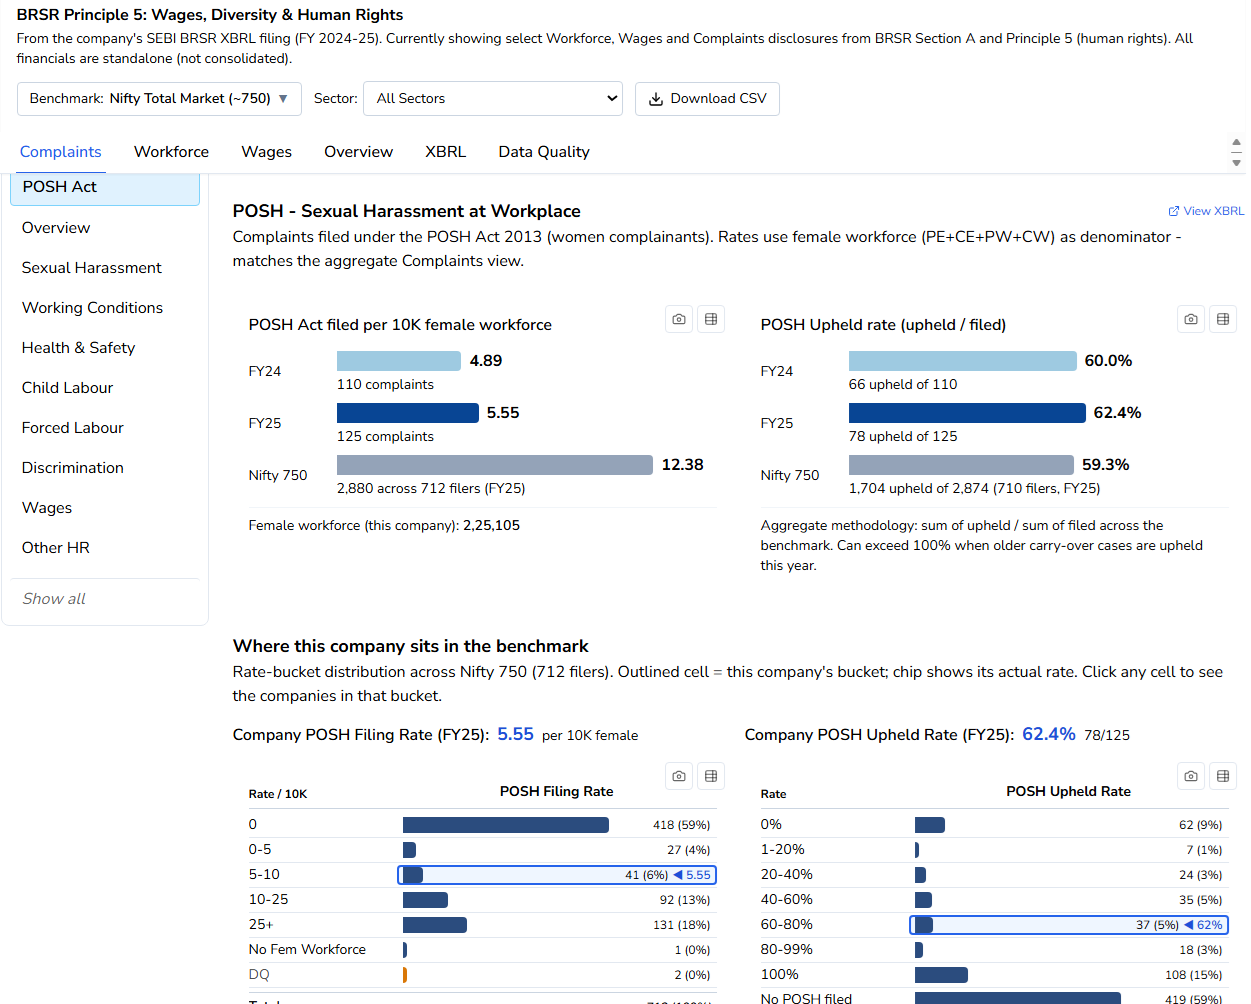
Releasing BRSR Analytics Tool. For Tracking Indian Corporate ESG, Workforce, Wages, Complaints.
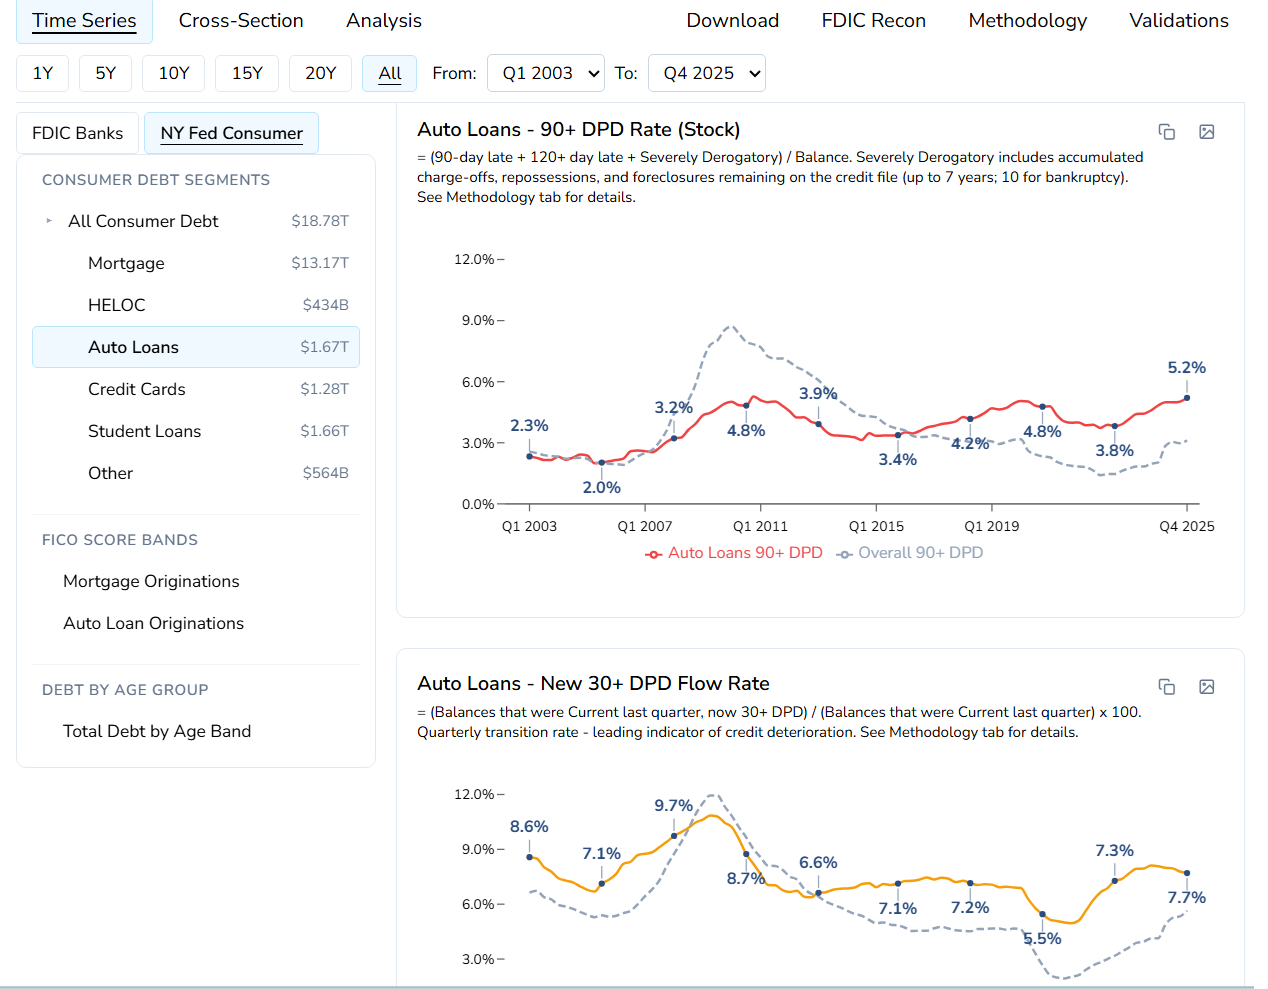
Releasing US-CREDIT. For Analysts Tracking US Banking. Interactive Tool Covering FDIC SDI and NY Fed CCP.
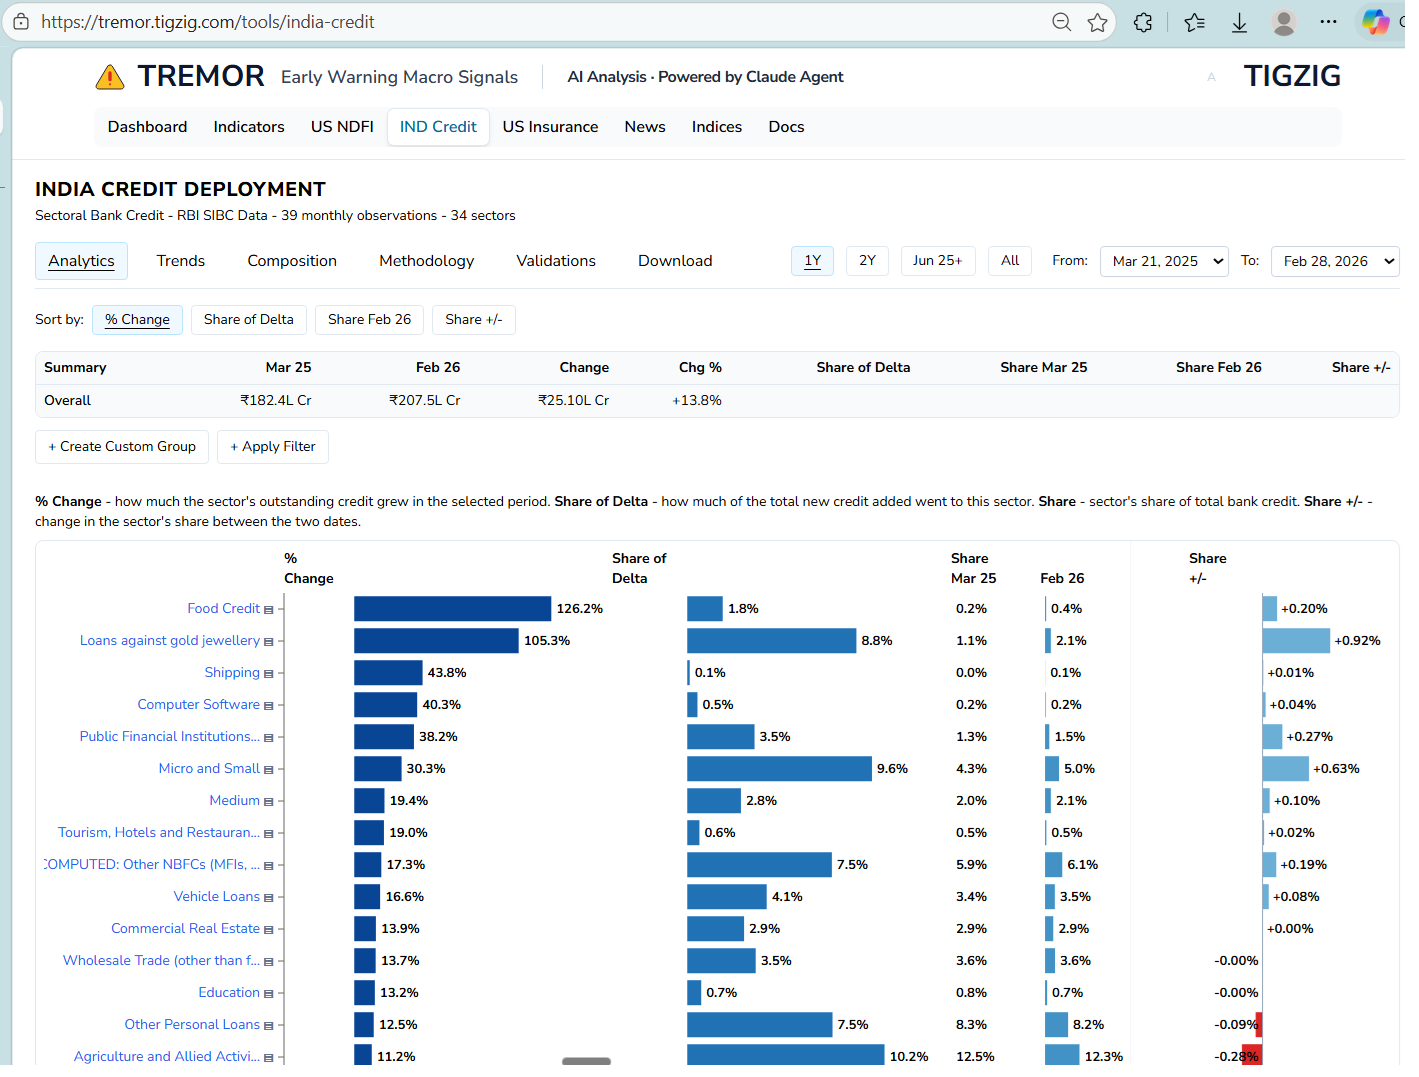
Analytics Tool for India's Bank Credit
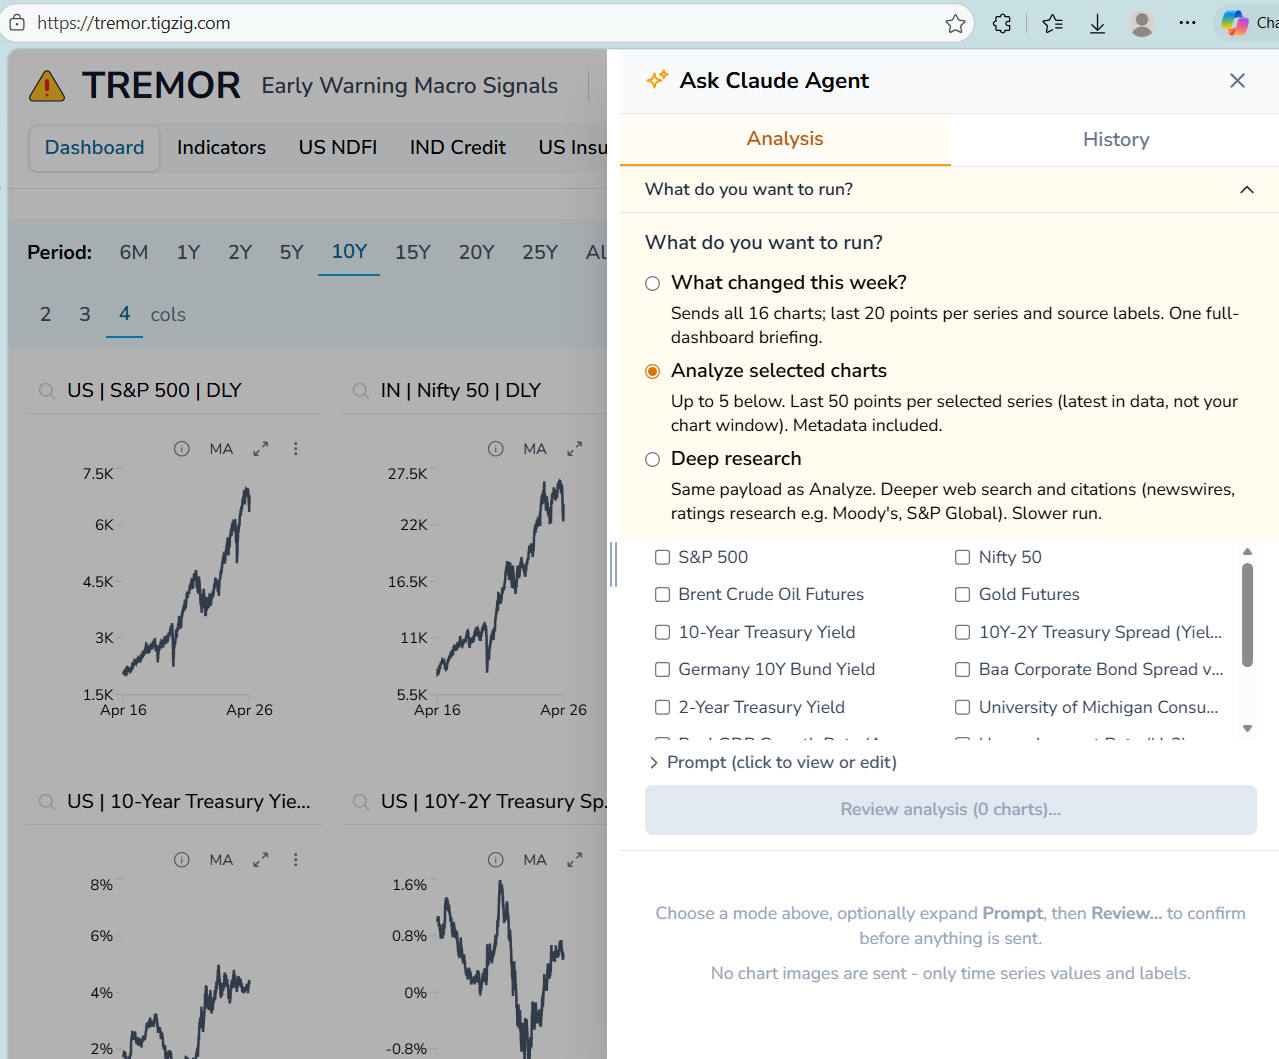
Anthropic Released Claude Managed Agents Yesterday, Live on TREMOR Today
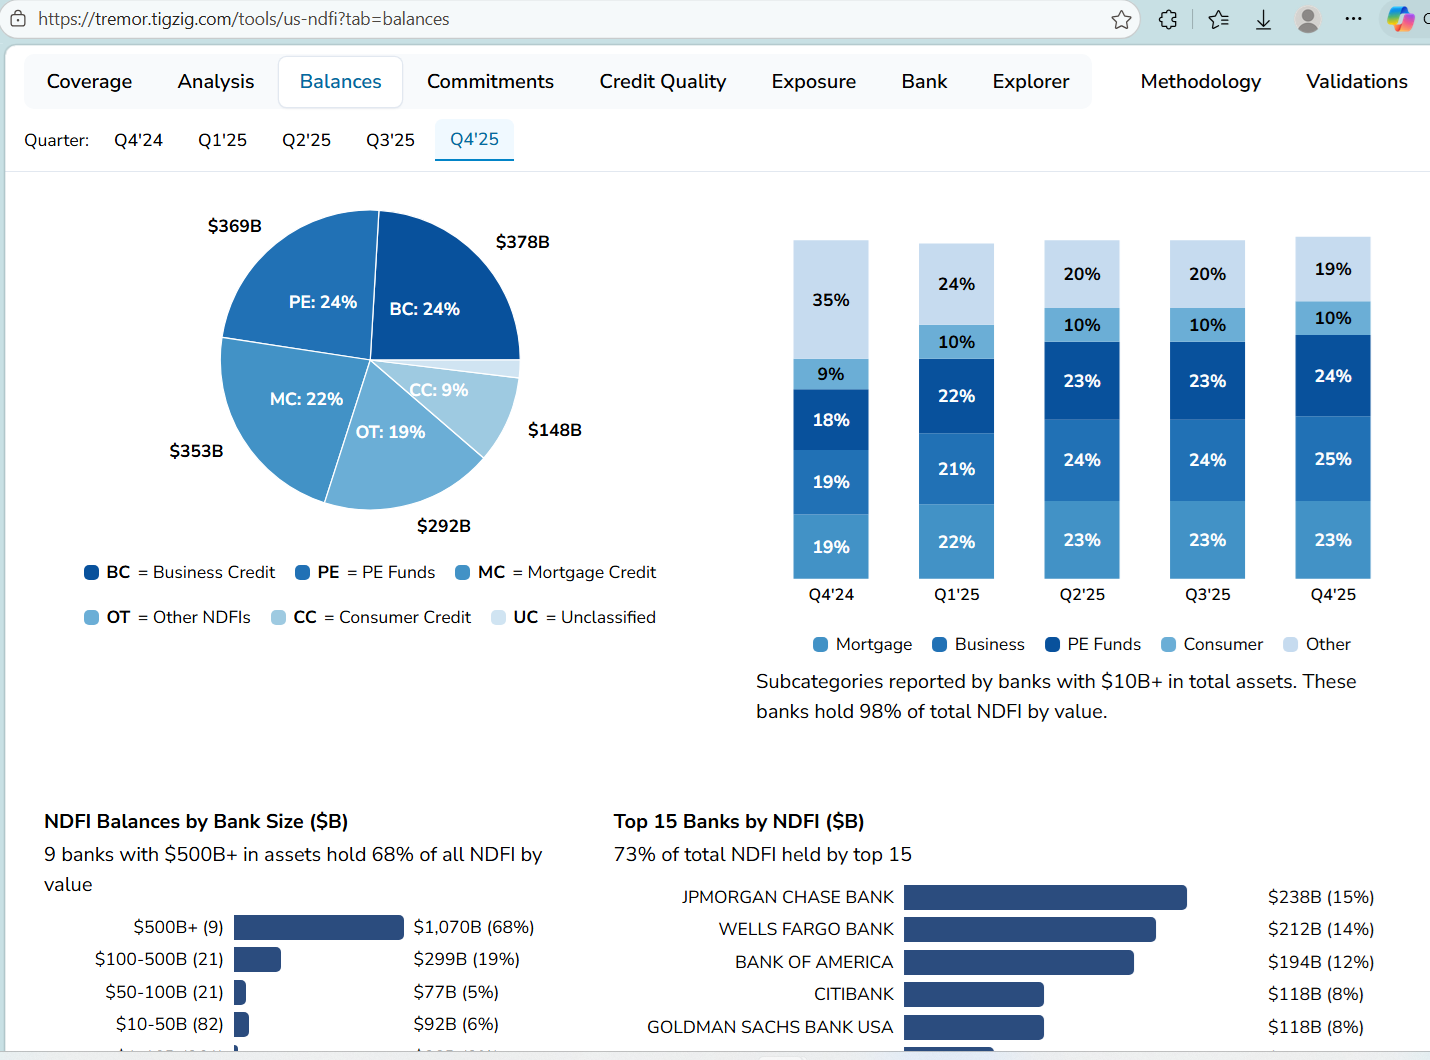
US Bank Exposure to Non-Bank Lenders - Now in an Interactive Analytics Tool
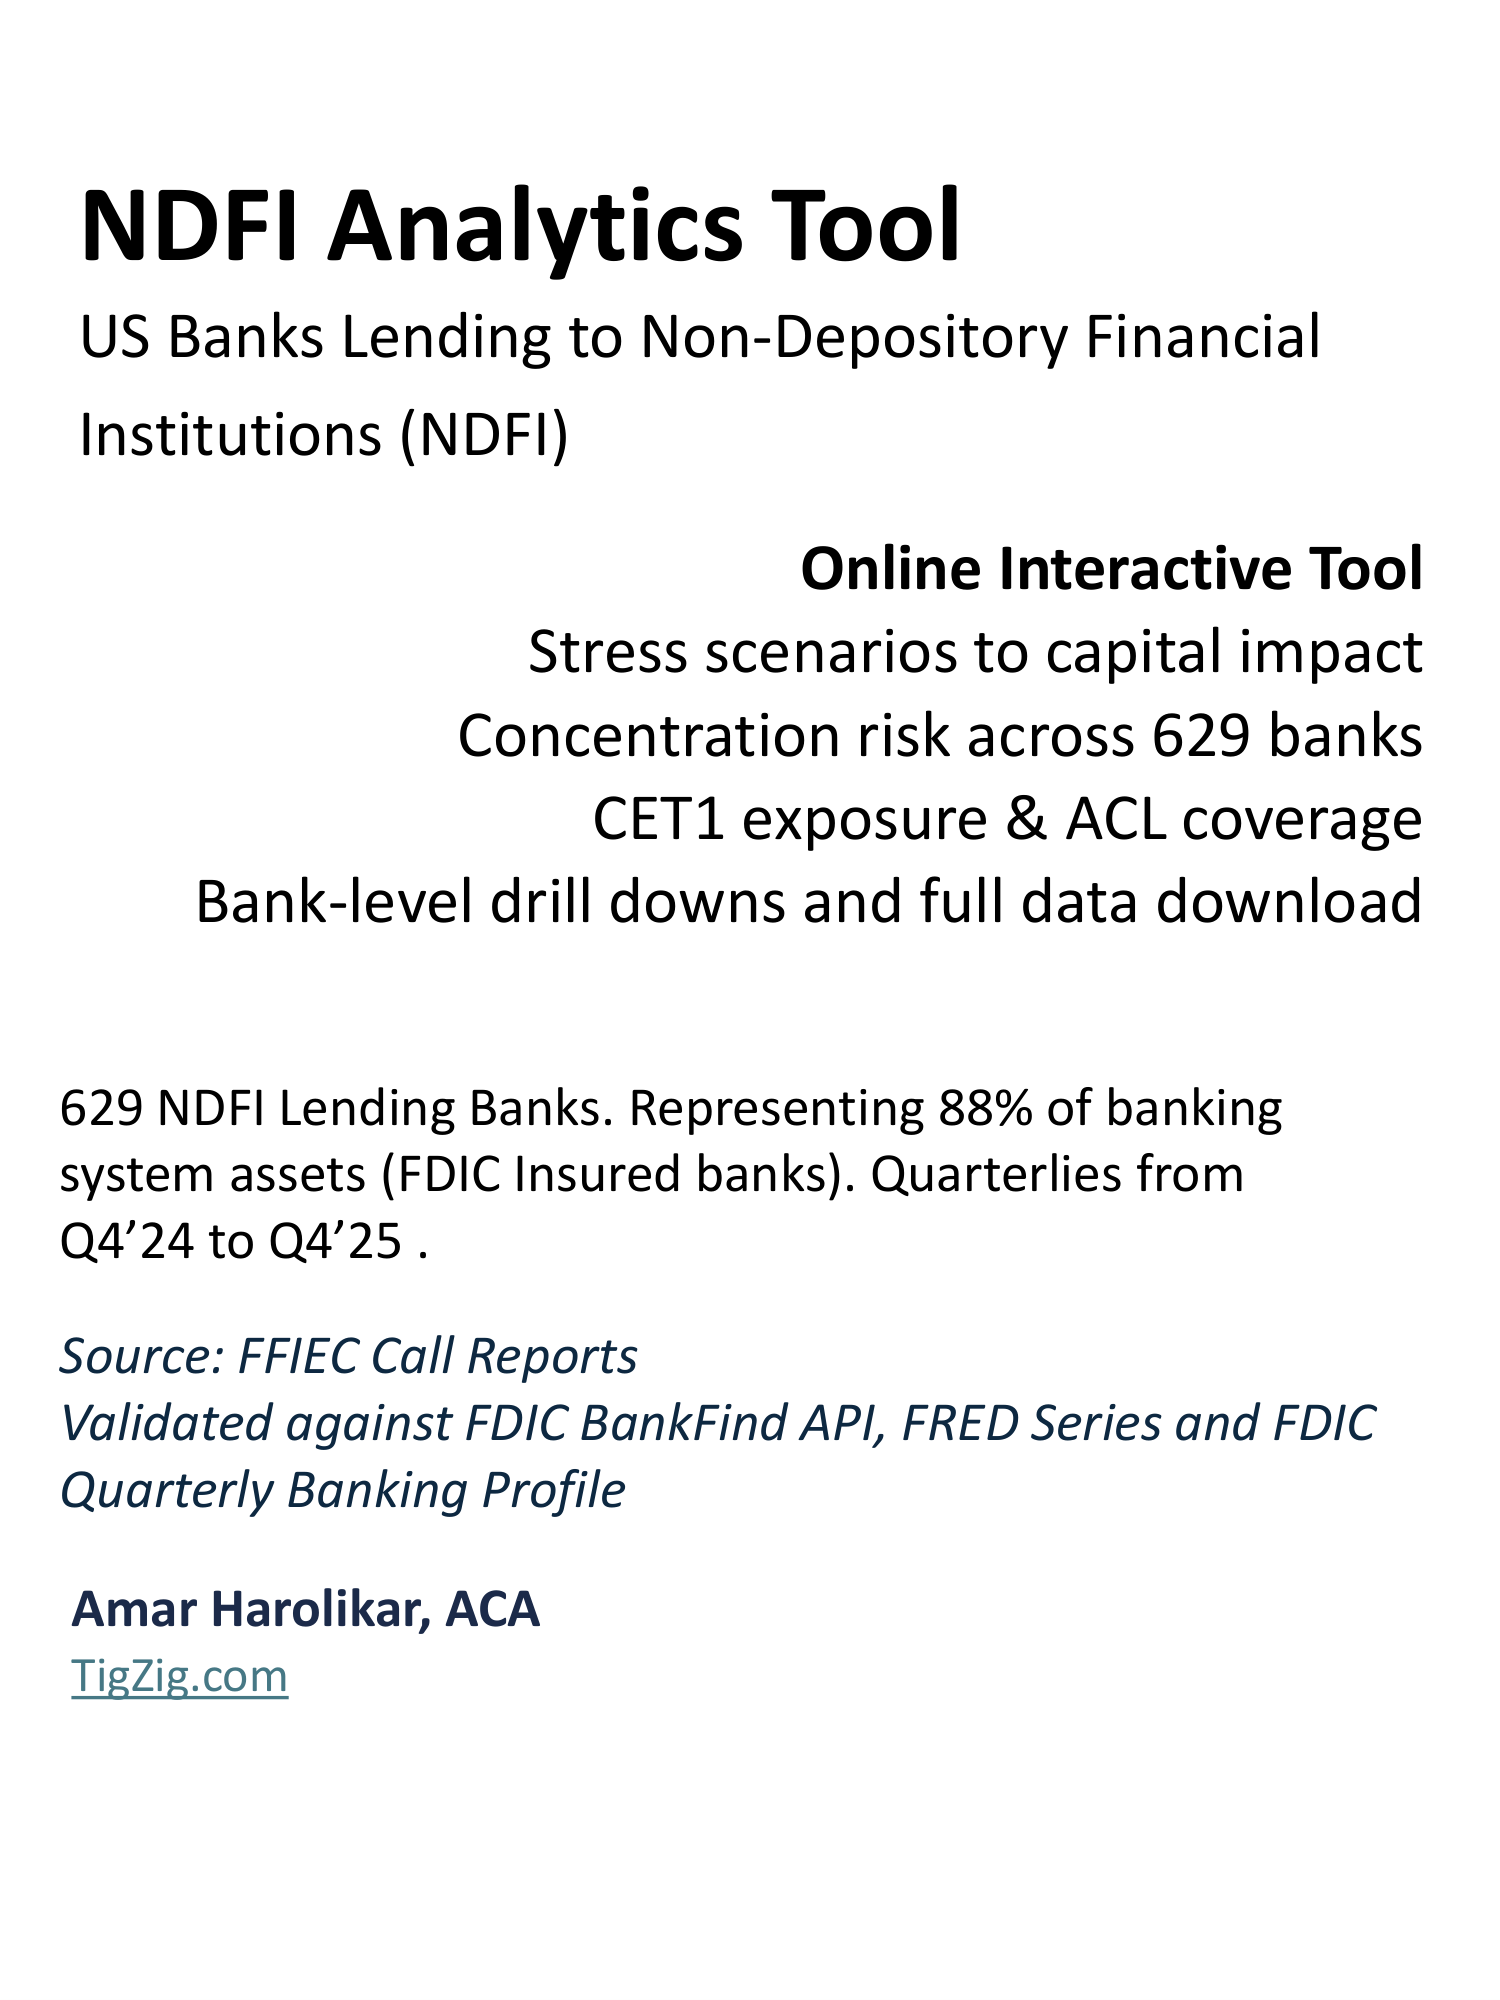
NDFI Analytics - US Bank Exposure to Non-Bank Lenders
Three Tools I Built for Market Analysis - QSUITE, TREMOR, QREP
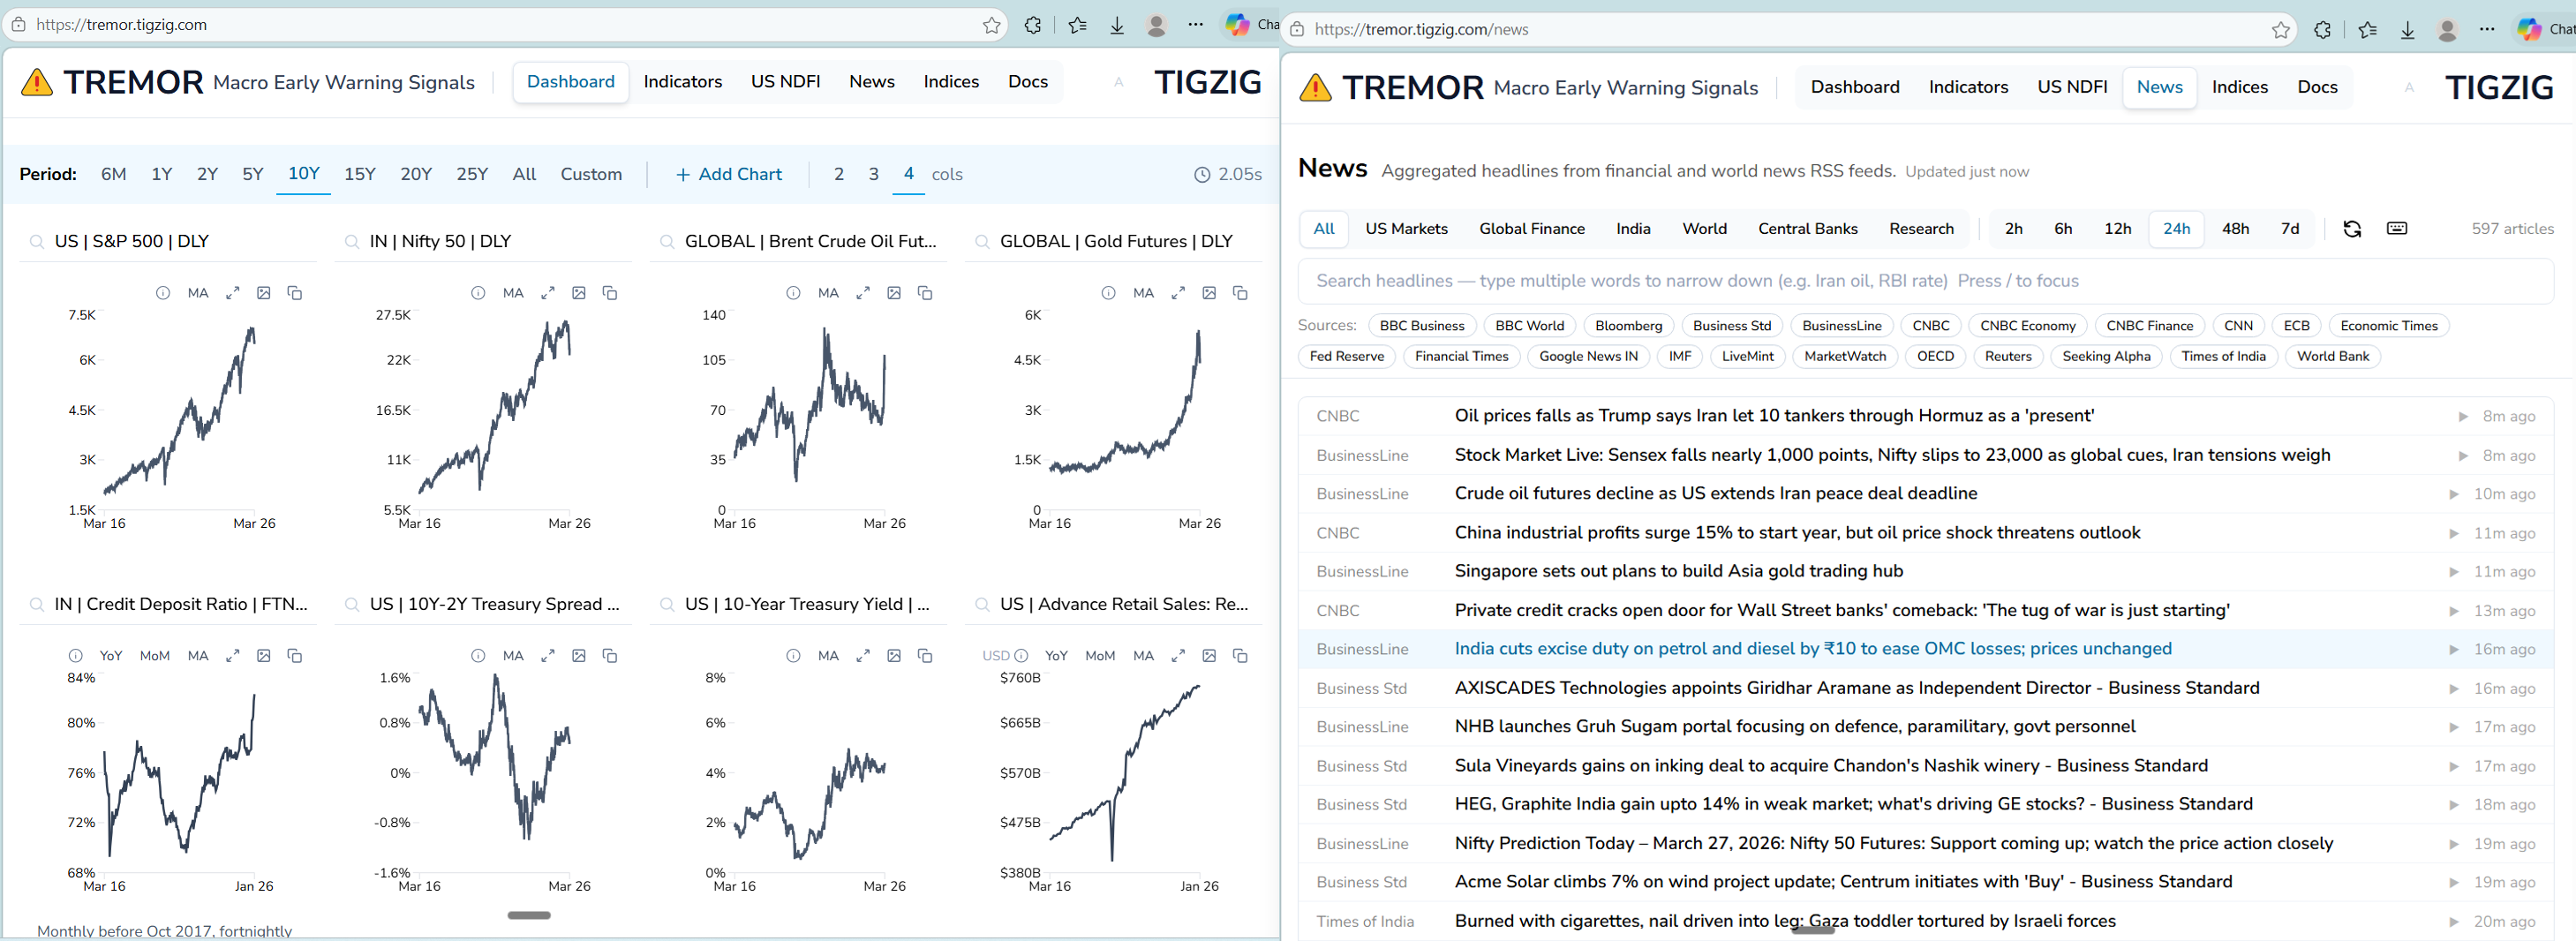
TREMOR - Macro Early Warning Dashboard - 50+ Indicators, Updated Daily
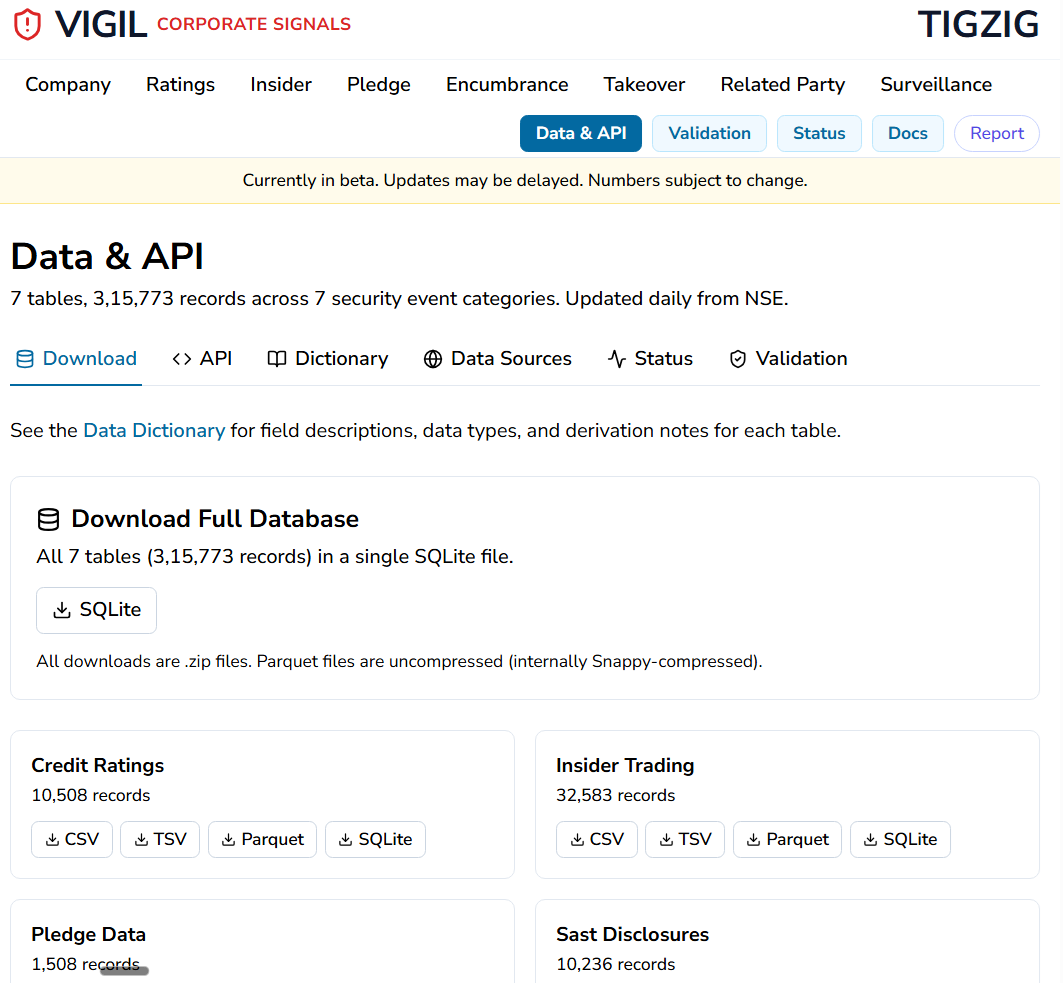
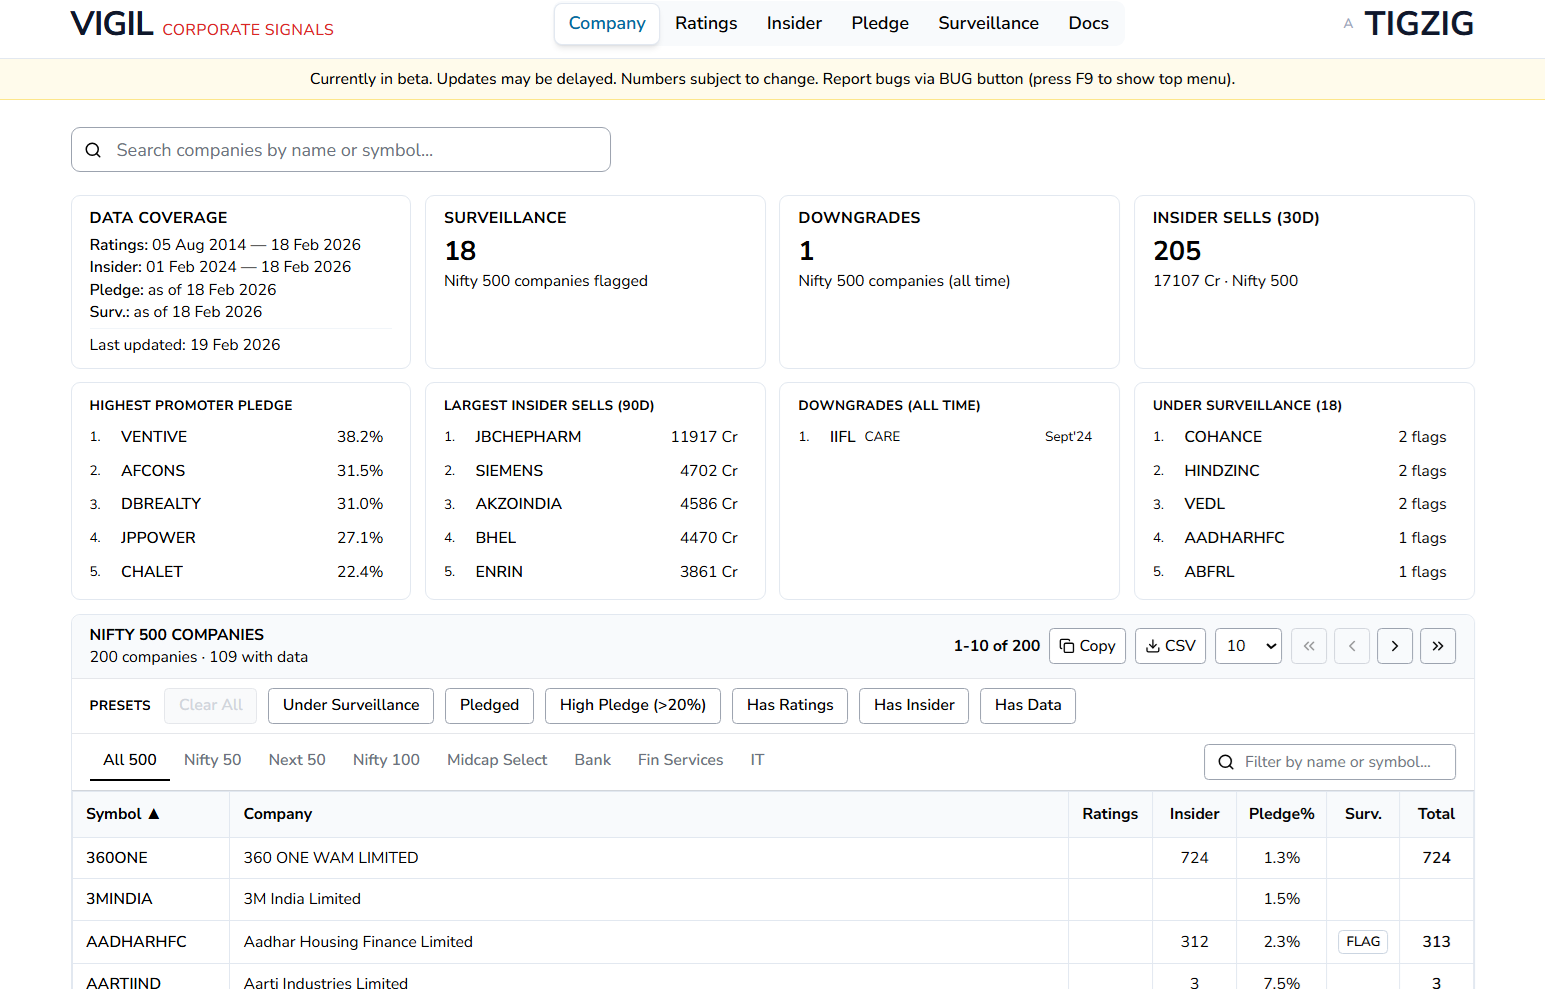
VIGIL Data API and Download - 315K+ Records, 7 Tables, Updated Daily
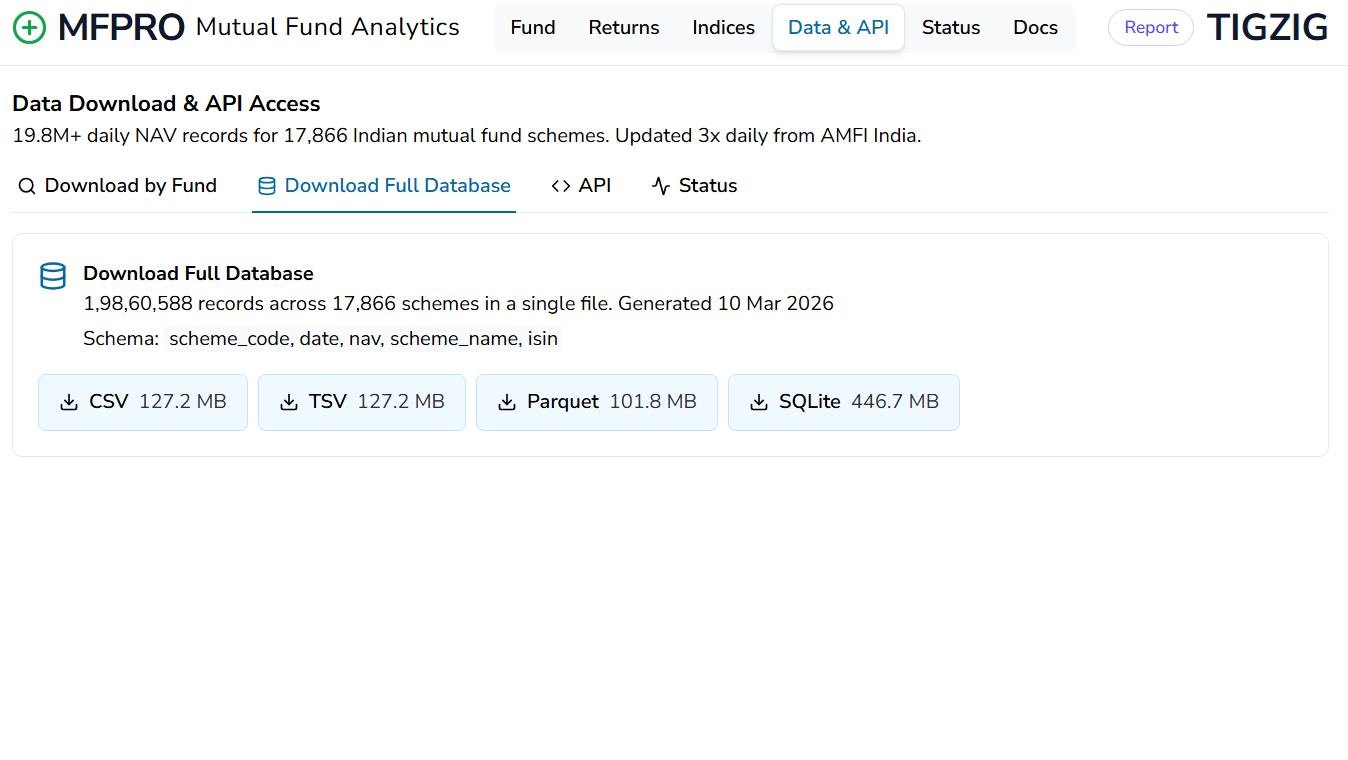
India Mutual Fund NAV Data Since 2013 - 19.8M+ Records. Download or Query via API. Free. No Auth.
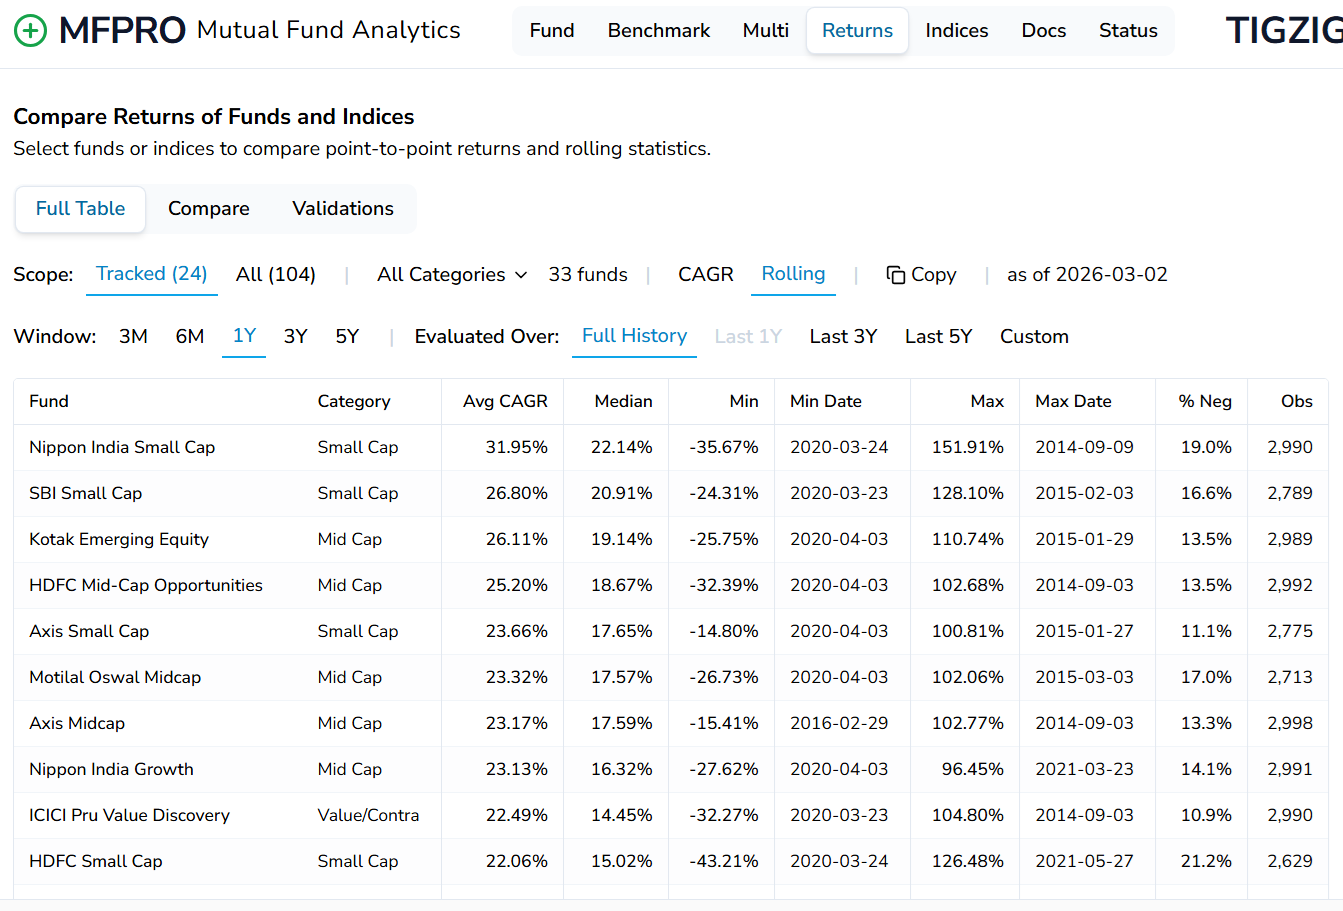
Now live - MFPRO v2 - Mutual Fund Analytics (India) - now with rolling returns, custom eval periods, multi-period & multi-instrument comparisons
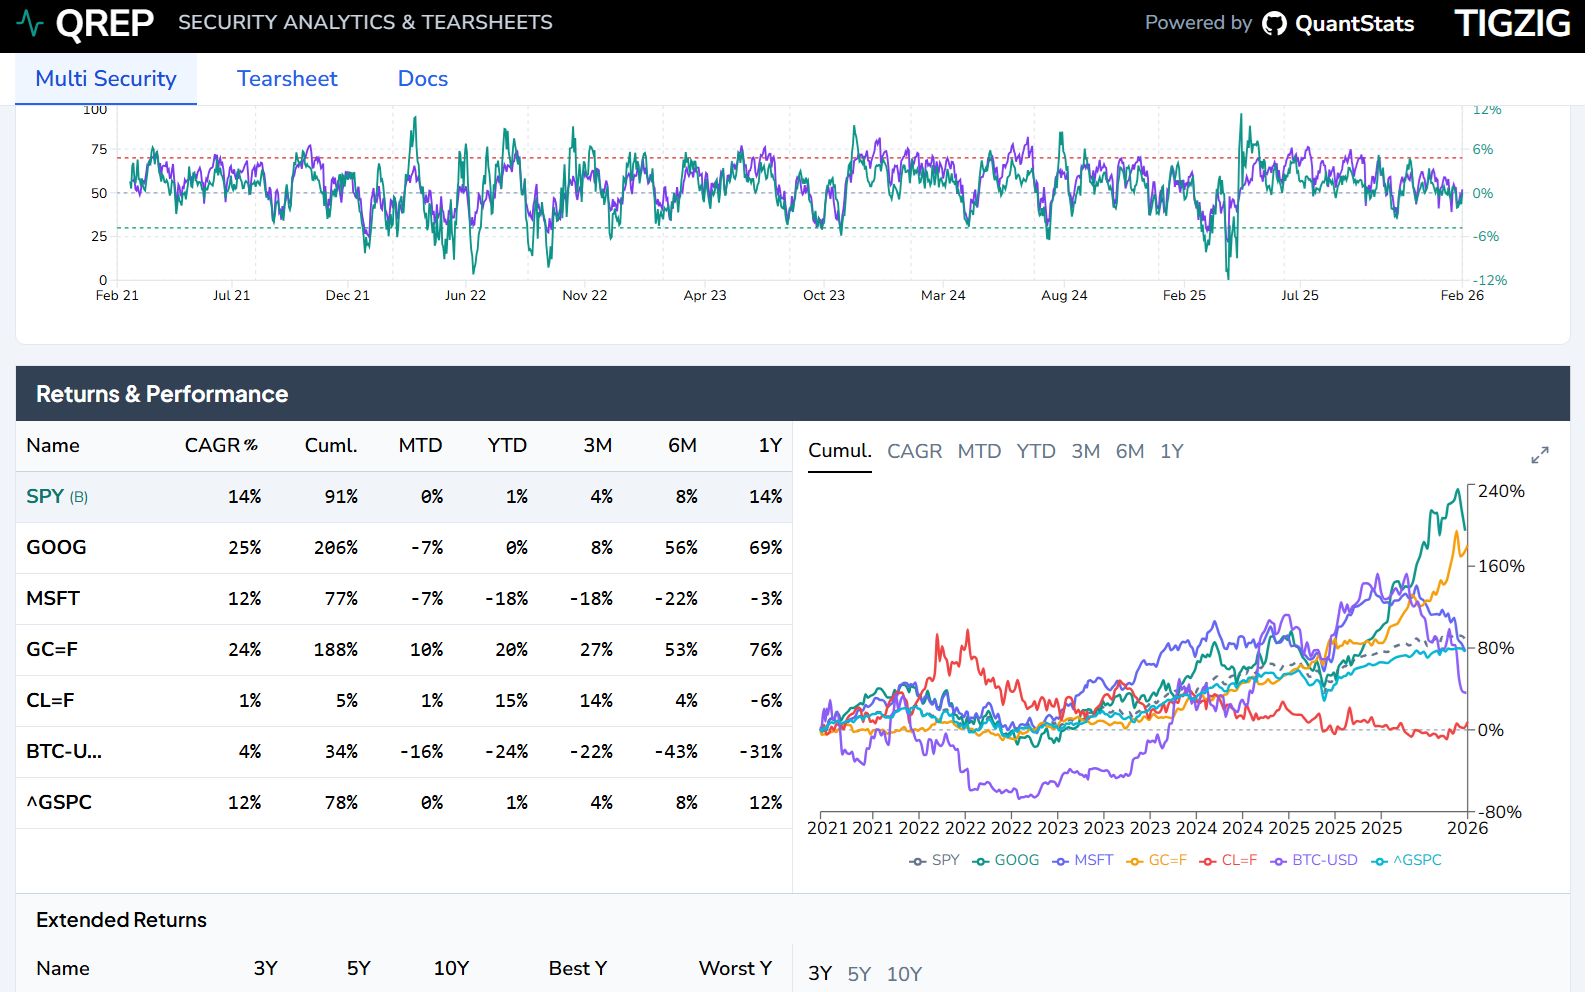
QRep - Powered by QuantStats. Live Now.