US Credit Unions on TREMOR. Card Charge-Offs at 5.11% - Already Past the 2009 GFC Peak.
Published: April 25, 2026
US Credit Unions...loans, delinquencies and charge-offs now live in an interactive analytics tool. 23 years, 86 quarters, $1.72 trillion in loans across 4,287 federally-insured credit unions. Compiled from NCUA's quarterly aggregate FPR, with sector level cuts. Same coverage for FDIC Banks & NY Fed Consumer Credit.
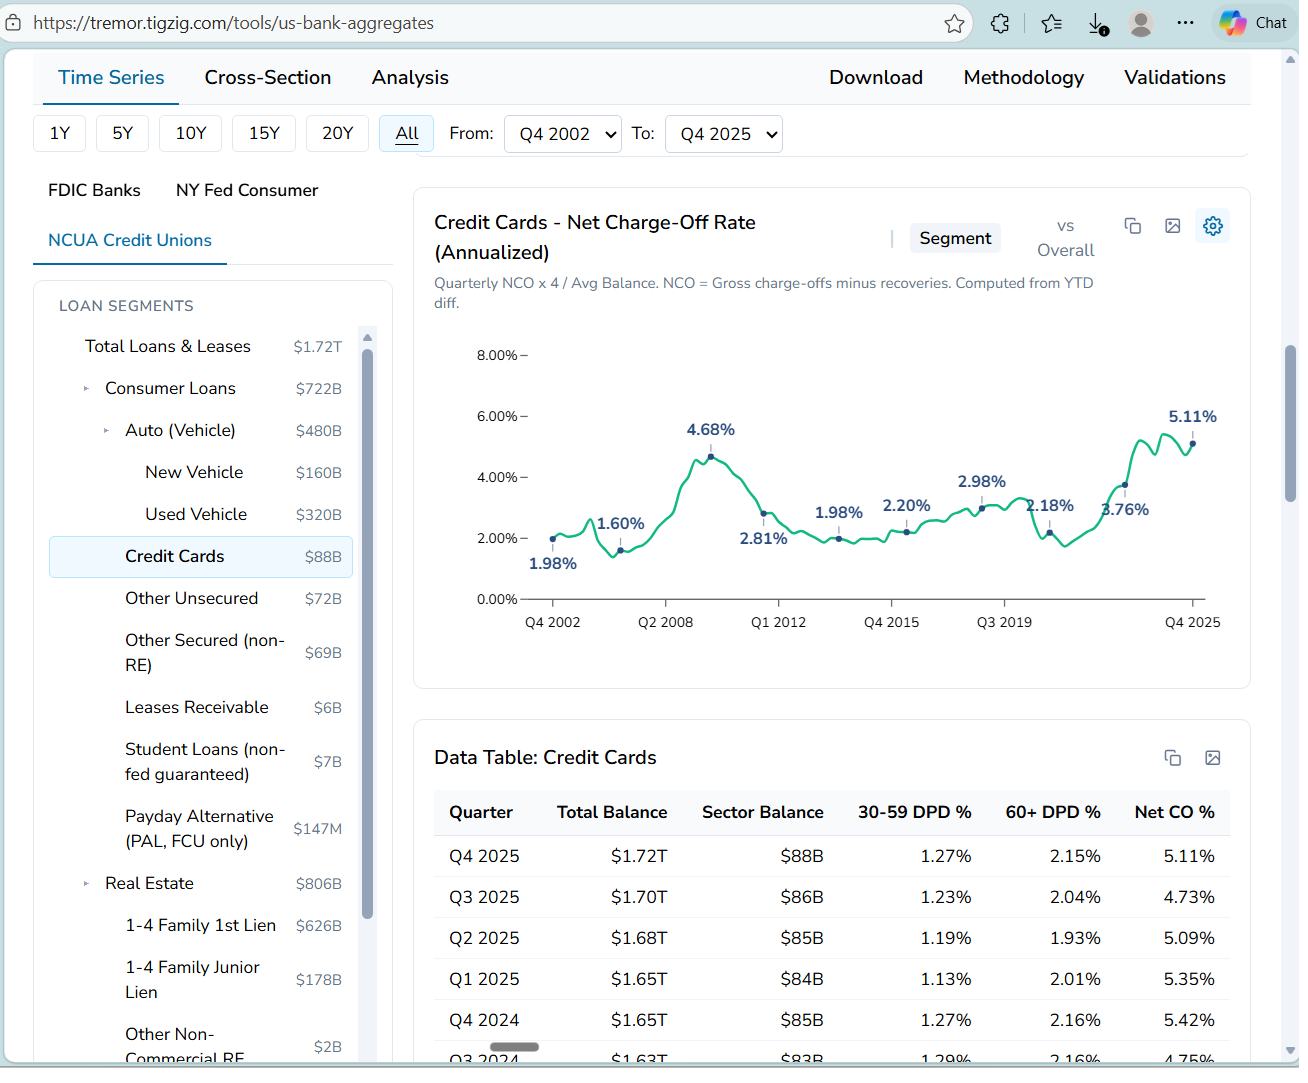
Net Charge-off in Credit Cards Q4-2025 hit 5.11%. GFC peak was 4.68% in Q4-2009 (quarterly annualized). Already past where the last cycle topped out.
Consumer segment NCO at 1.82% vs 0.99% pre-crisis. GFC peak was 2.21% in Q2'09.
The quarterly rise pattern in 2025 looks similar to 2007.
Credit Unions run a tighter book than banks on average. When that starts to break, things are no more tail. They are mainstream.
Questions - are credit unions tracking, leading, or diverging from the bank cycle? Which sectors are driving the losses? Run your own cuts.
What you can do:
- Loan balances and delinquency across 18 NCUA segments - Consumer, Real Estate, Commercial. Drill down to Cards, Auto and other sub-segs.
- 30-59 DPD, 60+ DPD, and quarterly-annualized Net Charge-Off per segment
- Cross-section view at any quarter
- Source notes for every NCUA reporting anomaly and reclassification
- CSV download with 74-field reference
Validation - 3 layers: Pipeline check, QCUDS PDF cross-check, and Fed Z.1 cross-publisher comparison. Full details on the tool.
tremor.tigzig.com ➔ US Credit ➔ NCUA Credit Unions
Working on something similar? How I work covers the rates, the availability and what I take on.