Trump Trades. From Mostly Bonds to 3,642 Equity Trades in One Filing. Free Tool to Search Every Transaction.
Published: May 21, 2026
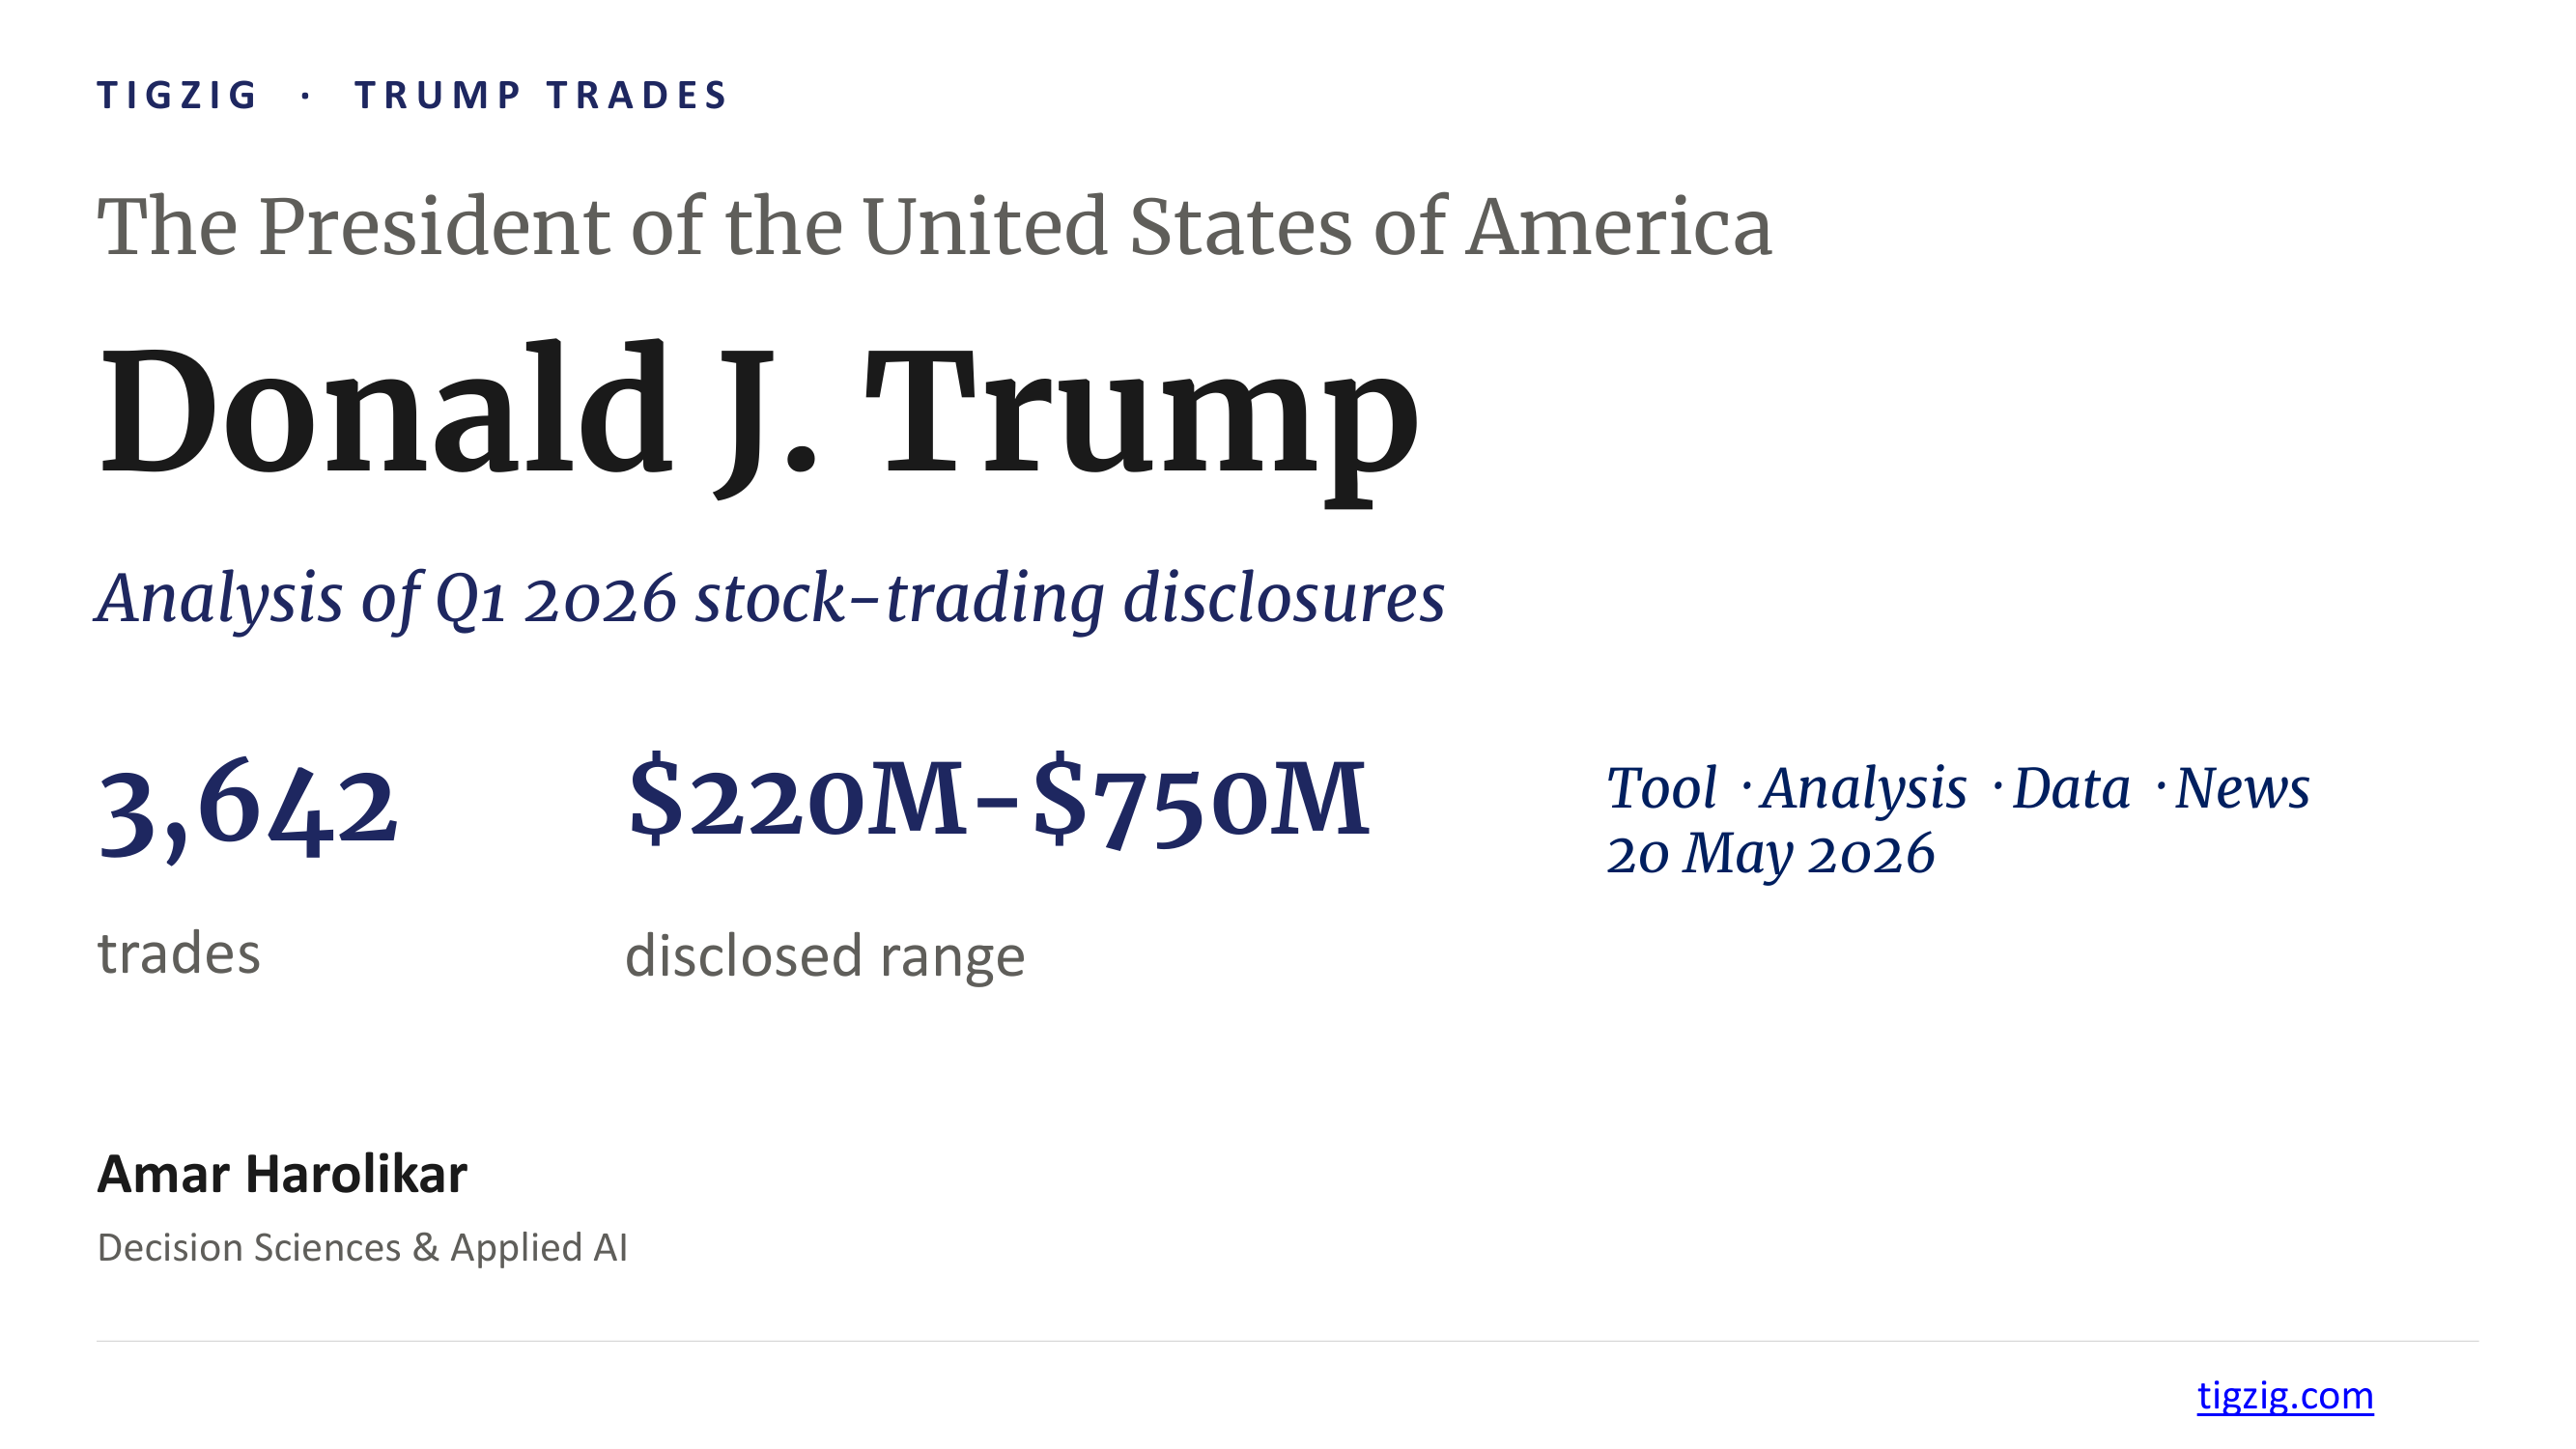
For 9 months, President Trump's filings showed mostly bonds. Then on 14 May, one filing came in with 3,642 equity trades. $220M to $750M. Heavy activity in Nvidia, Apple, Microsoft, Amazon, Meta, Oracle and other big tech names. Press has flagged some as preceding regulatory actions.
15 OGE filings since Aug 2025. The earlier 14 combined had 1,726 trades... almost all muni and corporate bonds. The 14th May filing alone has 3,642 trades. Almost all equities.
Built a small interactive tool on top of the OGE PDFs. Every transaction searchable. 1,058 tickers. Click any company to see the trade timeline overlaid on the price chart. CSV download for offline analysis.
Also sharing a short analysis deck on what the filing shows. Most active tickers, top buys, top sells, and policy overlaps the press has flagged.
Tool: tigzig.com → TREMOR → Trump Trades
Not financial advice. Educational analysis of a public filing. I hold positions in some of the tickers mentioned.
Trump Trades - Analysis of Q1 2026 Stock-Trading Disclosures
Browse the slides or download the PDF
Full Deck Content (Text Format)
Text below was extracted from the source deck. Chart visuals stay in the PDF and as slide images above the post.
Analysis of Q1 2026 Stock-Trading Disclosures - 20 May 2026
Tool · Analysis · Data · News
3,642 trades. $220M - $750M disclosed range. For 9 months President Trump's filings showed mostly bonds. Then on 14 May 2026 a single OGE filing landed with 3,642 equity trades. This brief lays out what the filing shows: filing-vs-filing composition, the most active tickers, the largest buys and sells, and the trade-vs-action timing the press has flagged. A free interactive tool covering every trade is live on TREMOR.
The 14 May Filing at a Glance
Transaction Report covering 06 Jan to 27 Mar 2026 - 45 trading days
3,642 equity trades filed in one report. ~58 per market day.
- 2,346 buys / 1,296 sells. 1.8 buys per sale.
- 52 buys + 29 sells per day on average.
- 1,058 distinct tickers. Roughly 3.4 trades each.
- $220M-$750M disclosed range (OGE Form 278-T reports each trade as a range bucket; total is the sum of those ranges).
The May Filing Dwarfs Every Prior One
15 OGE filings since Aug 2025. The May 14 filing alone has more trades than the previous 14 combined.
Prior 14 filings: 1,726 trades. Almost all muni and corporate bonds. 14 May filing: 3,642 trades. Almost all equities.
Trades per filing (most recent first):
- May '26 - 3,642
- Apr '26 - 69
- Mar '26 - 175 / 174 / 83 (three filings)
- Jan '26 - 191
- Dec '25 - 108
- Nov '25 - 32 / 39 / 79 / 57 (four filings)
- Sep '25 - 25
- Aug '25 - 149 / 507 / 38 (three filings)
The shift is visible at a glance: the 14 May report alone exceeds the cumulative trade count from August 2025 through April 2026.
The Interactive Tool
Built on top of the raw OGE PDF filings. Live on tigzig.com → TREMOR → Trump Trades.
Four views inside the tool:
- Filings tab. Composition before-vs-after for all 15 OGE filings.
- Companies tab. 1,058 tickers searchable. Sort, filter, drill, export.
- Live price + news. Trade timeline overlaid on the price chart + recent news for any ticker.
- S&P 500 view. Trades plotted against the index day by day.
CSV download for offline analysis.
How to Read the Amounts in This Deck and the Tool
OGE discloses each trade in a range, not an exact value.
OGE Form 278-T reports each trade as a range bucket (e.g. $250K-$500K), not an exact figure. Every dollar total in this deck and the tool is the sum of the midpoints of those buckets.
- What this CAN tell you: general scale and direction of activity.
- What this CANNOT tell you: the exact dollar value of any single trade, or a precise total in actual dollars.
Source: OGE Form 278-T public filings (Office of Government Ethics).
Asset Class Mix - Before and After (By Count)
Almost all bonds for 9 months. The May '26 filing - 98% equities.
Aug 2025 - Apr 2026 (14 filings, 1,726 transactions):
- Muni bonds 73%
- Corp bonds 14%
- Bank preferred 11%
- Others 2%
Almost entirely fixed income.
May 14, 2026 (1 filing, 3,642 transactions):
- Equities 98%
- Others 2%
Almost entirely equities.
Asset Class Mix - By Dollar Values
Same story - May '26 predominantly equities. Muni bonds typically trade in larger lot sizes than equities, so dollar volume can run higher even with fewer transactions.
Aug 2025 - Apr 2026: ~$781M (63% of all volume)
- Muni 67%
- Corp 27%
- Bank pref 2%
- Others 4%
May 14, 2026: ~$454M (37% of all volume)
- Equities 84%
- Others (mostly ETFs) 16%
Note: Disclosure has range buckets. Values shown are midpoint sums - useful for general direction, not exact.
Most Active Tickers
Top 12 by total activity (buy + sell midpoint), Jan - Mar 2026.
| Ticker | Company | Trades | Buy $M | Sell $M | Activity $M |
|---|---|---|---|---|---|
| MSFT | Microsoft Corporation | 22 | 5.25 | 16.89 | 22.14 |
| AMZN | Amazon.com, Inc. | 21 | 5.42 | 16.32 | 21.75 |
| META | Meta Platforms, Inc. | 20 | 1.67 | 16.57 | 18.24 |
| VIG | Vanguard Div Apprec ETF | 1 | 0.00 | 15.00 | 15.00 |
| VOO | Vanguard S&P 500 ETF | 5 | 6.75 | 6.00 | 12.75 |
| NVDA | NVIDIA Corporation | 15 | 4.20 | 2.71 | 6.91 |
| ORCL | Oracle Corporation | 17 | 3.62 | 3.26 | 6.88 |
| CDW | CDW Corporation | 6 | 3.08 | 3.00 | 6.08 |
| AAPL | Apple Inc. | 12 | 4.80 | 0.96 | 5.76 |
| ACN | Accenture plc | 14 | 1.46 | 3.42 | 4.89 |
| NFLX | Netflix, Inc. | 19 | 0.95 | 3.58 | 4.53 |
| UBER | Uber Technologies | 16 | 3.39 | 0.97 | 4.36 |
Top Buys
Largest positions bought during Jan - Mar 2026 (gross BUY $M, midpoint).
- VOO Vanguard S&P 500 ETF - $6.75M
- AMZN Amazon.com, Inc. - $5.42M
- MSFT Microsoft Corporation - $5.25M
- AAPL Apple Inc. - $4.80M
- NVDA NVIDIA Corporation - $4.20M
- COST Costco Wholesale - $4.05M
- IEMG iShares MSCI Emerging ETF - $3.75M
- MSI Motorola Solutions - $3.71M
- ORCL Oracle Corporation - $3.62M
- ADBE Adobe Inc. - $3.56M
Top Sells
Largest positions sold during Jan - Mar 2026 (gross SELL $M, midpoint).
- MSFT Microsoft Corporation - $16.89M
- META Meta Platforms - $16.57M
- AMZN Amazon.com, Inc. - $16.32M
- VIG Vanguard Div Apprec ETF - $15.00M
- VOO Vanguard S&P 500 ETF - $6.00M
- NFLX Netflix, Inc. - $3.58M
- ACN Accenture plc - $3.42M
- ORCL Oracle Corporation - $3.26M
- PLTR Palantir Technologies - $3.23M
- DIS The Walt Disney Company - $3.22M
Trade-Action Timing Flagged by the Press (1 of 2)
Q1 2026 OGE disclosures, alongside same-company actions by the administration.
NVDA - NVIDIA Corporation. Bought $500K-$1M on Jan 6. A week later, on Jan 13, Commerce approved Nvidia H200 chip sales to China.
AMD - Advanced Micro Devices. Bought $50K-$100K on Jan 6. On Jan 13, Commerce authorised AMD chip sales to China in the same rule. At least $740K in AMD across Q1.
AXON - Axon Enterprise. Bought $1M-$5M on Feb 10. On Mar 2, ICE outlined a $220M five-year Taser contract - specifications only Axon products meet.
DELL - Dell Technologies. Bought $1M-$5M on Feb 10. Dell family pledged $6.25B to Trump Accounts in Dec 2025. Trump endorsed Dell at the White House on May 8.
Trade-Action Timing Flagged by the Press (2 of 2)
PLTR - Palantir Technologies. Bought ~$247K-$630K across Q1 (seven March transactions, several unsolicited). In February, Palantir struck a billion-dollar DHS contract.
BA - Boeing Company. Multiple Boeing buys during Q1 (a major US government contractor). On May 14 in Beijing, Trump announced Xi had agreed to a 200-plane order.
INTC - Intel Corporation. Began buying INTC in early March (multiple unsolicited). Follows the US government's late-2025 decision to acquire a 9.9% stake in Intel.
LLY - Eli Lilly and Company. Bought up to $680K across seven Q1 purchases (four unsolicited), first on Jan 6. CMS launched a Medicare GLP-1 pilot with a Jan 8 deadline.
Press Sources
- CNBC, 14 May 2026 - China will order 200 Boeing jets, Trump tells Fox News
- CNBC, 14 Jan 2026 - Trump administration clears way for Nvidia H200 chip sales to China
- CNBC, 15 May 2026 - Trump touted Palantir on Truth Social after buying the company's stock, records show
- CNBC, 15 May 2026 - Trump went big on tech stocks in first quarter of 2026, new filings show
- Washington Post, 19 May 2026 - Trump discloses thousands of stock trades, some in companies he influences
- CNN, 22 Aug 2025 - The US takes a 10% stake in Intel as part of Trump's big tech push
- NOTUS, 14 May 2026 - Trump Bought Corporations' Stock as His Administration Boosted Their Business
- NOTUS, 2 Mar 2026 - ICE Plans to Spend $220 Million on Tasers
- KFF Health News, 18 May 2026 - Trump Bought Stock in Drugmaker as His Government Boosted Its Obesity Drugs
- Yahoo Finance, 14 May 2026 - Trump revamps portfolio, adding Nvidia and other AI names
- TheStreet, 11 May 2026 - Trump praised a company at the White House and the stock soared
- TheStreet, 18 May 2026 - Trump brokerage bought Broadcom, Synopsys, Dell, Intel in Q1
What the White House and Trump Organization Say
Verbatim, as reported.
"President Trump's investment holdings are maintained exclusively through fully discretionary accounts independently managed by third-party financial institutions with sole and exclusive authority over all investment decisions. Trades are executed and portfolios are balanced through automated investment processes and systems administered by those institutions. Neither President Trump, his family, nor The Trump Organization plays any role in selecting, directing, or approving specific investments. They receive no advance notice of trading activity and provide no input regarding investment decisions or portfolio management of any kind."
- The Trump Organization (spokesperson, statement carried by CNBC). CNBC, May 19 2026.
Disclaimer and Notes
Important context for everything in this deck.
Not financial advice. This deck is educational analysis of a public filing. Nothing here is a recommendation to buy, sell, or hold any security. Make your own decisions, talk to a registered advisor if you need one.
Position disclosure. I hold positions in some of the tickers mentioned in this deck.
Best effort, no guarantees. OGE Form 278-T filings are PDFs with thousands of rows. The data was extracted using LLM vision models and document parsers, cross-checked across methods, with about 50 rows reviewed manually. Errors are possible. Treat the numbers as estimates, not audited figures.
Dollar values are midpoint sums. OGE discloses each trade as a range bucket, not an exact figure. Every dollar total here is the sum of the midpoints of those buckets. Useful for direction and scale. Not exact.
Use at your own risk. I make no claim of accuracy, completeness, or fitness for any purpose. If you act on anything in this deck, that's on you, not me.
Methodology. Refer to the 'Methodology' tab in the tool for detailed process and explanations.
Amar Harolikar - Decision Sciences & Applied AI - tigzig.com - Apps for Analytics, Quants and Automation.
Working on something similar? How I work covers the rates, the availability and what I take on.