Best used with an AI agent

40+ live apps, open data APIs, MCP servers, and 200+ guides - more than anyone wants to click through. Point your AI here and it reads the whole map and does the work: finds the tool, pulls the data, runs the analysis, and hands you the links.

Here for the open-source code? Your agent finds the right repo for you - and can even clone and deploy it.

Prefer to explore on your own? Go right ahead.

Paste this to Claude Code, Codex, or any AI agent:
Go to tigzig.com and read tigzig.com/llms.txt. It is a practitioner toolkit - 40+ analytics apps, open no-auth data APIs, MCP servers, open-source repos (github.com/amararun), and 200+ build guides. Help me [your task]. Surface the exact links; where there is an API or MCP, call it directly; and if I want to self-host, find the repo and help me deploy it.

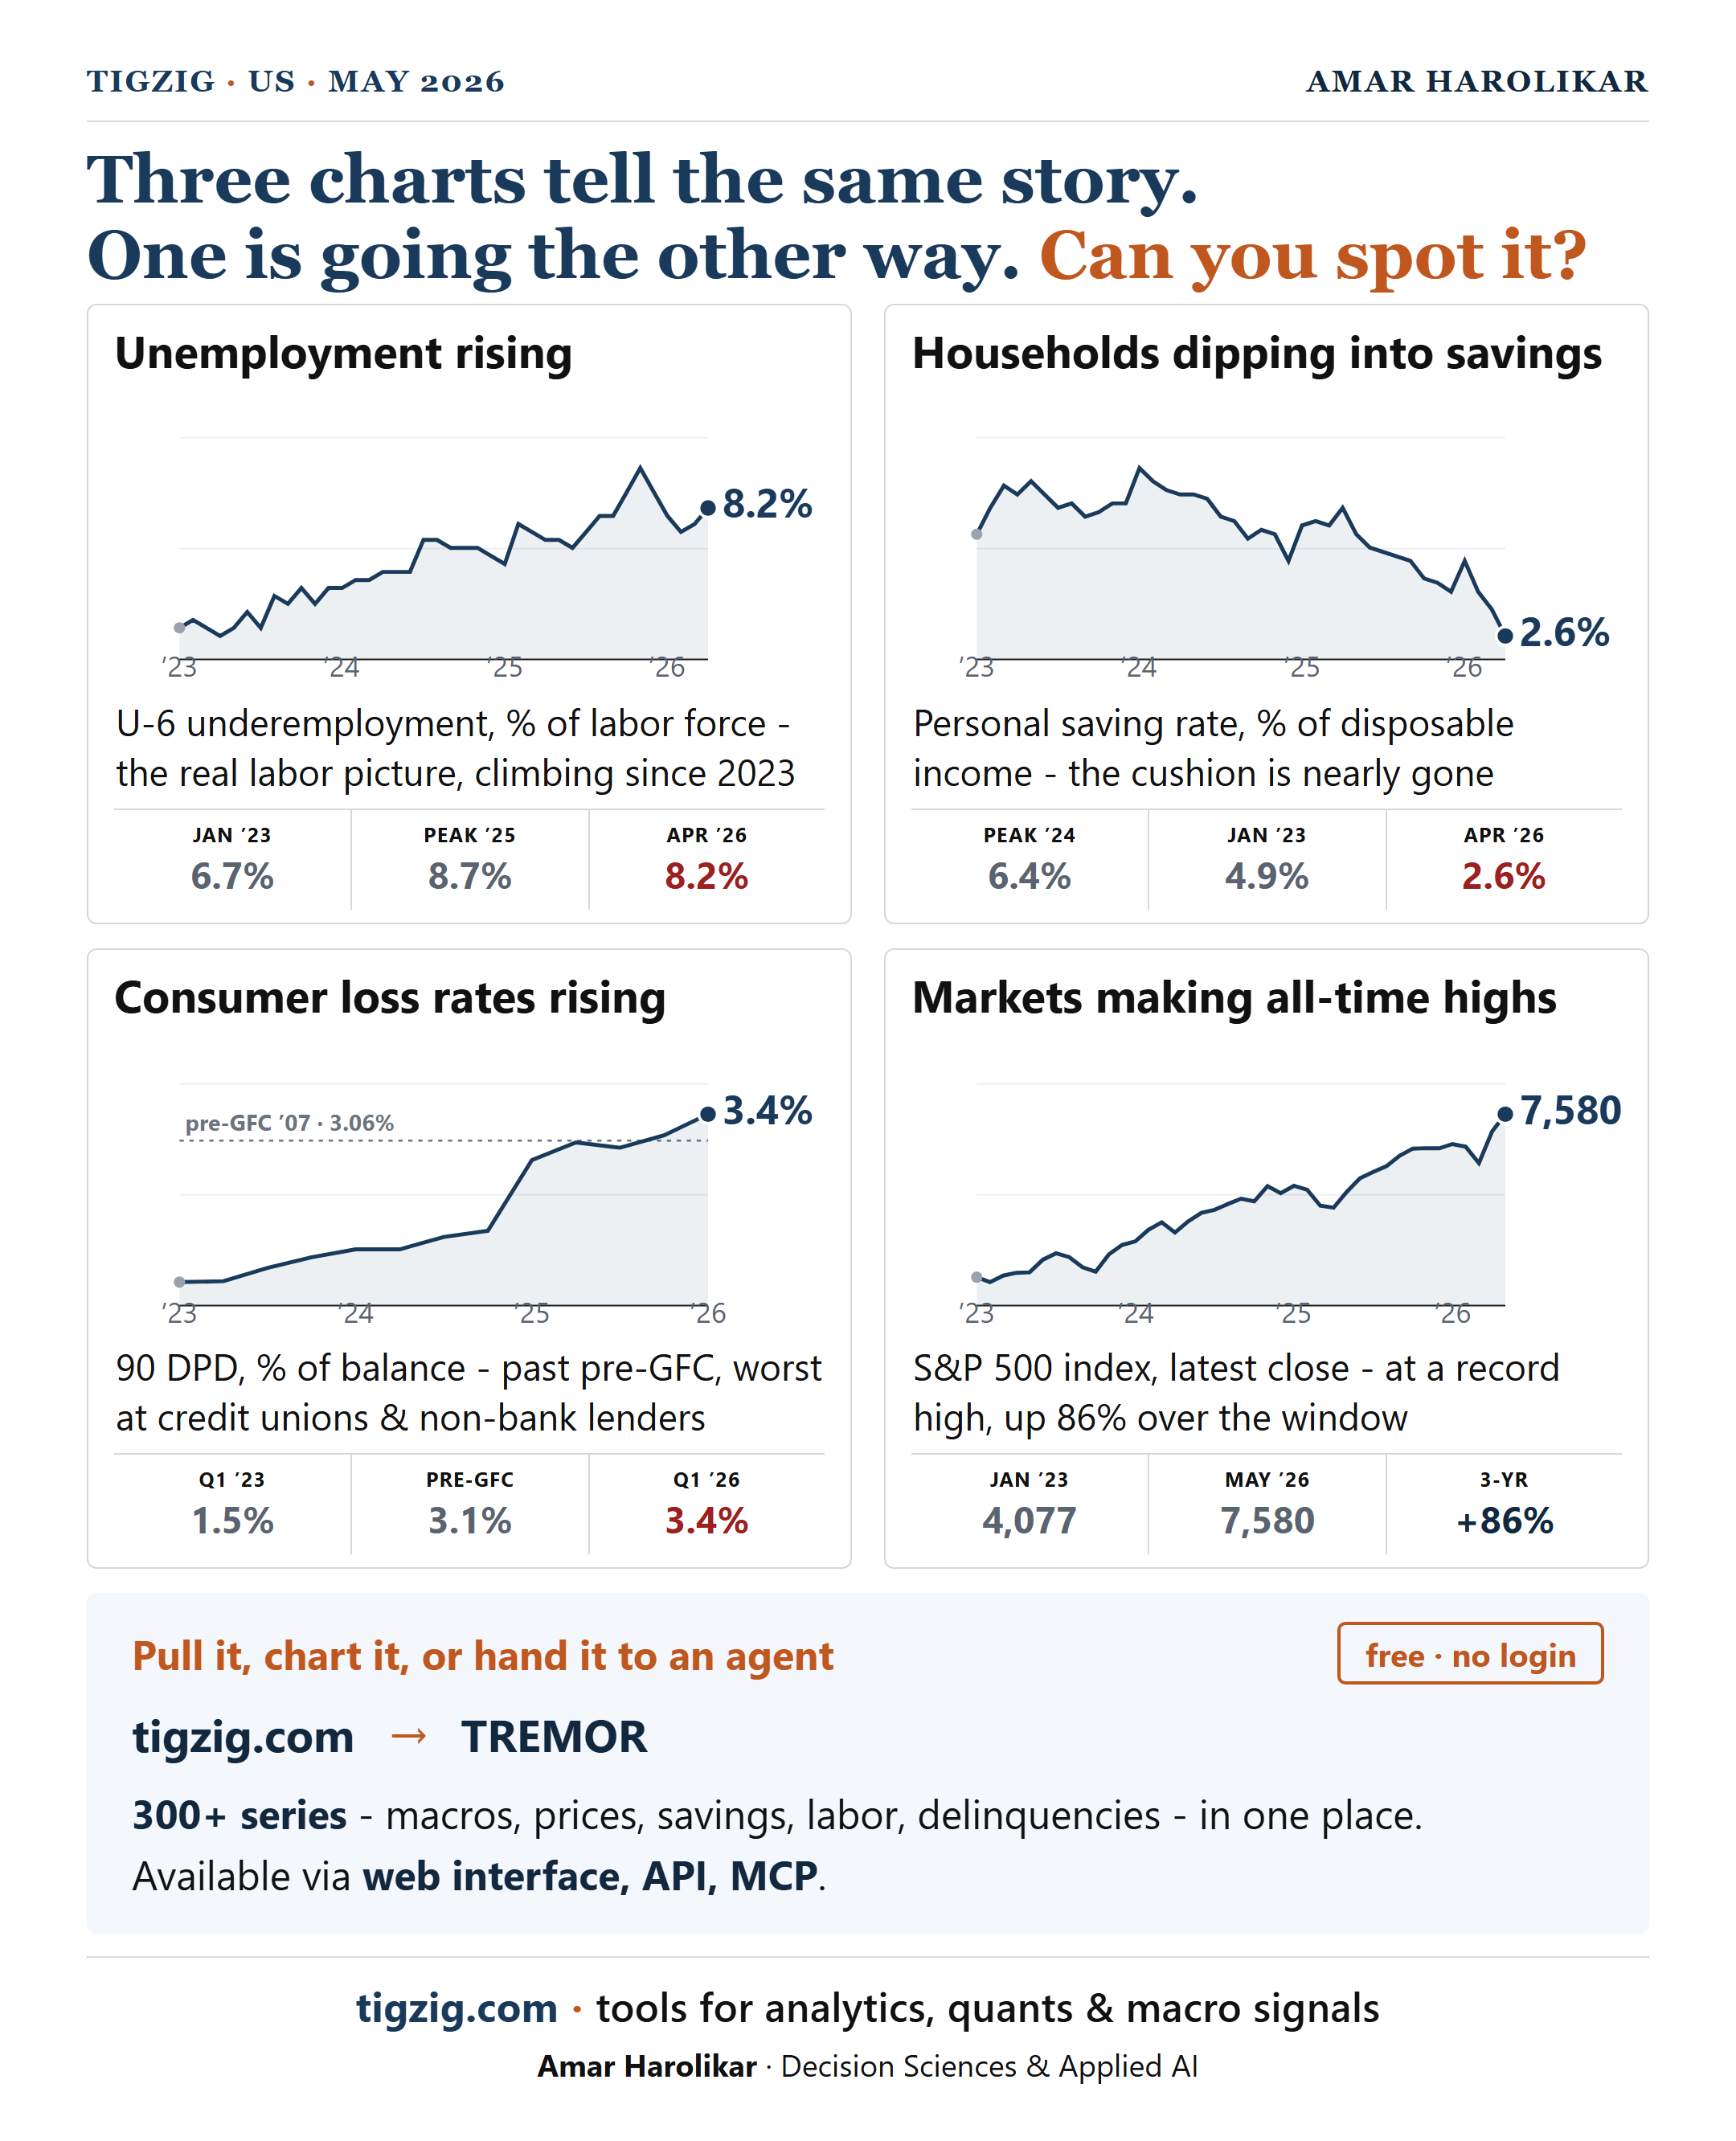
Which Chart Is the Odd One Out? Three Macro Charts Tell the Same Story. One Doesn't.

Published: May 31, 2026

Which chart is the odd one out? Maybe there is no odd chart. Or maybe the odd chart knows something the rest of the world doesn't.

Check it yourself. Tools I built and use at tigzig.com. Free, no login. Macro, prices, credit stress. Web, API, or wire it to your agent over MCP.

TIGZIG US Macro May 2026 - Three charts tell the same story, one is going the other way. Can you spot it? U-6 underemployment 8.2%, personal saving rate 2.6%, consumer 90 DPD 3.4% past pre-GFC, S&P 500 at 7,580 up 86%.