Pull 81 Risk and Performance Metrics Into Excel With One Formula
Published: September 17, 2026
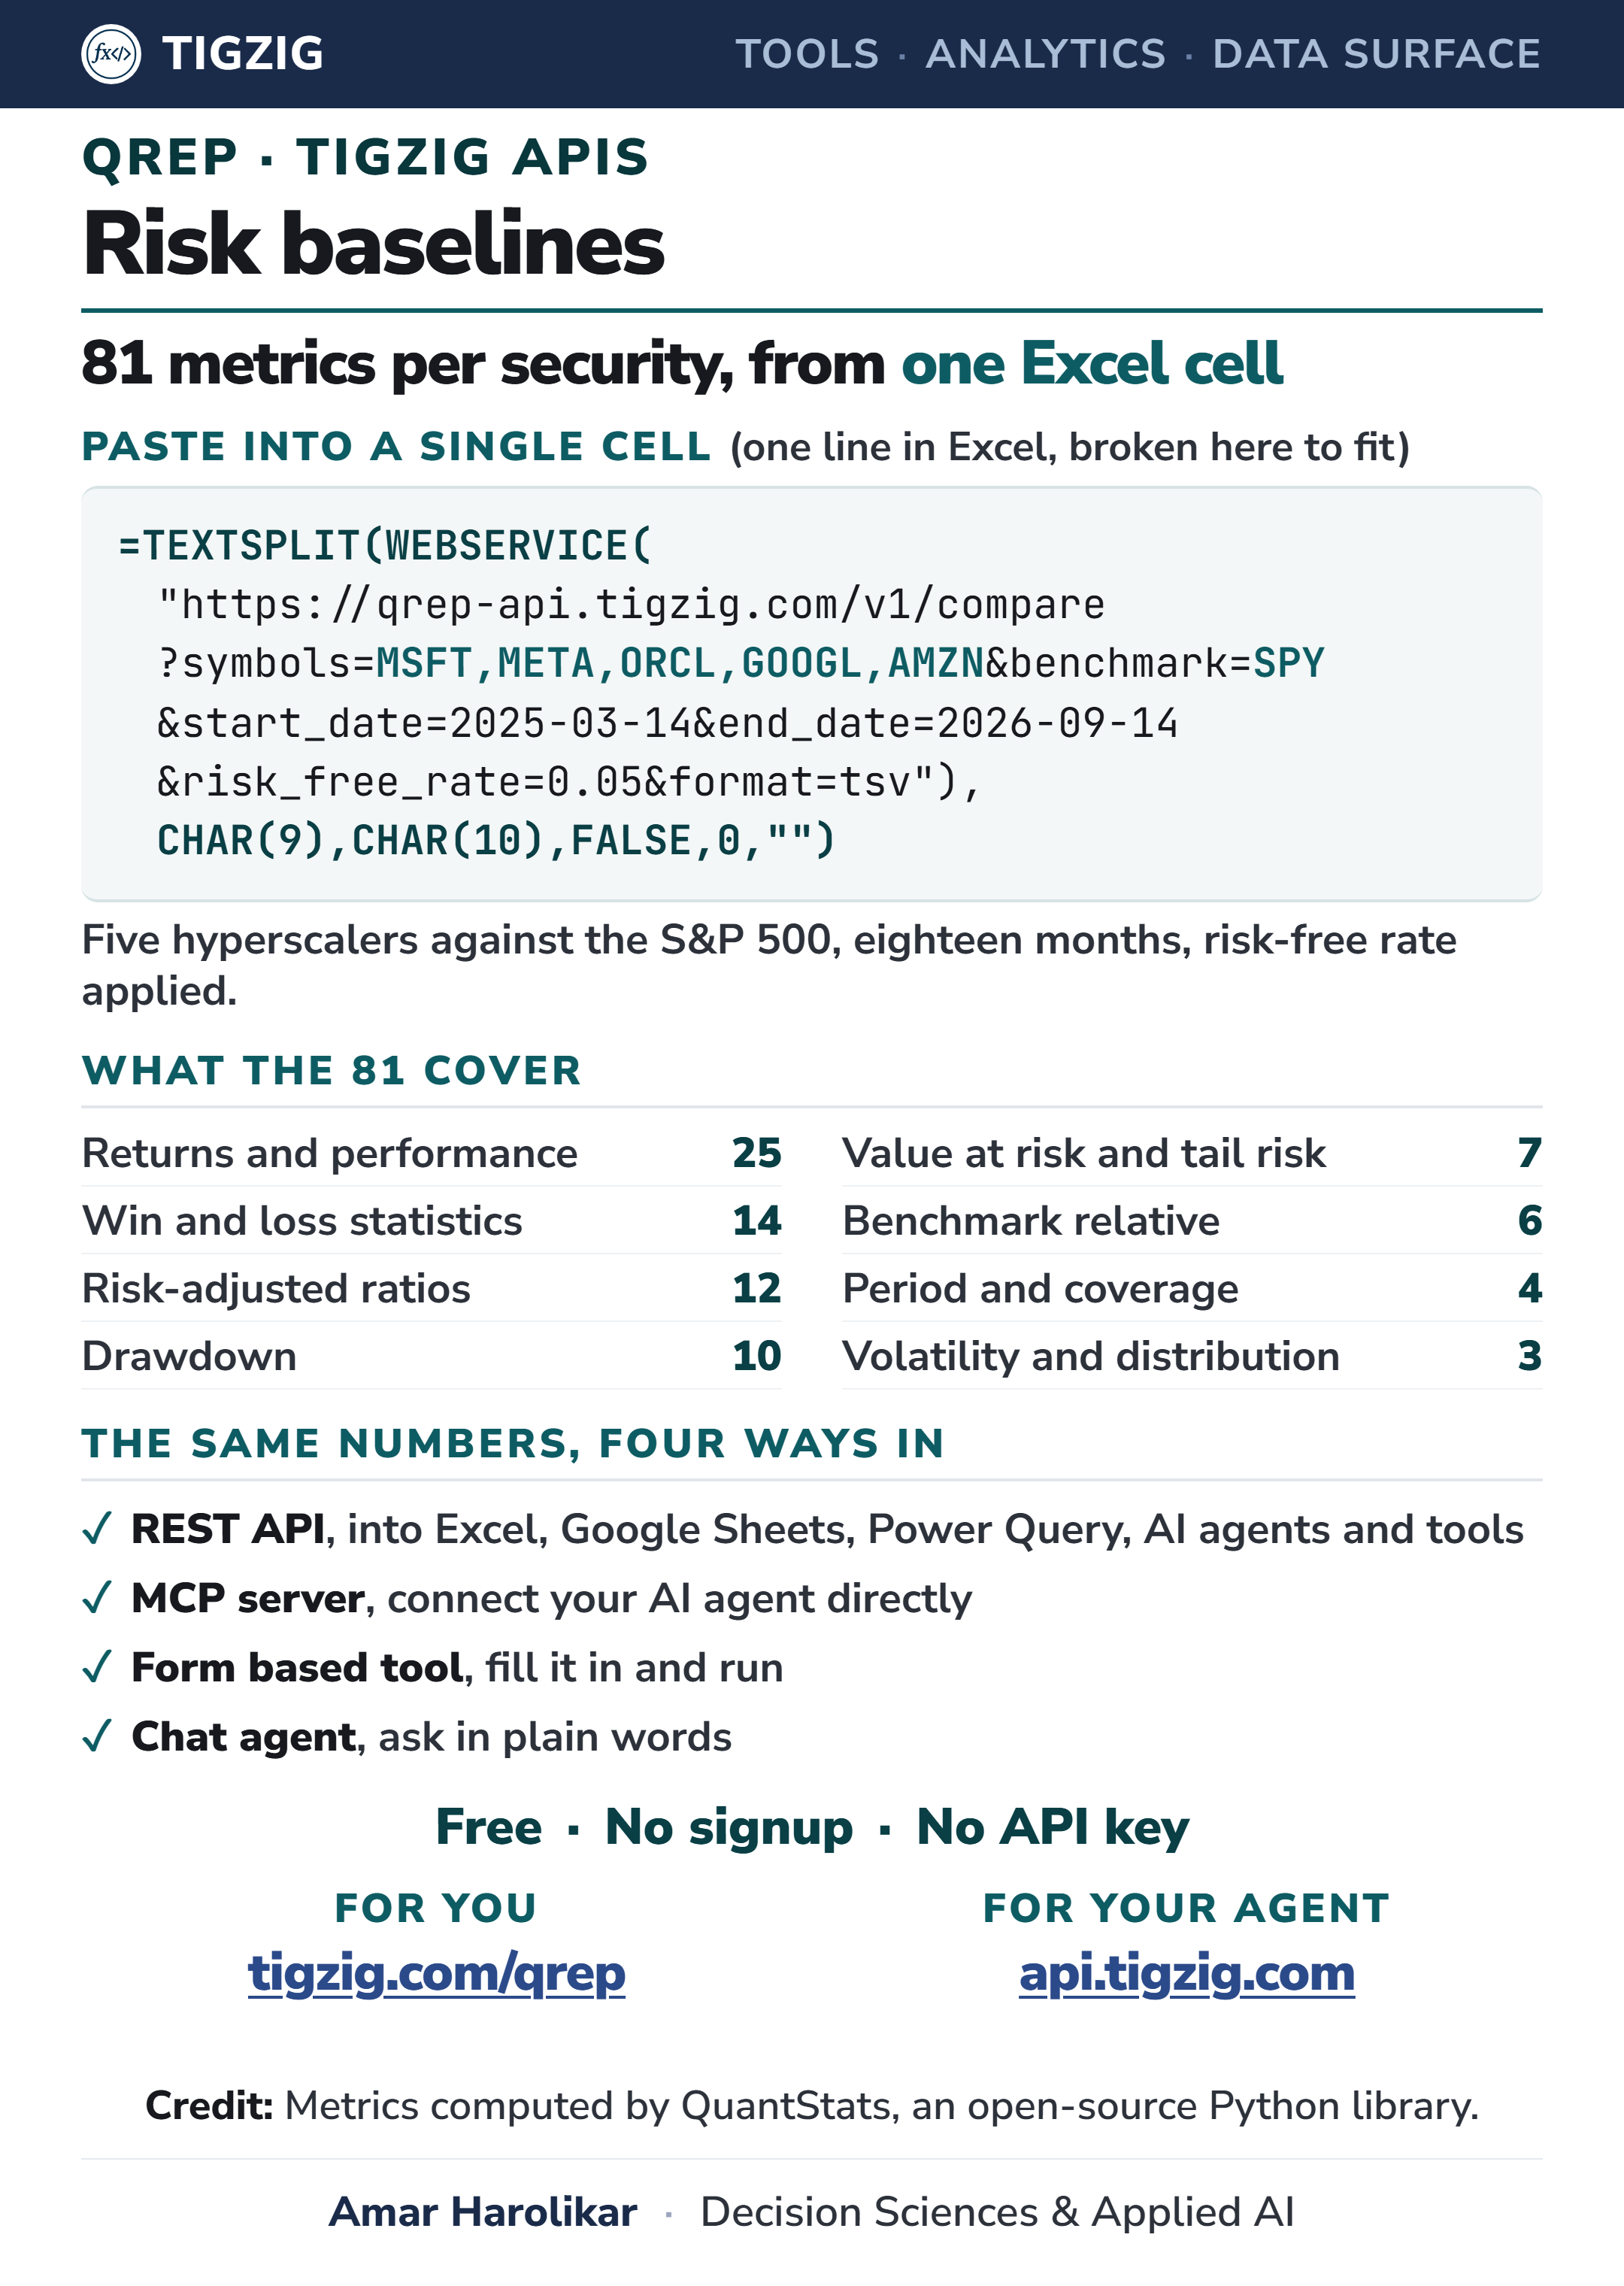
Did you know you can pull 81 risk and performance metrics for a stock, crypto, commodity or FX pair straight into Excel with one formula? It is powered by the Tigzig API. Copy the formula below into a cell, hit enter and give it a few seconds.
It uses the Excel WEBSERVICE function to make an API call. That works well for many cases. It has some limitations too, and those are further down.
The formula
Paste this into a single Excel cell and hit enter.
=TEXTSPLIT(WEBSERVICE("https://qrep-api.tigzig.com/v1/compare?symbols=MSFT,META,ORCL,GOOGL,AMZN&benchmark=SPY&start_date=2025-03-14&end_date=2026-09-14&risk_free_rate=0.05&format=tsv"),CHAR(9),CHAR(10),FALSE,0,"")
If you get a warning, hit 'Paste without active content'. If it gives an error, go to the end of the formula and hit enter again.
See the raw data in a browser
Paste this into your browser if you just want to look at the numbers.
https://qrep-api.tigzig.com/v1/compare?symbols=MSFT,META,ORCL,GOOGL,AMZN&benchmark=SPY&start_date=2025-03-14&end_date=2026-09-14&risk_free_rate=0.05&format=tsv
Your browser will ask you to save a file named 'compare'. Save it, open it with Notepad and copy the values straight into Excel. Swap format=tsv for format=json if you would rather read it on screen. You can get the same thing from the tool itself.
One caveat on WEBSERVICE
Each call is one API request from one cell. That is fine for a single request like this one. Point it at a few hundred symbols and it stops working well. Excel sends all those calls out at once, so you run into the host's rate limit and get errors back for most of them. Power Query handles that case properly. So does Python inside Excel, which for me means xlwings Lite. I have written about both elsewhere.
Parameters
The risk free rate is a decimal fraction. 0.05 means 5 percent, and passing 5 is rejected. Six symbols is the maximum per call, and the benchmark sits outside that count. Dates are plain YYYY-MM-DD.
The tool
This is part of Tigzig's QDESK set of market tools. It is available via API, via MCP, through an AI agent interface, and through a form if you would like to do it yourself. It works for any Yahoo Finance ticker with data.
For you: tigzig.com/qrep
For your agent: api.tigzig.com
Credit
The backend is powered by the Python QuantStats library, github.com/ranaroussi/quantstats. I have made some changes to the calculations. Those are covered in the Docs section of the tool.
Working on something similar? How I work covers the rates, the availability and what I take on.