There Is No Modern Playbook for This. US Core Inflation at 3.3%, Re-Accelerating. Producer Prices at 6.4%. Consumer Delinquencies Past 2007.
Published: June 12, 2026
There is no modern playbook for this. US core inflation - the gauge the Fed targets at 2% - is at 3.3% and re-accelerating. Outside Covid, it was last at this level in 1992. For 25 years before Covid it averaged 1.7%. It has now spent 62 straight months above target.
And the pipeline says more is coming. Producer prices are rising 6.4%, the hottest in the modern series outside Covid.
Somebody has to pay - corporate margins, consumer paychecks, or both.
Consumer delinquencies are already past their 2007 pre-crisis mark.
Meanwhile the S&P set a record on June 2. The last two times the market was priced like this while the economy cracked underneath - 2000 and 2007 - the index halved.
Full note in the carousel.
- Prior analysis: tigzig.com → Analysis
- Series live at tigzig.com → Tremor. 300+ indicators. Run your own cuts.
- AI-agent-first: point your AI (Claude, Claude Code, Codex, Cursor, any of them) at agents.tigzig.com and have it run the cuts you want. Just shoot your questions... they know what to do.
US Inflation Note - 6-Slide Deck
Browse the slides or download the PDF
Full Deck Content (Text Format)
Text below was extracted from the source HTML the PDF was rendered from. The 6 slide images above are the visual.
Slide 1 - There is no modern playbook for this
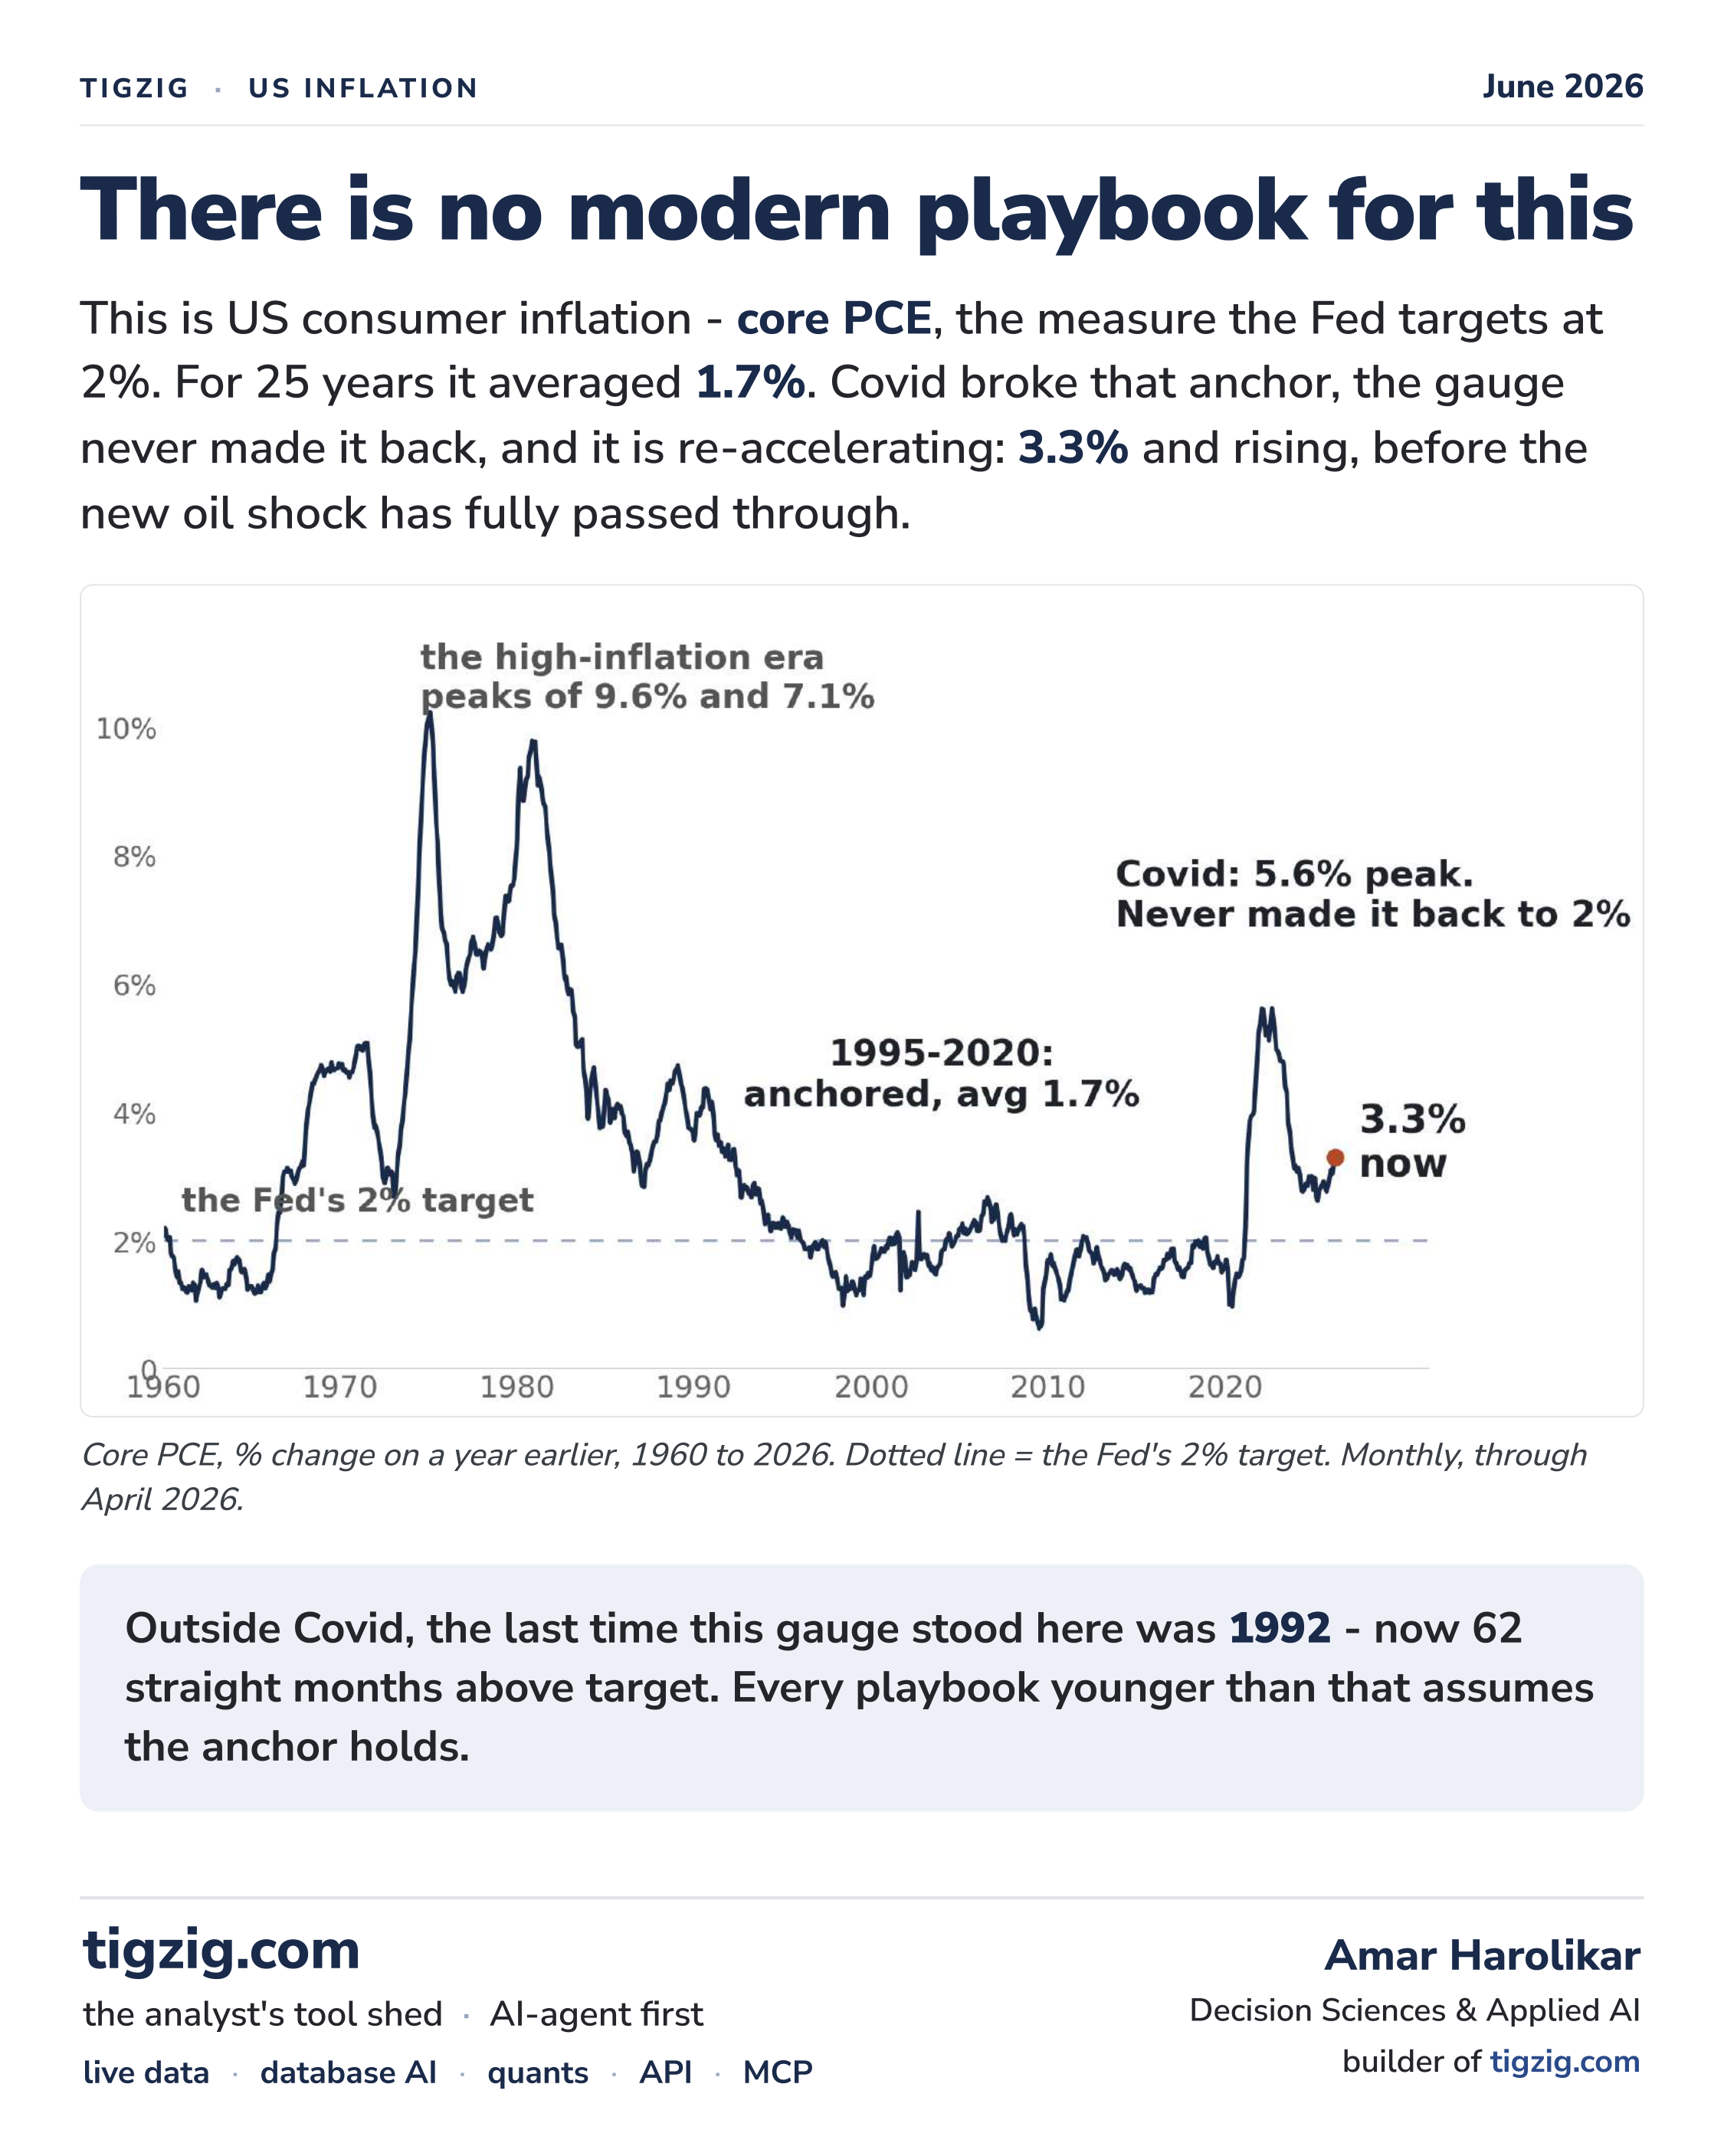
This is US consumer inflation - core PCE, the measure the Fed targets at 2%. For 25 years it averaged 1.7%. Covid broke that anchor, the gauge never made it back, and it is re-accelerating: 3.3% and rising, before the new oil shock has fully passed through.
Outside Covid, the last time this gauge stood here was 1992 - now 62 straight months above target. Every playbook younger than that assumes the anchor holds.
Slide 2 - Upstream, it is even hotter
Producer prices - what businesses pay before anything reaches a shelf - are rising 6.4% a year. Outside the Covid spike, that is the hottest reading in the modern series. Core PPI, with food and energy stripped out, says the same thing at 4.9%.
Wholesale inflation only partly flows downstream - but at 6.4%, even partial pass-through keeps the consumer number rising. The pressure is upstream of the shelf.
Slide 3 - Somebody has to pay
The bill is always shared - some passes to the shelf, some stays on the producer's books. Right now producer prices are running 2.2 points ahead of consumer prices, so the bigger share sits with the producer: margin compression.
Either margins give, or prices do. Both roads lead through the consumer.
Slide 4 - The consumer is already stretched
Whatever does get passed on hits a household with little slack left. Gasoline at $4.65 - only June and July 2022 were ever higher. And 3.4% of consumer debt is already in that 90+ bucket, past the 3.1% mark of late 2007 and more than double the end-2022 low.
A squeezed paycheck resolves two ways: spend less, which feeds back into growth, or miss payments. The lower line says the second is already happening - rising in 12 of the last 13 quarters.
Slide 5 - Priced as if none of this is happening
Against all of the above, the S&P set a record on June 2. Valuations sit near their highest in 145 years - only the dot-com peak ran higher - while consumer sentiment is at its lowest in 73 years of data, and a handful of AI names do most of the lifting.
The last two times the market was priced like this while the economy cracked underneath - 2000 and 2007 - the index halved. Both are on the chart.
Slide 6 - Previous analysis, sources & method
Previous analysis - this series
- Markets at a record while the economy hurts - peak valuations, record-low consumer sentiment. 8 Jun 2026.
- Three red flags hit together - 30Y at 5.14%, PPI heating, Brent above $100. 20 May 2026.
- Are we headed for stagflation-lite? - the Fed caught between inflation and weak jobs. 28 Mar 2026.
The data tools
- PPI, core PCE, gasoline, the S&P and the NY Fed consumer-credit series are live on tigzig.com → Tremor - a macro early-warning dashboard, 100+ indicators.
- Agent-first portal with MCP servers and free APIs: agents.tigzig.com - point your AI at it.
Sources & method
- Series: core PCE
PCEPILFE· PPI Final DemandPPIFIS· core PPIPPIFES· CPICPIAUCSL· gasolineAPU000074714· NY Fed 90+ DPD stock · S&P 500 daily. YoY from seasonally adjusted indexes; pulled 11 June 2026. - Core PCE was last at or above today's 3.3% (outside Covid) in April 1992; above the 2% target every month since March 2021; 1995-2020 average 1.7%.
- The PPI Final Demand series begins in 2010 and does not cover the 1970s-80s; the Covid window excluded is 2021-2023. Gasoline is in nominal dollars. PPI and CPI baskets differ; pass-through is partial and lagged.
- Valuation (Shiller CAPE, 2nd-highest in 145 years) and sentiment (Michigan, lowest in 73 years) figures are from the 8 June note above. S&P drawdowns: dot-com -49% (Oct 2002), GFC -57% (Mar 2009), record 7,610 on 2 Jun 2026.