Claude Dashboards With tigzig.com Data: Ask in Plain Words, Get the Dashboard
Published: November 17, 2026
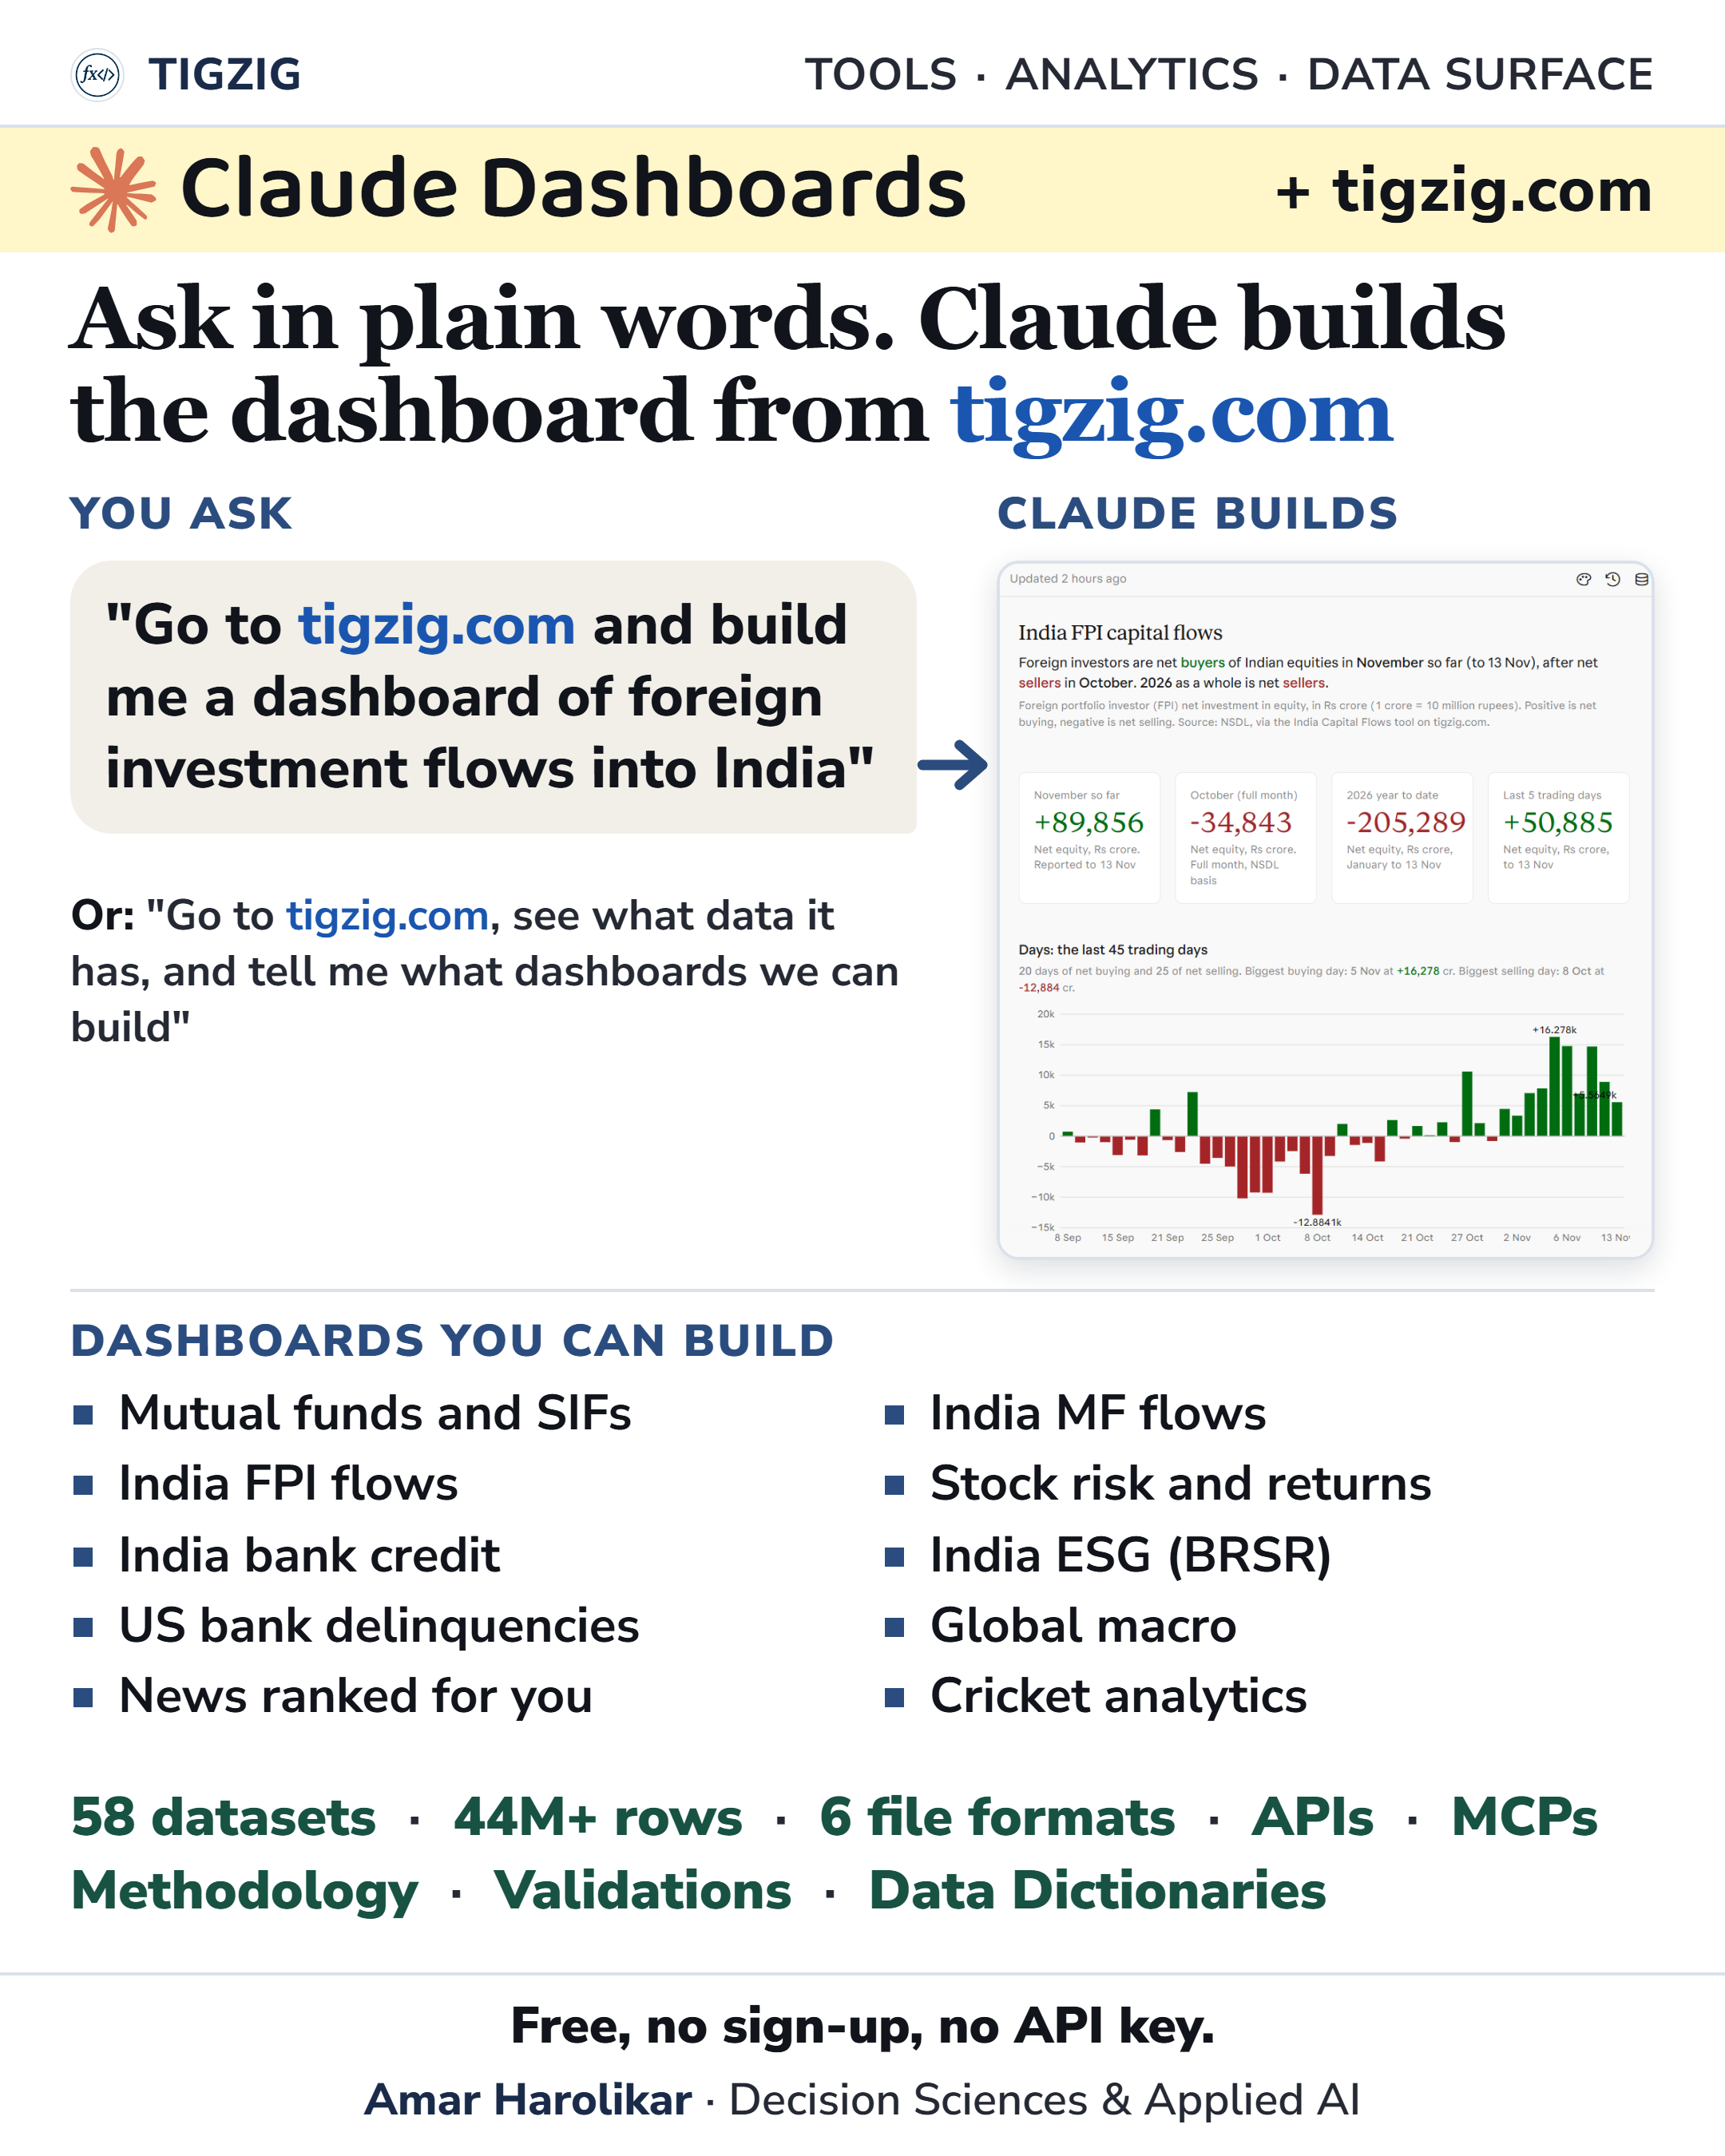
A Claude dashboard is not a fixed template. You can turn it into a data story around the angle you want to pursue. It can work from files and APIs on public sites like tigzig.com or FRED, all the way up to a company's own data through connectors, where a data team can certify the queries everyone uses.
Anthropic made Claude Dashboards generally available last week, under a new name, Claude Data.
The data on tigzig.com covers Indian mutual funds and SIFs, foreign investor flows, India bank credit, US bank delinquencies, India ESG filings, global macro, news and cricket. It comes as files in CSV and Parquet, and there are APIs and MCP servers too.
Two prompts to start with:
"Go to tigzig.com and build me a dashboard of foreign investment flows into India"
"Go to tigzig.com, see what data it has, and tell me what dashboards we can build"
All the datasets
API and MCP docs
A few quick points below.
A few quick points
▸ Tell Claude the angle up front: the period, the comparison, and what you want to see first. You can change it later in chat.
▸ The datasets come with methodology, column guides and validation notes. Point Claude at them so it reads the data the right way.
Working on something similar? How I work covers the rates, the availability and what I take on.