US Household Debt Delinquency: Mortgages Are Starting to Crack
Published: November 15, 2026
Households added more to their home equity lines in Q3 than in any quarter since 2005, at the same time as more of their mortgages are going bad. About 62,000 people had a new foreclosure on their credit report, the most since early 2020. Home equity balances rose $22.5B in the quarter.
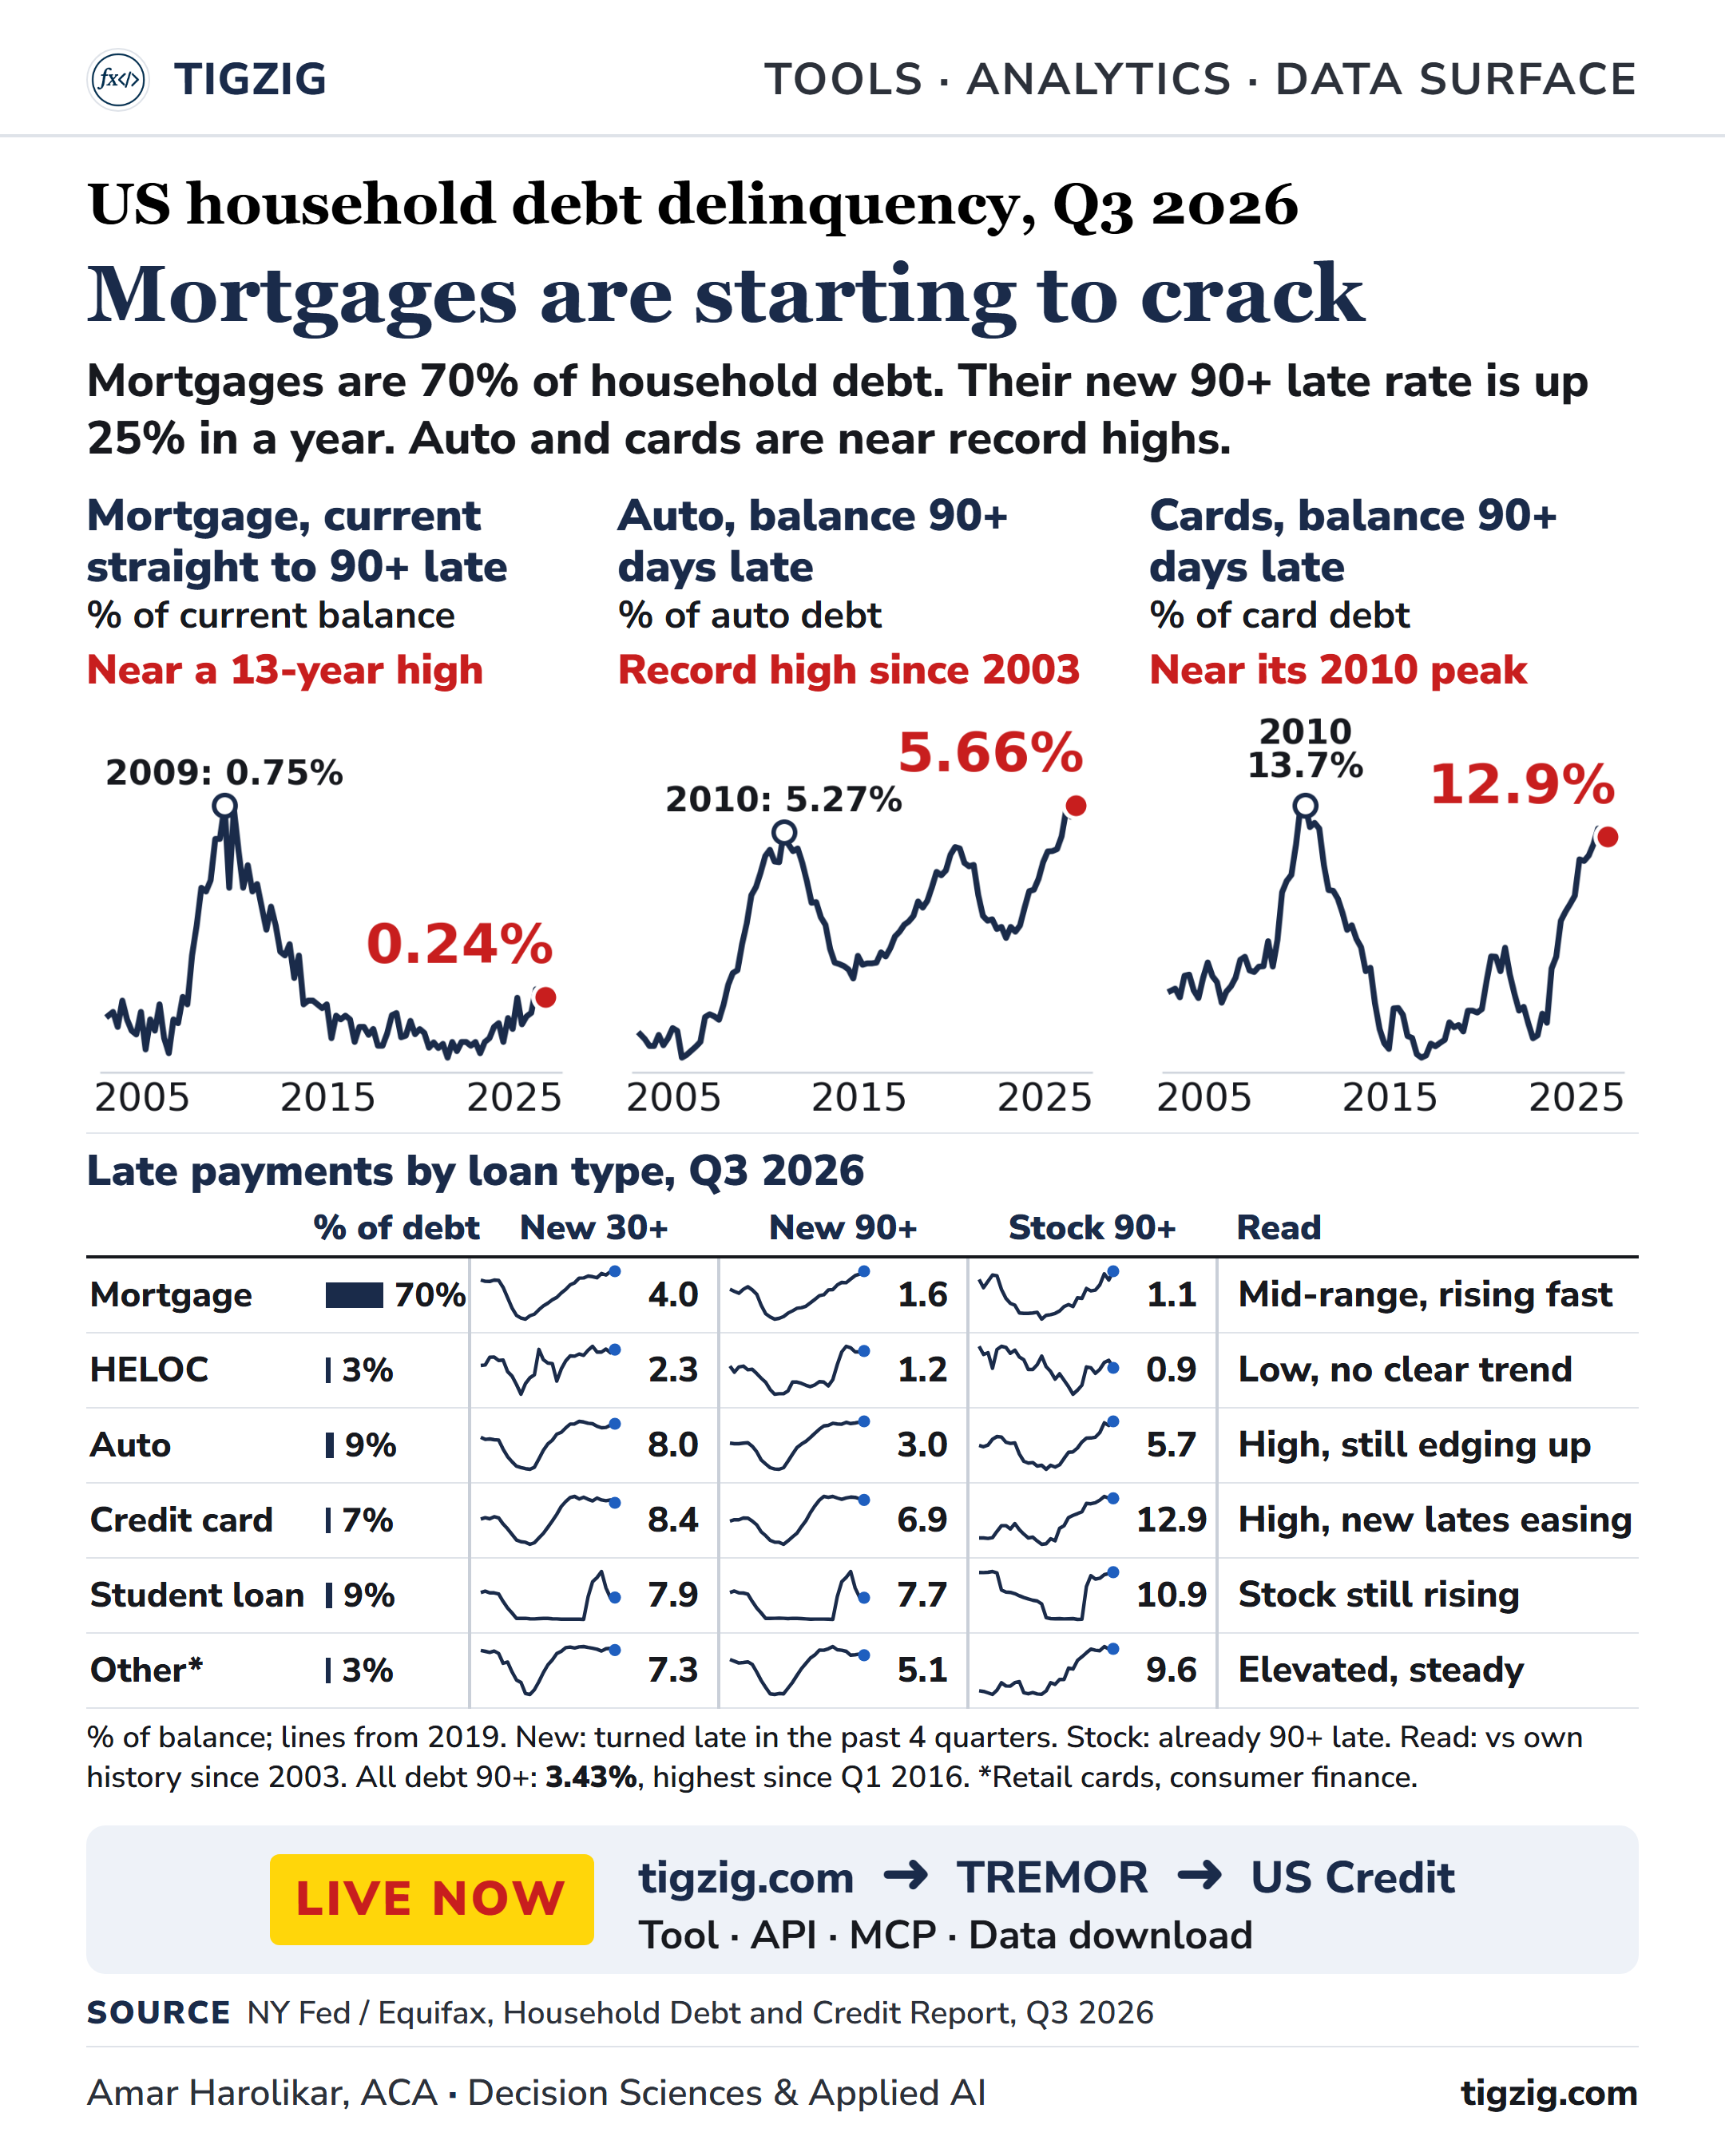
The mortgage number to watch is the straight-through rate. It counts balances that go from current to 90 days late in a single quarter, which means missing three payments in a row. It reached 0.26% in Q1, the highest since 2013, and is 0.24% in Q3. That is still about a third of its 2009 peak, so this is an early sign. The share of mortgage debt 90+ days late is 1.13%, close to its 2003-06 average of 1.03%, so the concern is the direction. But mortgages are 70% of what households owe.
Auto and cards were already stretched. The share of auto debt 90+ days late is the highest since the series began in 2003. Cards are close to their 2010 peak, and card balances are up 67% since early 2021, from $770B to $1,285B. New card lates are a little below a year ago, but the 90+ share is still up half a point on the year.
For you, live tool:
tigzig.com ➜ TREMOR ➜ US Credit
For your AI agent:
"Pull the NY Fed household debt delinquency data from tigzig.com and help me analyze it"
A few data points
▸ The all-debt 90+ rate of 3.43% is from the NY Fed's Page 11 table. Its Page 12 "ALL" cell reads 3.26% for the same measure. The six loan-type rates, weighted by balance, also give 3.43%, and since 2003 the two have agreed within about 0.03 points. The Q3 cell looks like an error in the file. The tool shows it as filed and flags it.
▸ The NY Fed's 90+ counts more than a bank's 90+ does. It includes severely derogatory debt: charged off, repossessed or foreclosed, and still being reported by the lender. In bank data, a loan leaves the 90+ count once the bank charges it off. For all household debt, severely derogatory is about 60% of the 90+ share. It stays on the borrower's credit file as unpaid, so it is still a strain.
▸ Mortgage balances rose $257B in the quarter. The NY Fed says about half of that came from balances that went missing from Q2 reporting and came back. The year-on-year change of $302B is the cleaner read. The same gap may have moved the Q2 and Q3 mortgage delinquency rates too, but the new 90+ rate was rising before it.
▸ "New" 30+ and 90+ rates are the NY Fed's four-quarter sums: the share of balances that turned late over the past year.
Earlier analysis
▸ NY Fed Q2 2026 household debt, 21 Aug. The headline flow fell, but mortgage and auto went the other way. Mortgage was back around its 2005-06 range on new 90+ lates.
tigzig.com/post/nyfed-household-debt-q2-2026
▸ All five US credit datasets on TREMOR, as of the Q2 2026 update, 26 Sep. Banks, credit unions, households, insurers and bank loans to non-banks, with methodology and validations for each.
tigzig.com/post/us-credit-data-q2-2026-tremor-sep2026
▸ Credit union Q2 2026, 19 Sep. Losses above the pre-crisis level, and 60+ day delinquency above pre-COVID in every segment.
tigzig.com/post/credit-union-q2-2026-losses-delinquency-sep2026
Working on something similar? How I work covers the rates, the availability and what I take on.