Credit Union Q2 2026: Losses Above Pre-Crisis, and Delinquency Above Pre-COVID in Every Segment
Published: September 19, 2026
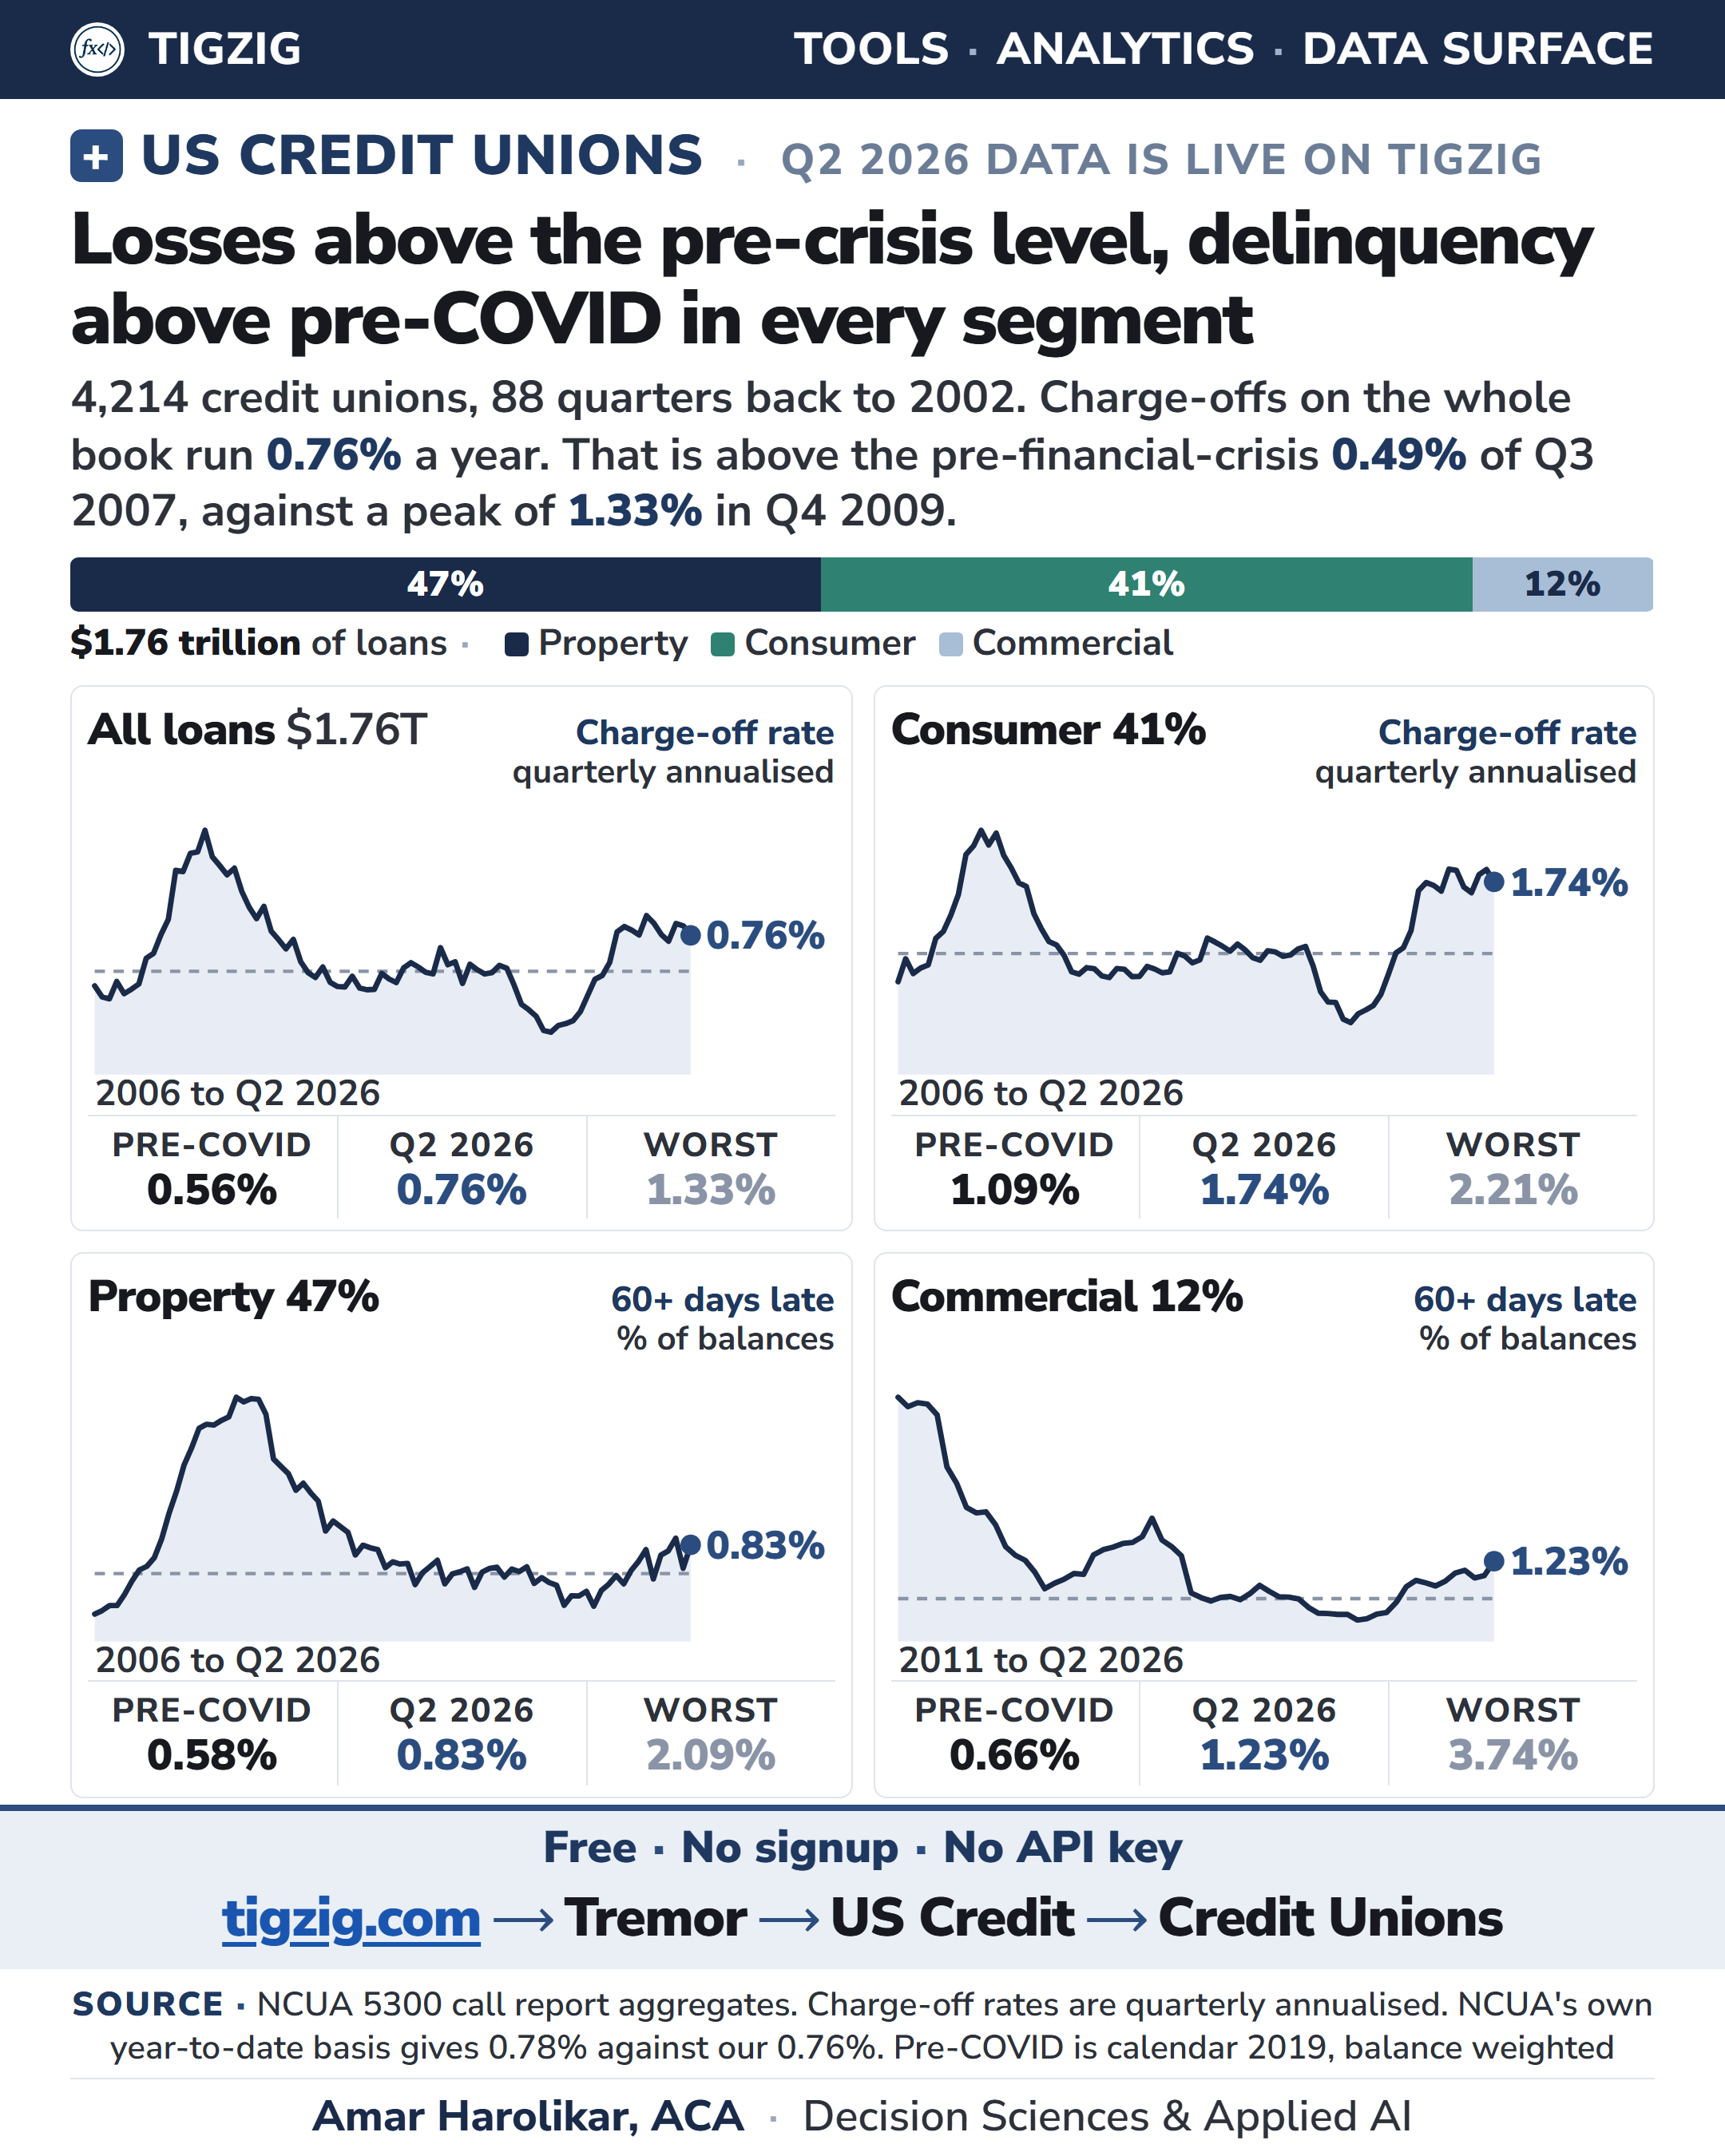
US credit union data for Q2 2026 is live on Tigzig's TREMOR app. Losses and delinquencies remain elevated and under pressure, pretty much across the board.
Losses are above the pre-crisis level, and 60 plus day delinquency is above where it sat before COVID in every segment of the book.
NCUA published it on 14 September, and it is now on the interactive tool and downloadable as a data file.
Charge-offs across all lending
Charge-offs across all lending are 0.76 percent, for-the-quarter annualised. That compares with 0.49 percent in Q3 2007, the last quarter before the rate began climbing into the crisis, and with a peak of 1.33 percent in Q4 2009. Before COVID it sat at 0.56 percent.
NCUA's own release says 0.78 percent, which is year-to-date annualised. For analysis I prefer the for-the-quarter annualised basis. The trailing twelve month basis is on the app as well, both at overall and at segment level.
Where it is coming from
The consumer book is doing most of it. Consumer is 41 percent of the loan book, two thirds of that is auto, and the charge-off rate there is 1.74 percent against 1.09 percent before COVID and a 2.21 percent crisis peak.
Property is interesting for a different reason. Sixty plus day delinquency has gone from 0.58 percent to 0.83, while charge-offs have not moved at all and are still 0.02 percent. I have not had a chance to dig into it, so I do not have an explanation as of now.
Commercial shows the widest gap of the four segments, 1.23 percent 60 plus DPD in Q2 2026 against 0.66 percent before COVID.
The tool is at tigzig.com/tremor, then US Credit, then Credit Unions.
The book is growing and changing shape at the same time
- Total loans are 1.76 trillion dollars, up 4.9 percent over the year.
- Property is doing the growing, up 8 percent in a year and 59 percent over five.
- Commercial is up 10 percent in a year and has nearly doubled over five, 99 percent, off a small base. Consumer is up 0.4 percent.
- Since June 2019 consumer has gone from 49.8 percent of the book to 41.1, and auto inside it from 34.7 percent to 27.5. Property has gone from 43.2 to 47.4 and commercial from 7.1 to 11.4.
- Auto has shrunk in dollars. It was 498 billion in June 2023 and it is 485 billion now, down 2 percent over three years, while property grew 22 percent and commercial 36 over the same three.
So the tightening is already happening on the consumer side.
How these are measured
- Pre-crisis is Q3 2007. I use that quarter because that is typically where loss rates across the banking system had started to climb and had gone beyond earlier averages.
- Pre-COVID is calendar 2019, and is balance weighted.
- Delinquency here is 60 plus days past due as a share of balances.
Working on something similar? How I work covers the rates, the availability and what I take on.