All Five US Credit Datasets on TREMOR Now Run to Q2 2026
Published: September 26, 2026
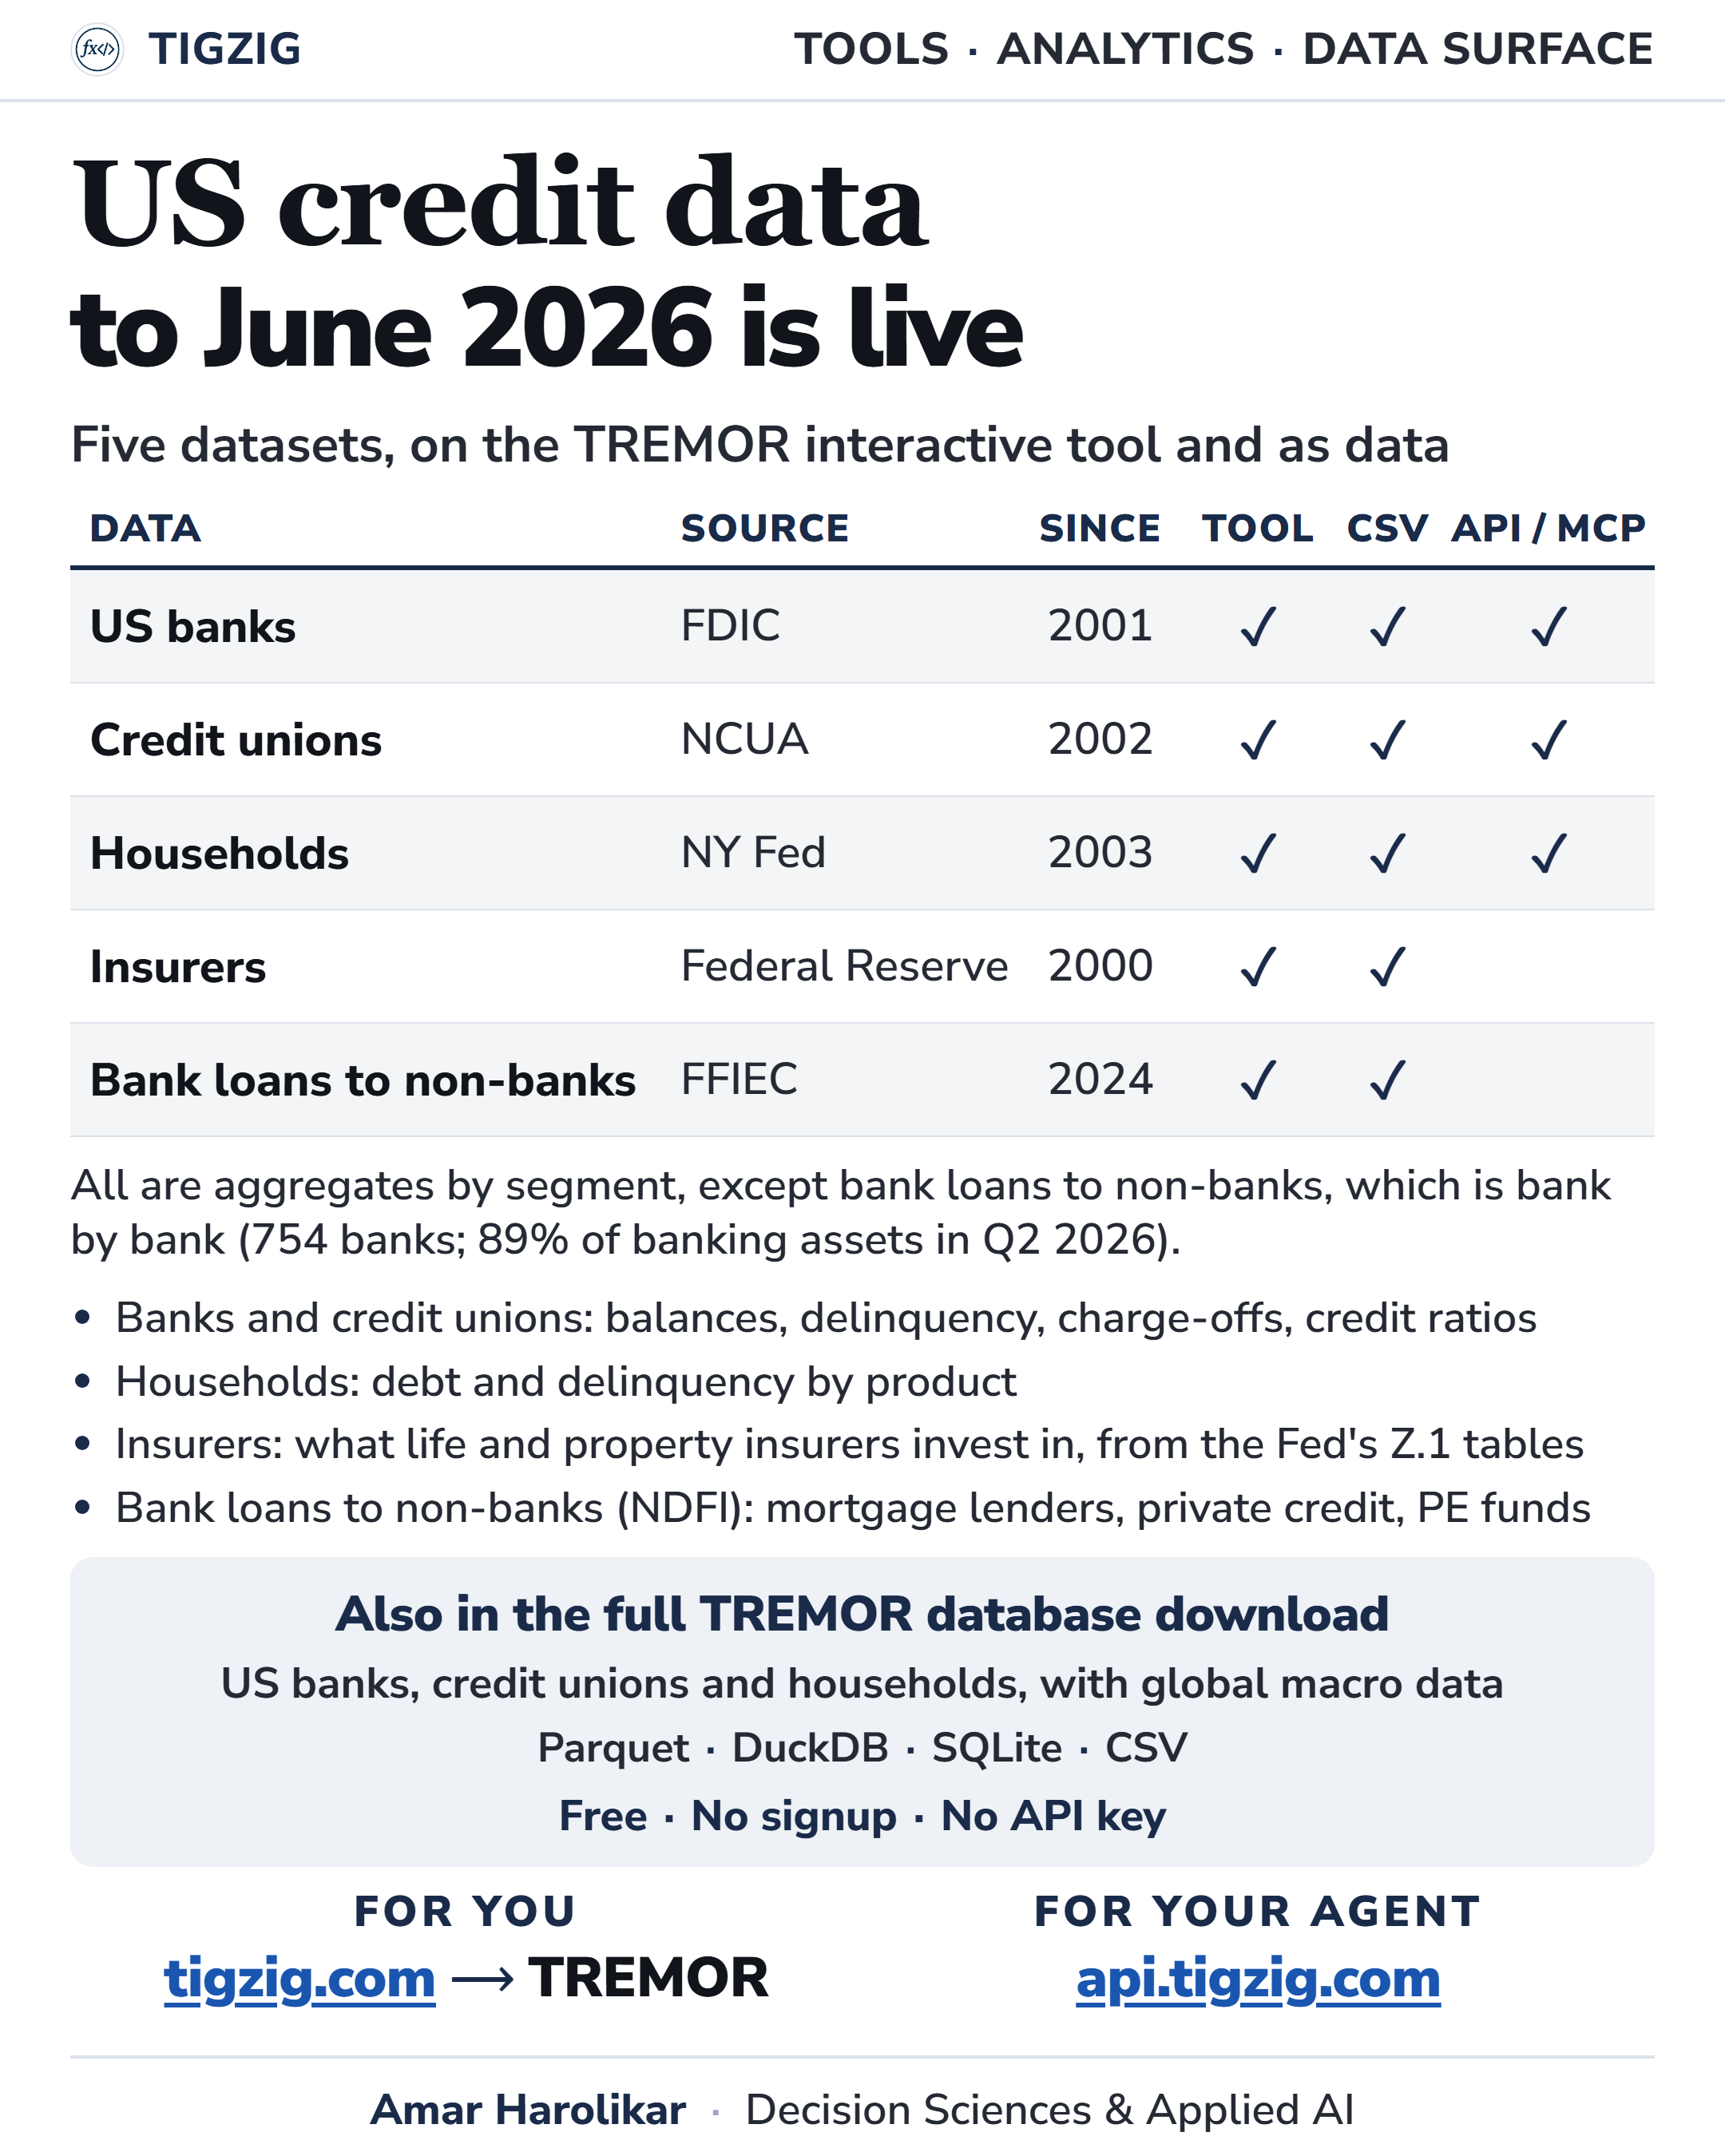
All five US credit datasets on TREMOR now run to Q2 2026, with up to 106 quarters of history - covers US banks, credit unions, household debt, insurers' investments and bank loans to non-banks. You can run your own cuts on the interactive tool, or take the data out, as CSV or through the API and MCP for your AI agent.
Tool
Time series for every segment, in tree format.
Outstanding balance, % share of total loans, then the delinquency and charge-off rates.
Cross-section: for one quarter or compare up to four quarters side by side.
Delinquency is on each source's own basis. Banks show noncurrent, 90+ and 30+ days, households show 90+ including severely derogatory plus the flow rates, and credit unions show 60+ and 30-59 days.
Data
Each dataset has a methodology section on how it is built, and a validations section that reconciles it against the published source and calls out data anomalies.
Downloads
Every dataset as CSV from the tool. Banks, credit unions and households are also in the full TREMOR database download, and on the API and MCP.
Links
Tool: tigzig.com/tremor - US-NDFI / US-Credit / US-Insurance
Analyses: tigzig.com/analysis
For your AI agent: api.tigzig.com
How the data is built
Covered in detail in the Validations & Methodologies section. Some quick points below.
Banks. The FDIC Call Report data is pulled bank by bank from the FDIC's API and added up to industry totals. The rates are computed from the filed amounts. 30+ is 30-89 days plus 90+ plus nonaccrual, over balance. Noncurrent, FDIC's own headline measure, is 90+ plus nonaccrual. Charge-offs are filed year to date, so the quarter is this quarter's figure minus last quarter's, then annualised. The totals are reconciled against FDIC's Quarterly Banking Profile.
Households. These come from the NY Fed's quarterly Excel, with the rates as the NY Fed publishes them. The 90+ stock includes severely derogatory, meaning balances already charged off that still sit on the credit file. Cross-checked against the NY Fed's own narrative report with zero mismatches.
Credit unions. These are read from NCUA's quarterly Excel reports, with the same year-to-date conversion on charge-offs. Over the years NCUA changed account codes, moved loans between categories, and in a few places filed a year-to-date figure lower than the quarter before. I publish what NCUA filed and explain each of these on the validation page.
My Q2 2026 notes on this data
FDIC banks. Charge-offs are down to 0.56 percent from a 0.70 percent peak, and lending to other financial firms is now 18.6 percent of all bank loans. FDIC Q2 2026 bank credit
NY Fed households. The headline 90+ flow came down to 2.57 percent, but mortgage and auto went the other way. NY Fed household debt, Q2 2026
Credit unions. Charge-offs are 0.76 percent, above the pre-crisis level, and 60+ day delinquency is above pre-COVID in every segment. Credit unions, Q2 2026
Bank loans to non-banks. US banks had 2.8 trillion dollars committed at the end of Q2, and 1.7 trillion of it was already drawn. Bank loans to non-banks, Q2 2026
Working on something similar? How I work covers the rates, the availability and what I take on.