US Banks Had $2.8 Trillion Committed to Non-Bank Lenders at the End of Q2 2026, and $1.7 Trillion of It Was Already Drawn.
Published: August 30, 2026
US banks had 2.8 trillion dollars committed to non-bank lenders at the end of Q2 2026, and 1.7 trillion of that was already drawn, totalling 14.3% of their loan book. Fitch reports a private credit default rate of 6.1% for the twelve months to July 2026, which its own release describes as remaining at a record high.
The drawn amount is 14.3 percent of these banks' own loans, up from 11.1 percent seven quarters ago, and it has gone up in every single quarter since banks first had to report it separately in Q4 2024.
I have put the Q2 2026 numbers up on Tremor, bank by bank. 754 banks named across the seven quarters, 633 of them reporting in the latest one, with drawn balances, undrawn commitments, the five lending categories, capital ratios, and the nonaccrual and past due amounts. 37 fields per bank per quarter.
Source is the FFIEC Call Reports.
You can use the tool in the browser or download the whole thing as a CSV, both free.
tigzig.com/tremor ➜ US NDFI
A small part of the bank population, and most of the money
The 633 banks reporting non-bank lending in Q2 2026 are roughly one in seven of all US banks by count, there are about 4,300 filing Call Reports, but between them they hold 88.7 percent of all US banking assets and 85.5 percent of all US bank loans.
So the banks lending to non-banks are a small part of the bank population and most of the money.
That also puts the 1.7 trillion in a wider frame. Measured against every US bank loan rather than only these banks, lending to non-banks is 12.2 percent. Measured against the loans of the banks doing the lending, it is 14.3 percent. Both are right, they are different denominators, and I use the second one in the tool because those are the banks with the exposure.
A few notes on the data, for anyone who downloads it
The five lending categories, mortgage, business credit, private equity funds, consumer credit and other, are reported only by banks with 10 billion dollars or more in assets. Smaller banks file the non-bank total without the split, which is why about 32 billion of the 1.7 trillion sits unallocated when you add the categories up.
The commitment figure is the unused portion, so drawn plus undrawn gives you the total committed and there is no double counting between the two.
Capital fields come out blank for banks that elected the Community Bank Leverage Ratio framework, because those banks do not file risk based ratios. Blank there means not reported, it does not mean zero, so do not divide by it.
On the FDIC cross-check, total assets agree on all 4,320 bank quarter records and the non-bank balance agrees on 4,319. The exception is M&T Bank in Q4 2024, where the FDIC shows about 1.4 billion more than the filing I read. I have not worked out which of the two is right.
US Banks and Non-Bank Lending, Q2 2026
Browse the slides or download the PDF
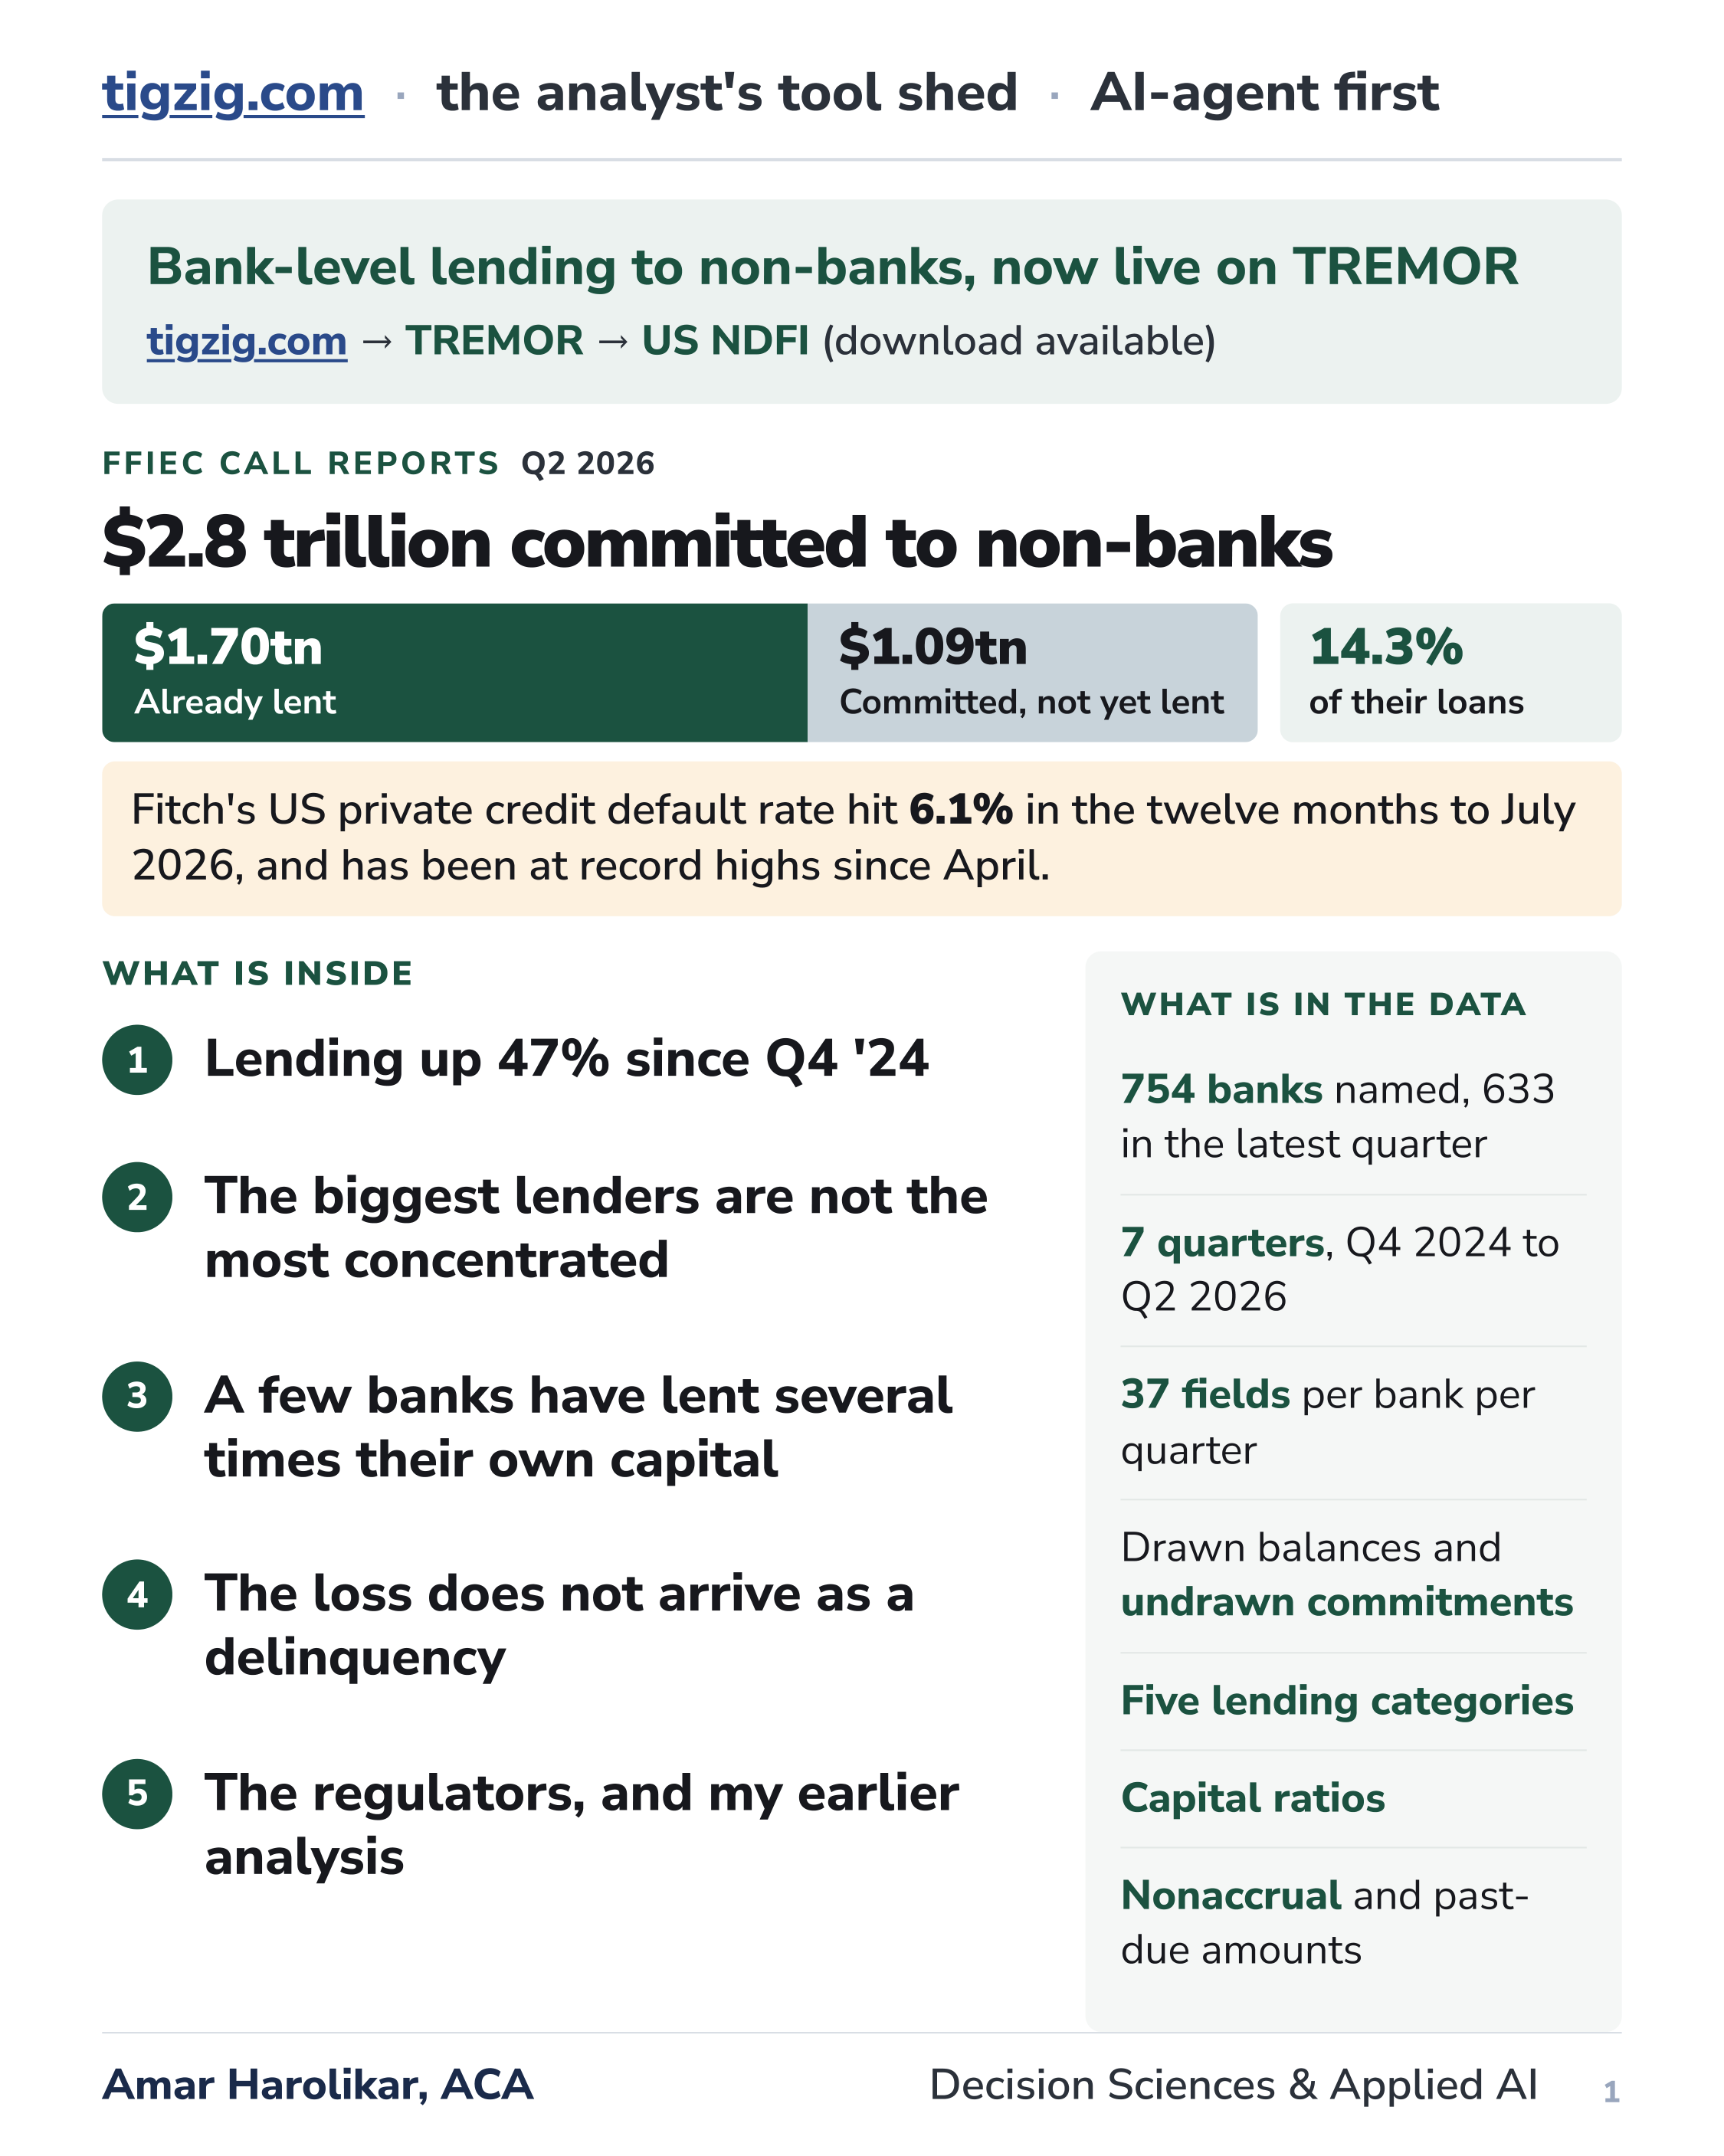
Full Deck Content (Text Format)
Text below was extracted from the source deck. Chart visuals stay in the PDF and as slide images above the post.
Slide 1
tigzig.com · the analyst's tool shed · AI-agent first
Bank-level lending to non-banks, now live on TREMOR
tigzig.com → TREMOR → US NDFI (download available)
FFIEC Call ReportsQ2 2026
$2.8 trillion committed to non-banks
$1.70tn Already lent
$1.09tn Committed, not yet lent
14.3% of their loans
Fitch's US private credit default rate hit 6.1% in the twelve months to July 2026, and has been at record highs since April.
What is inside
1
Lending up 47% since Q4 '24
2
The biggest lenders are not the most concentrated
3
A few banks have lent several times their own capital
4
The loss does not arrive as a delinquency
5
The regulators, and my earlier analysis
What is in the data
754 banks named, 633 in the latest quarter
7 quarters, Q4 2024 to Q2 2026
37 fields per bank per quarter
Drawn balances and undrawn commitments
Five lending categories
Capital ratios
Nonaccrual and past-due amounts
Amar Harolikar, ACADecision Sciences & Applied AI
1
Slide 2
tigzig.com · the analyst's tool shed · AI-agent first
The balancesQ4 2024 to Q2 2026
Seven quarters, and it has not paused
Up 47% since Q4 2024
Lending to non-banks has gone from $1,159 billion to $1,704 billion since Q4 2024, and it has risen in every single quarter.
Against these banks' own loan books it has gone from 11.1% to 14.3%. Roughly one dollar in seven that they lend now goes to another financial firm.
Q4 2024 is the start because that is the first quarter banks had to report it separately. Before that it sat inside other loan lines.
What it is lent against
Business credit is the largest single category at $446 billion. This is the line that holds bank lending to private credit funds.
Add private equity funds at $410 billion and half the book is financing the two things most people mean when they say private credit.
The $32 billion not broken out is mostly banks under $10 billion in assets, which file the total and not the split.
Amar Harolikar
2
Slide 3
tigzig.com · the analyst's tool shed · AI-agent first
FFIEC Call ReportsQ2 2026
Which banks lend most to non-banks
Dollars lent on the left, and what share of that bank's own loan book it represents on the right. The two say different things: the biggest lenders are not the most concentrated.
Read the right-hand column with that in mind. Goldman Sachs, Morgan Stanley and State Street are not primarily lenders. Loans are a third or less of their balance sheets and lean towards funds, so a high share of a small loan book is close to what you would expect. The $133 billion and the $83 billion are real, and so is the exposure.
Amar Harolikar
3
Slide 4
tigzig.com · the analyst's tool shed · AI-agent first
FFIEC Call ReportsQ2 2026
Now ranked by capital at risk
Banks that have lent $1 billion or more to non-banks, 66 of them, ranked by that lending as a share of their own core capital. The top 20 are shown.
Read it as loss absorption. A 20% loss on this book would take 16% of JPMorgan's core capital, 45% of Goldman Sachs' and more than all of Northpointe's. It does not say how concentrated a bank is: at Goldman and Morgan Stanley the loan book is a third or less of the balance sheet, at Northpointe and Axos it is almost the whole bank.
At system level it is contained. A 10% loss across the whole $1.70 trillion uses 8.6% of combined core capital. One small bank failing is contained. Several failing together is not. The Call Report names no counterparties, and nothing else published does either, so the overlap between them cannot be seen. What the FSB set out in May 2026 is the shape of it: layers of leverage stacked on one another, and a web of links between banks, funds and the same borrowers.
Amar Harolikar
4
Slide 5
tigzig.com · the analyst's tool shed · AI-agent first
The loss does not arrive as a delinquency
1
Banks left the lending. They never left the financing.
After 2008, regulators pushed banks out of risky middle-market lending. They came back as the financiers behind it: credit lines, warehouse facilities, leverage. The risk did not leave the banking system. It moved one step away from it.
2
The past-due buckets will not warn you.
These borrowers keep paying until they cannot, and many switch to paying in kind before they stop, which keeps a deteriorating loan looking current. When it does break, it usually breaks as a bankruptcy filing.
3
And the loss never shows up as a charge-off.
Most private credit losses are carried at fair value. They hit the profit and loss account directly and never pass through the delinquency or charge-off lines that everyone watches.
Fitch Ratingsthe number that moves when the bank data does not
6.1%
US private credit default rate, twelve months to July 2026. At record highs since April, across about 1,500 US private credit issuers. Published monthly. Fitch Ratings, 13 August 2026
5.2%
MCO · Model-based Credit Opinion
Fitch's own opinions on issuers, which feed the ratings on pooled assets such as middle-market CLOs. A record, up from 4.9%.
8.6%
PMR · Privately Monitored Rating
Ratings insurers need on the loans they hold, for regulatory capital. Down from 9.4%, a third straight monthly fall from a record 10.0% in March.
And look at what counts as a default. Half the default events were an interest deferral or payment in kind replacing cash interest. Another 38% were maturity extensions under stress. Only 8% were an uncured missed payment.
Amar Harolikar
5
Slide 6
tigzig.com · the analyst's tool shed · AI-agent first
Go deeperwhat the regulators are saying
The major regulators have written on this
Financial stability bodies on both sides of the Atlantic, and the international bodies, have published on private credit and on bank lending to non-banks in the past eighteen months. They do not agree on how serious it is.
Report on Vulnerabilities in Private Credit Financial Stability Board · 6 May 2026
Financial Stability Report Federal Reserve · May 2026
Financial Stability Review European Central Bank · May 2026
Global Financial Stability Report IMF · April 2026
Semiannual Risk Perspective OCC · Spring 2026
This time is different? Speech by Sarah Breeden Bank of England · April 2026
Bank lending to private credit: size, characteristics and financial stability implications Federal Reserve, FEDS Note · 23 May 2025
Could the growth of private credit pose a risk to financial system stability? Boston Fed, CPP 25-8 · 21 May 2025
Amar Harolikar
6
Slide 7
tigzig.com · the analyst's tool shed · AI-agent first
My earlier analysis on this
Published on tigzig.com
Bank loss rates look calm. The stuff underneath says otherwise 4 June 2026
Banks keep funding the non-banks. $1.65 trillion in Q1 2026, up 42% in five quarters 30 May 2026
Private credit default rate hits a record 6.0%: a market for lemons 28 May 2026
Red flag in US life insurance. $2.4 trillion in private credit and offshore reinsurance 8 May 2026
The convergence risk: credit stress already past 2007 pre-crisis 29 April 2026
NDFI Analytics: US bank exposure to non-bank lenders 31 March 2026
US banks and non-bank lending: how deep is the exposure, and is there a systemic risk 26 March 2026
Private credit: the $2.7 trillion shadow lending market is showing cracks 24 March 2026
Detailed sections, these and more
tigzig.com → TREMOR → US NDFI the bank-level data behind this deck
tigzig.com → Private Credit every analysis and live tool on this topic, in one place
Amar Harolikar
7
Slide 8
tigzig.com · the analyst's tool shed · AI-agent first
My read
Where it stands today
I am not calling this a crisis. Nonaccrual on this book is 0.13% and it fell again this quarter, though page 5 is exactly why I would not lean on that. Roughly one dollar in seven that these banks lend now goes to another financial firm, and that share has risen in every quarter since it became separately reportable.
What the money is lent against
A large part of private credit sits with software companies and the businesses building out AI, the part of the market with a live valuation question over it. In Fitch's own data, technology software is among the largest sectors in private credit and has the lowest default rate of any of the big ones, 1.2%.
The consumer is already turning
Fitch's consumer products and services default rate went from 5.9% in July 2025 to 9.9% in July 2026. In the NY Fed and Equifax consumer credit panel, US auto loans 90 days past due sit at 5.5%, a level beaten only once in the sixty-six quarters since 2010, and credit cards at 12.9% have been higher in only six of them. Both eased a little this quarter. That 90-day measure includes balances already charged off, repossessed or foreclosed, which the NY Fed groups as severely derogatory.
Why it could spread
So it is finely balanced. If AI valuations correct, or the economy weakens enough that insolvencies pick up, the losses land first on the private credit funds and then on the banks financing them. That is where contagion risk sits, because the market is layered: a bank lends to a fund, the fund lends to a company, and there is leverage at every level. Most of the regulators on page 6 make some version of that point.
Amar Harolikar
8
Slide 9
tigzig.com · the analyst's tool shed · AI-agent first
Sources
The bank data
FFIEC Call Reports, Q2 2026, 633 banks reporting lending to non-banks. Loans to nondepository financial institutions became a separate reporting line in Q4 2024, which is why the series starts there.
FDIC BankFind API for the cross-check. Every bank in every quarter was matched on RSSD ID and compared. Total assets agree on all 4,320 bank-quarter records. The NDFI balance agrees on 4,319, the exception being M&T Bank in Q4 2024, where FDIC shows $1.4 billion more than the filing we read.
Everything else
Fitch Ratings for the private credit default rates, from the July 2026 release published on 13 August 2026.
NY Fed Household Debt and Credit Report, Q2 2026, for the auto and credit card figures.
The regulator and central bank sources are listed on page 6, and my own earlier analysis on page 7.
tigzig.com
Built by an analyst, for analysts. Track macros, compare securities, query databases. In your browser, in Excel, in Claude, or through an API.
Amar Harolikar
9
Working on something similar? How I work covers the rates, the availability and what I take on.