New Tool: India Capital Flows. FPI Flows From 2005, Sectors, Countries, Mutual Funds, FDI and Who Holds Indian Securities, With a Full Data Download
Published: November 15, 2026
In the two years to October FPIs sold Rs 6.5 lakh crore of Indian shares on the stock exchanges and bought Rs 1.8 lakh crore through IPOs and placements. NSDL reports the two routes separately every day, and the tool shows both from 2009.
What the tool covers
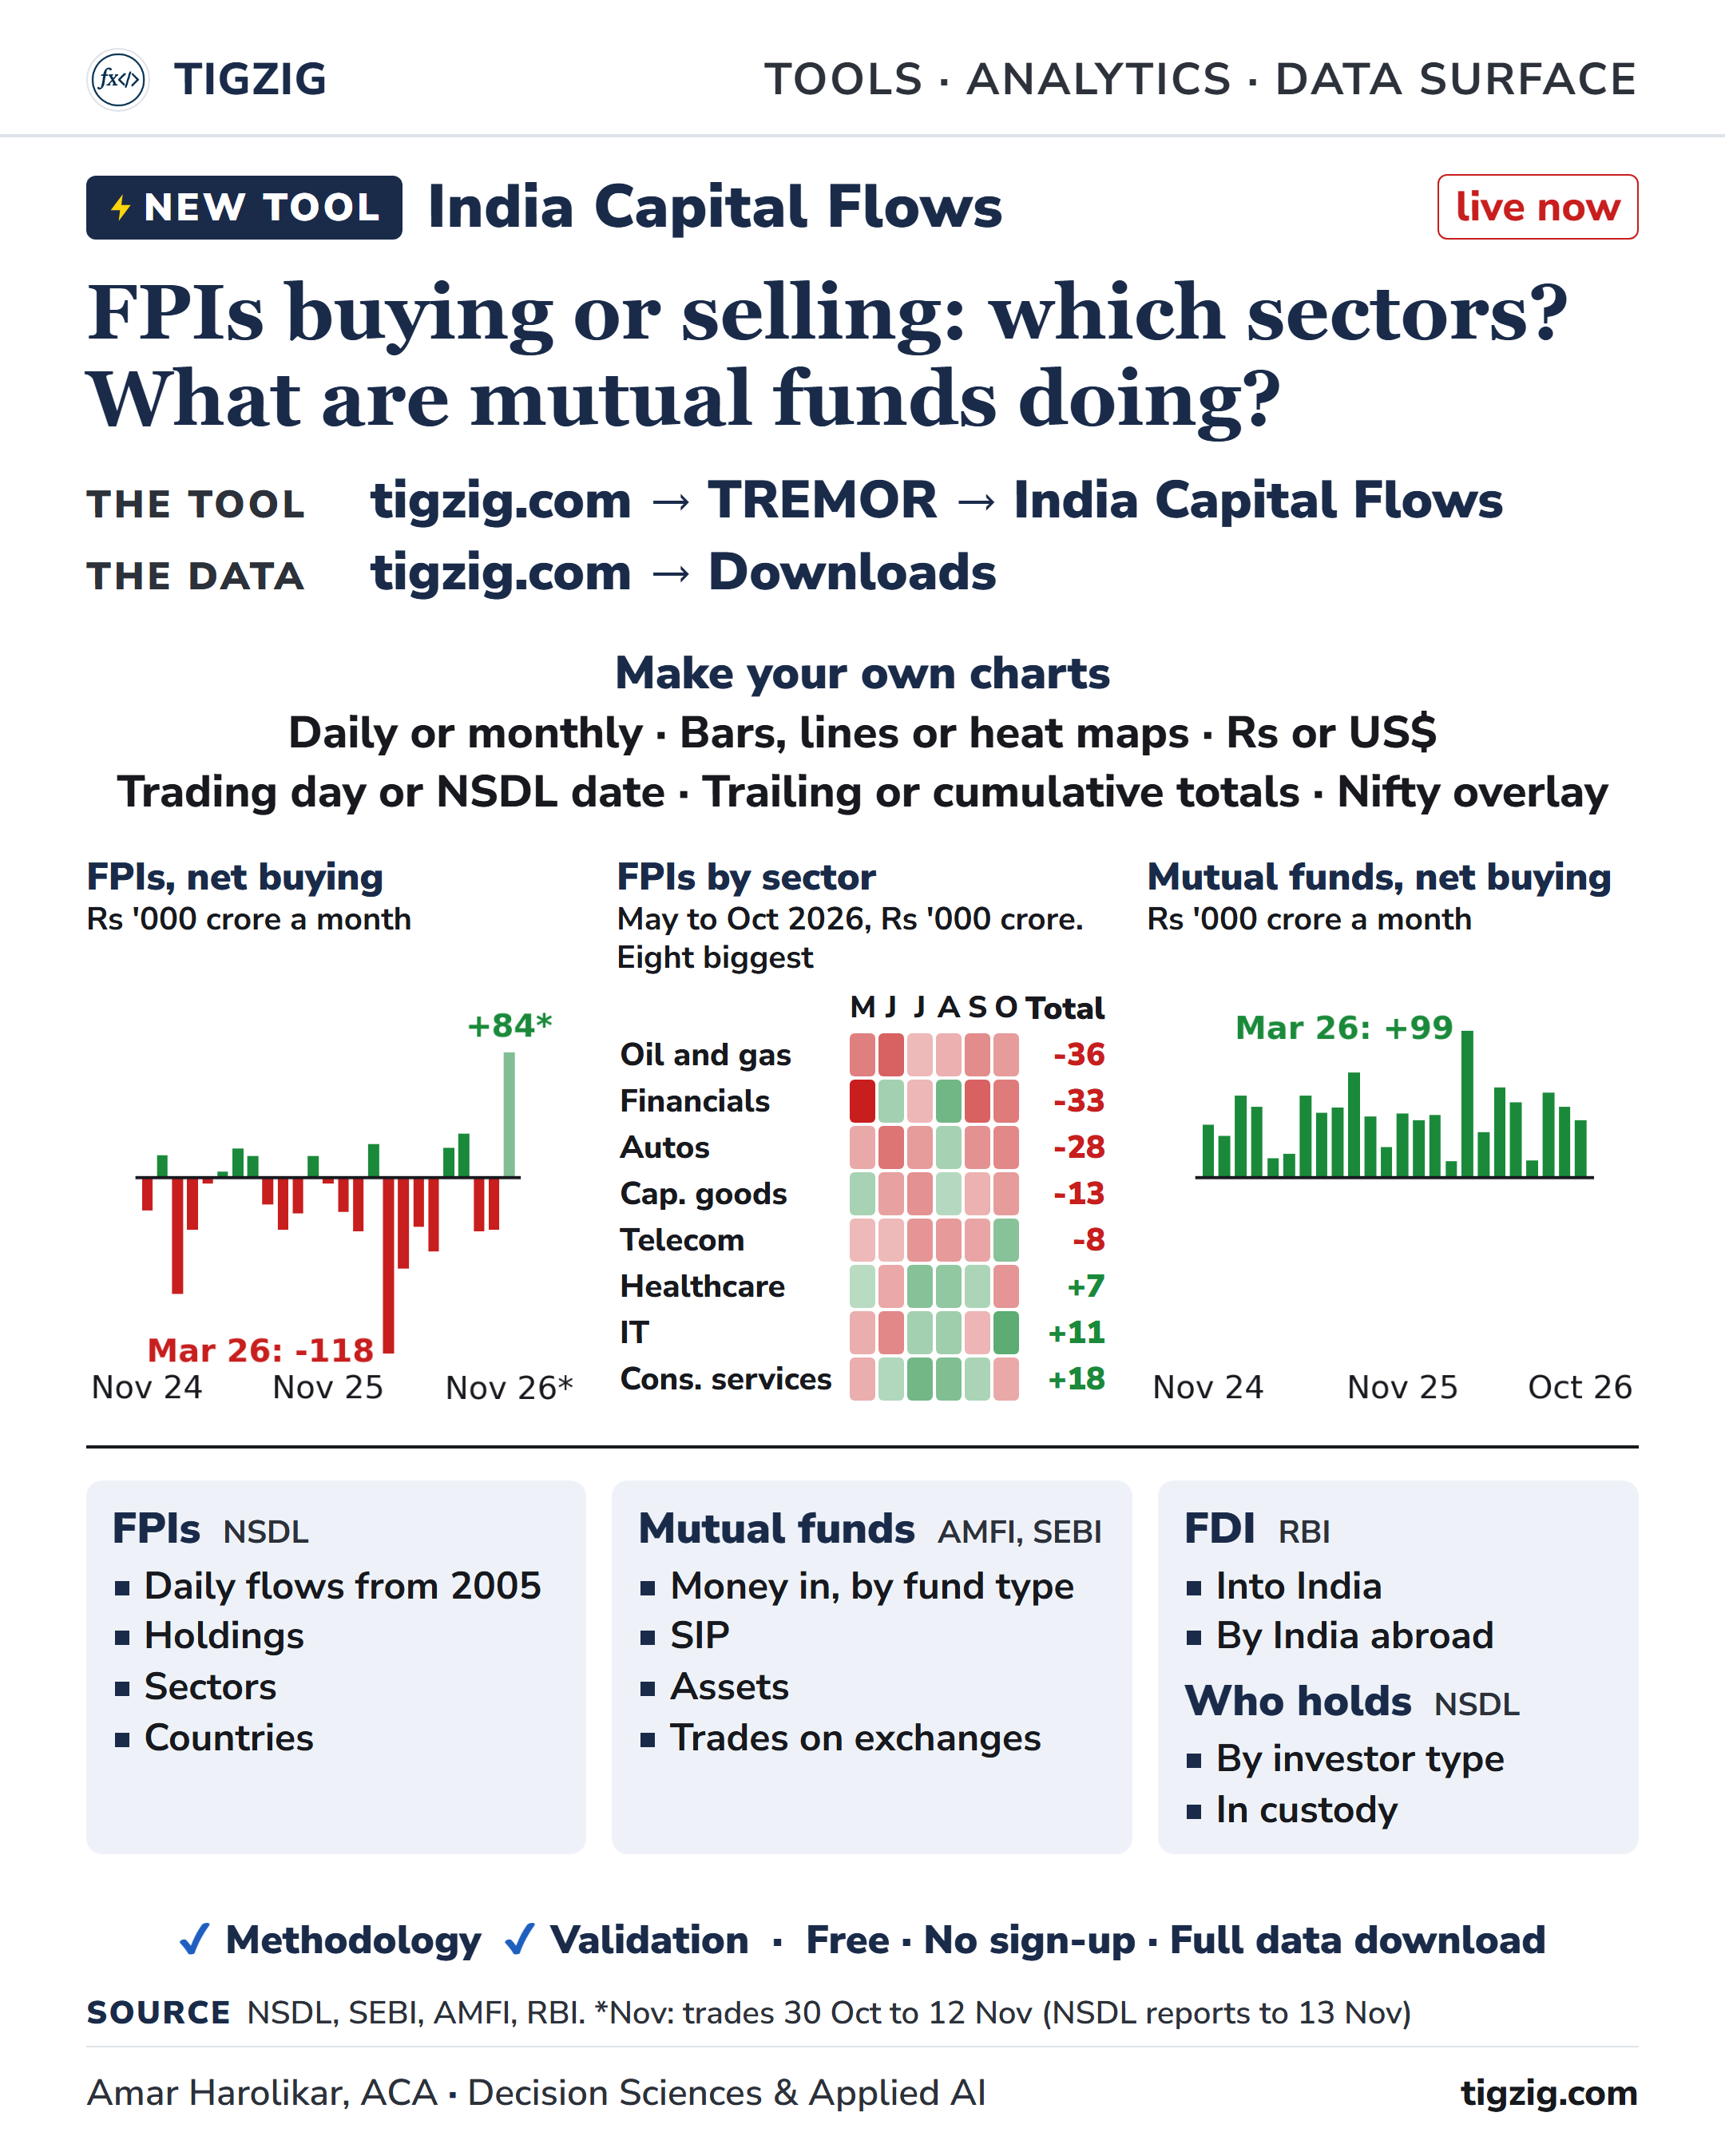
The tool puts NSDL's FPI data from 2005 in one place with mutual fund flows, FDI and who holds Indian securities with custodians. You can see whether FPIs are buying or selling and in which sectors, where the funds are registered, and how much mutual funds are buying. FPI flows can be daily or monthly, in rupees or dollars, by trading day or NSDL date, with trailing or cumulative totals.
November so far
Net of the two routes, FPIs sold Rs 4.7 lakh crore in the two years to October. In NSDL's November reports (trades to 12 Nov) they bought Rs 84,000 crore, almost all of it on the exchanges. Mutual funds bought in every one of the 24 months, Rs 10.1 lakh crore in all. In the first days of November they were net sellers (SEBI data to 4 Nov).
For you, live tool
tigzig.com ➜ Tremor ➜ India Capital Flows
Full data download, nine CSV files with a column guide
How is the data built and checked? See the Methodology and Validation tabs in the tool.
A few quick points
▸ Monthly FPI figures are NSDL's own monthly report. A toggle adds the days up by trading day instead. October 2026 is -Rs 34,843 crore as NSDL reports it and -Rs 21,153 crore by trading day.
▸ Every FPI figure here is NSDL's. NSE's daily FII figures count exchange trades only and come out the same evening, before NSDL's.
▸ Mutual fund buying is SEBI's daily data on trades by mutual funds on the exchanges, net of sales. It covers every fund type, including hybrid and arbitrage funds, index funds and ETFs. The Rs 10.1 lakh crore is the total over two years, about Rs 42,000 crore a month.
▸ NSDL publishes sector data every fortnight, about a week after it ends. It changed its sector list in April 2022, so older periods use the older list.
▸ Country is where the fund is registered, such as Mauritius, Singapore or Luxembourg. The money behind a fund can come from anywhere.
▸ FDI is RBI's monthly figure in US$, two to three months behind.
Earlier analysis
▸ Is foreign money coming back to India? 8 Nov. Foreign investors bought US$4.1bn in five days, too early to call it a trend.
tigzig.com/post/india-fpi-turn-foreign-money-coming-back-nov2026
▸ Six months of foreign selling in oil and gas, financials, autos and FMCG, 8 Nov. The last two bounces did not hold.
tigzig.com/post/india-fpi-sectors-six-months-selling-nov2026
Working on something similar? How I work covers the rates, the availability and what I take on.