Foreign Portfolio Money Is Leaving Indian Stocks: US$58.6 Billion Out Since October 2024
Published: October 19, 2026
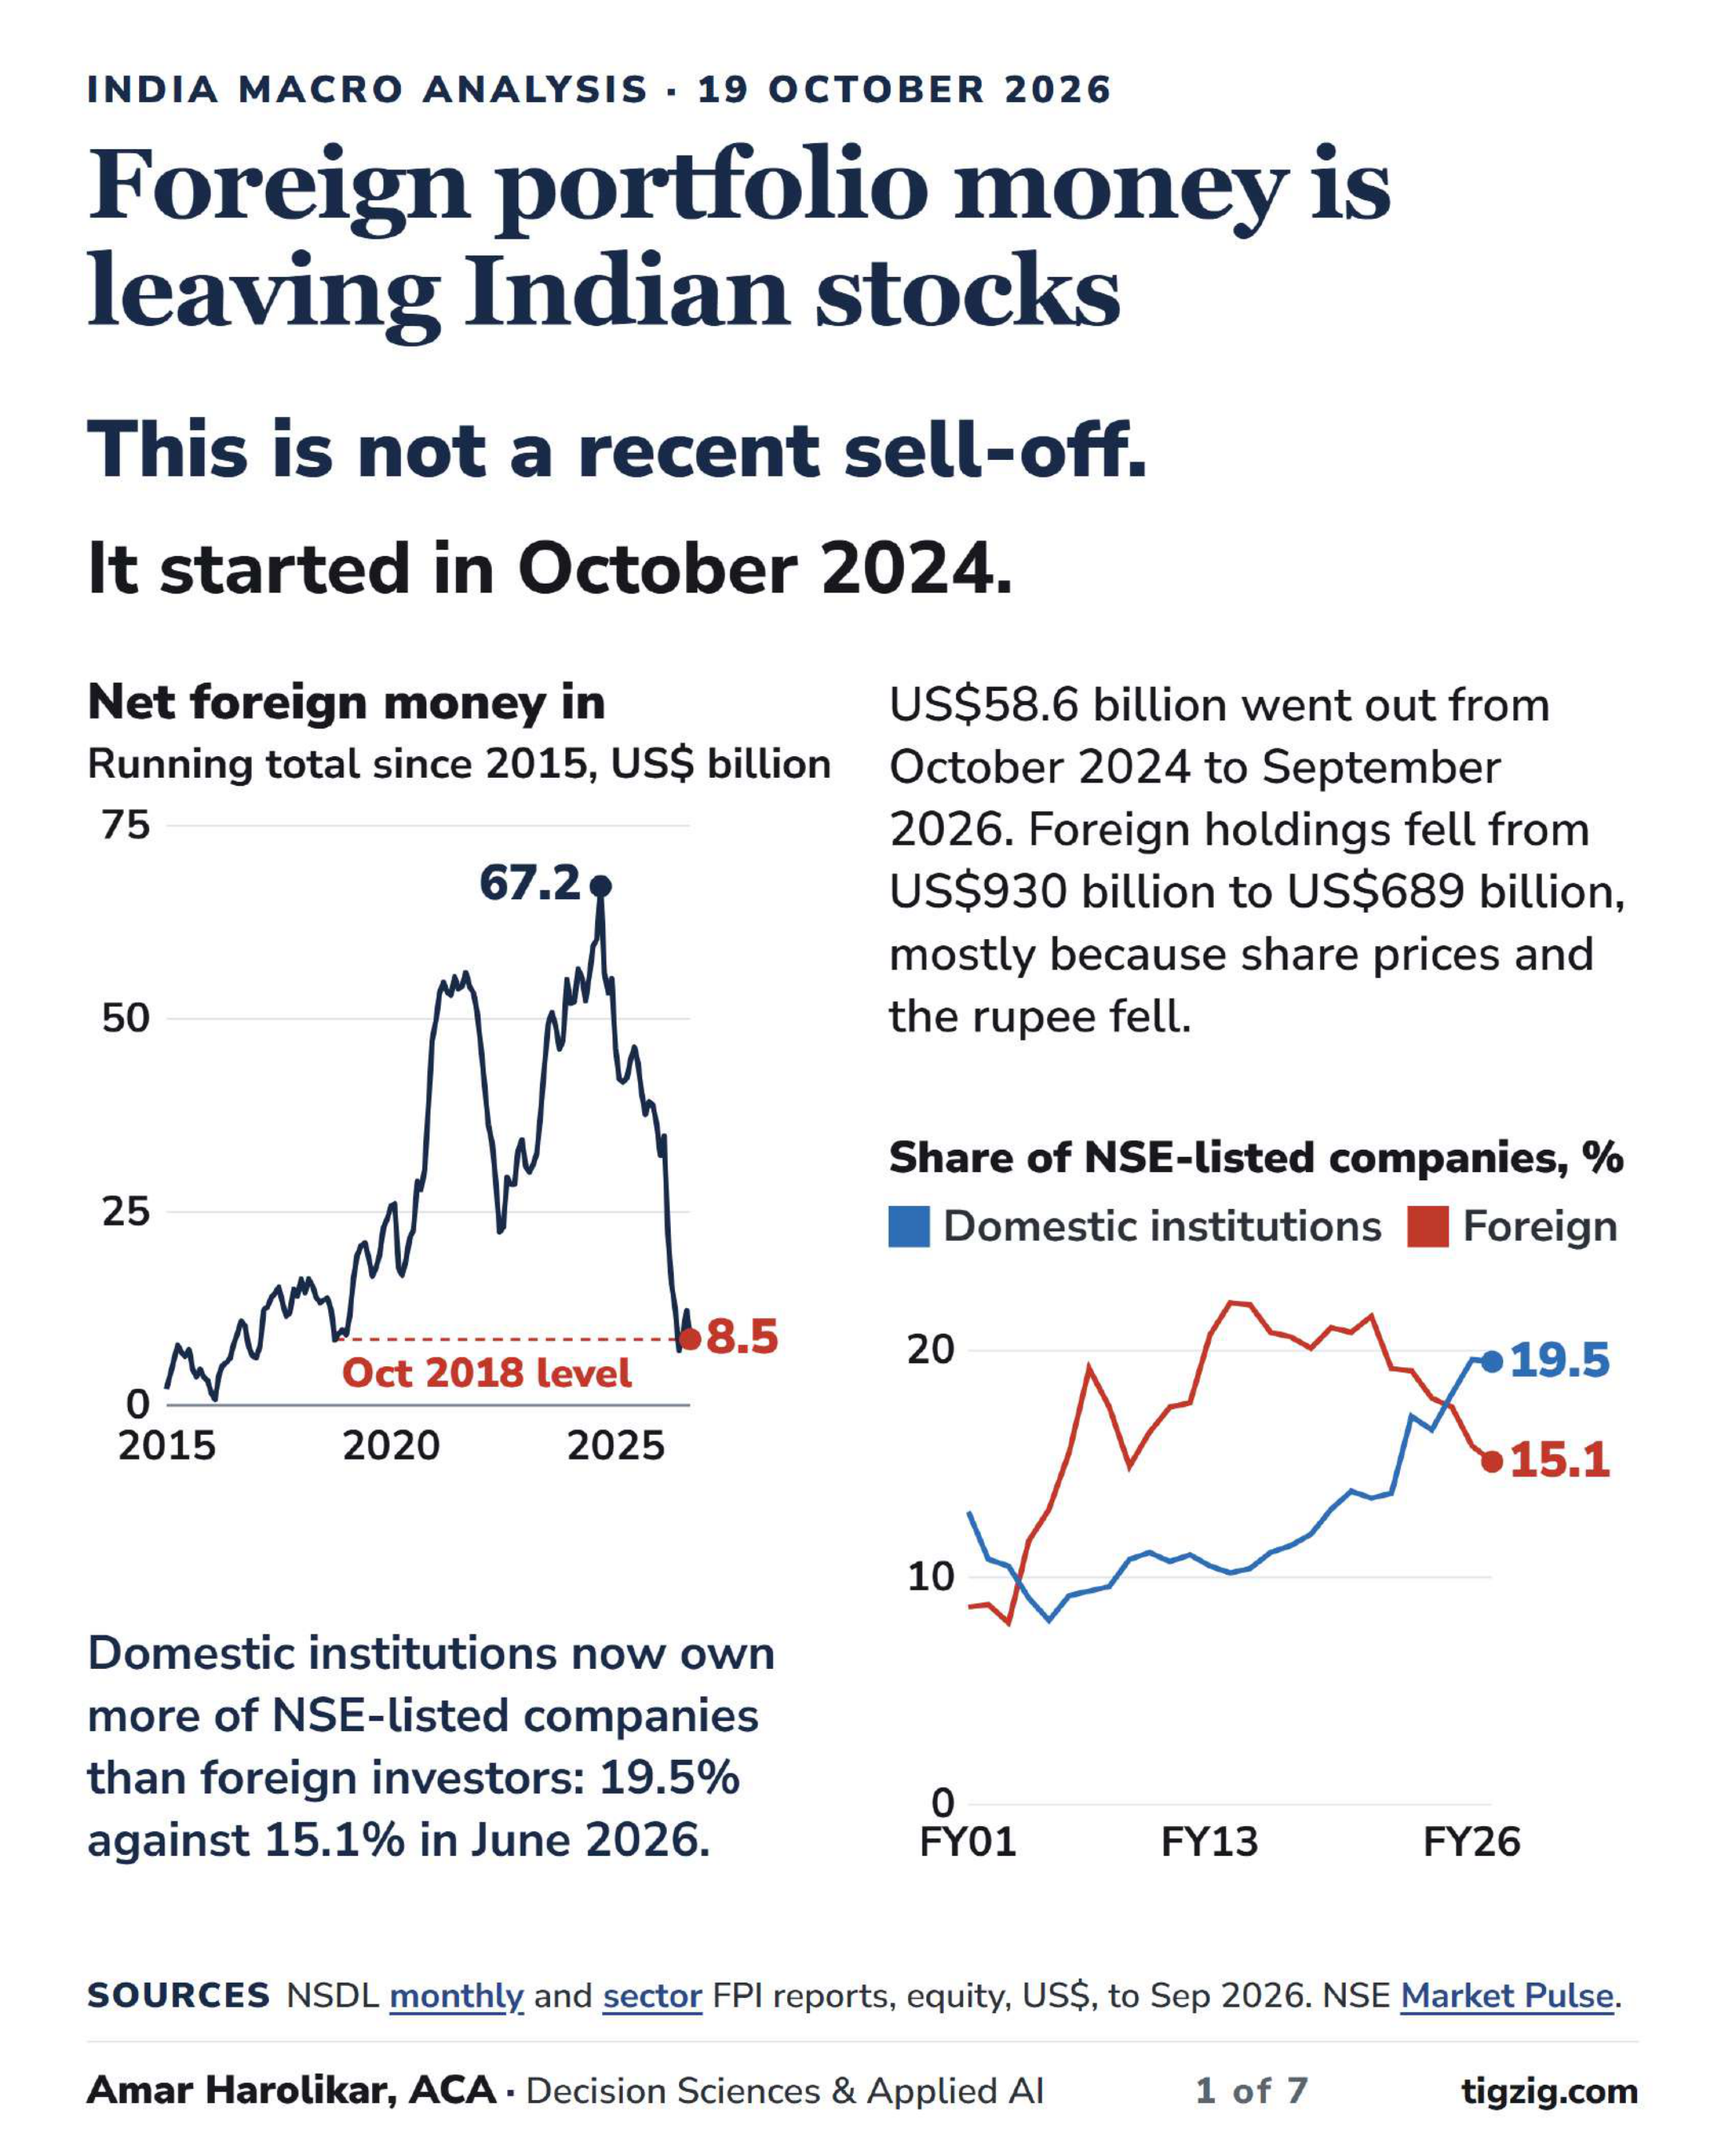
Foreign investors have taken US$58.6 billion out of Indian shares since October 2024. This is not a recent sell-off, and it is more than the US$37.0 billion they put in during the 2023-24 rally.
Their net buying since 2015 peaked at US$67.2 billion in September 2024, and most of it has now gone back out.
They still hold about US$689 billion of Indian shares, down from US$930 billion, mostly because share prices and the rupee fell.
The selling on the stock exchanges was bigger than the net figure shows. Foreign investors net sold US$79.5 billion of shares there, while putting US$20.9 billion into IPOs, placements and other primary deals.
Their share of NSE-listed companies fell from 17.7% in September 2024 to 15.1% in June 2026, the lowest in 69 quarters per NSE. Domestic institutions now own 19.5%, and have owned more than foreign investors since December 2024.
The selling was broad. Foreign investors were net sellers in 15 of 23 sector groups, and six of them made up 80% of the selling, led by financials and IT.
But, they were buying too ...biggest net buys during this period - metals and mining, services, telecom and capital goods.
Over the same period the S&P 500 is up 33% and the Nifty 50 is down 22% in dollars. This is not a case for US stocks. I believe they are in a valuation bubble, and have shared why in my earlier analysis.
They were net sellers in 16 of the 24 months, and sold another US$5.1 billion in October, reported up to the 19th Oct 2026.
The deck is below. Flows are NSDL data and ownership is from NSE's Market Pulse.
This is my analysis of public sources, for information only. Not investment advice.
A few points on the data
Foreign investors here are foreign portfolio investors (FPIs). Flows are NSDL's net investment in equity, reported by custodians, to September 2026. Dollar figures are from NSDL's own dollar report.
The running total starts in January 2015. It depends on the start year, and from January 2020 it is already below zero.
The split between the exchanges and IPOs comes from NSDL's daily report, and the sector data from its fortnightly report, both in NSDL's own US$ columns. The sector report adds up to US$58.4 billion, as it converts each fortnight at its own rate.
Ownership is NSE's Market Pulse for August 2026 (CMIE Prowess), as a share of the market value of NSE-listed companies. Domestic institutions are mutual funds, banks, insurers and other institutions.
The Nifty 50 in dollars is NSE's own Nifty50 USD index. Both changes run from 26 September 2024, the Nifty's record close at the time. The January 2026 high was in rupees only; in dollars the Nifty has stayed below its 2024 peak.
Holdings are NSDL's assets under custody for FPI equity, at market value, so they move with prices and the rupee as well as with buying and selling.
My earlier analysis on this
India was the market's darling. Not any more, 31 May. Growth forecasts were being cut and IT jobs were under pressure: tigzig.com/post/india-economy-red-flag-may2026
India's next tech wave, 24 May. AI data centres for the world, being built by Adani, Reliance, Airtel and L&T: tigzig.com/post/india-next-tech-wave-ai-data-centers-may2026
India bank credit is up 19 percent, 19 Sep. The biggest single contributor is lending to NBFCs: tigzig.com/post/india-sectoral-credit-jul2026-nbfc-sep2026
Foreign buying of US stocks hit a record, 28 Sep. US$942 billion in the 12 months to July, from US Treasury data. With August added it is now US$1.01 trillion: tigzig.com/post/foreign-buying-us-stocks-record-sep2026
IMF's warnings, 17 Oct. In the week the IMF warned about AI, bond yields and cyber attacks, AI credit came under strain: tigzig.com/post/imf-warnings-ai-credit-strain-oct2026
The bond market rout, 25 Sep. The US 10-year closed above 5% for the first time since 2007: tigzig.com/post/bond-market-rout-sep2026
A correction in AI valuations is looking more likely, 31 Aug: tigzig.com/post/ai-valuation-correction-aug2026
Other analysis at tigzig.com/analysis
Foreign portfolio money is leaving Indian stocks
Browse the slides or download the PDF
Full Deck Content (Text Format)
Text below was extracted from the source deck. Chart visuals stay in the PDF and as slide images above the post.
Slide 1
India Macro Analysis · 19 October 2026
Foreign portfolio money is leaving Indian stocks
This is not a recent sell-off.
It started in October 2024.
Net foreign money in Running total since 2015, US$ billion 0 25 50 75 2015 2020 2025 67.2 8.5 Oct 2018 level Domestic institutions now own more of NSE-listed companies than foreign investors: 19.5% against 15.1% in June 2026.
US$58.6 billion went out from October 2024 to September 2026. Foreign holdings fell from US$930 billion to US$689 billion, mostly because share prices and the rupee fell.
Share of NSE-listed companies, %
Domestic institutions Foreign 0 10 20 FY01 FY13 FY26 15.1 19.5
SourcesNSDL monthly and sector FPI reports, equity, US$, to Sep 2026. NSE Market Pulse.
Amar Harolikar, ACA · Decision Sciences & Applied AI1 of 7tigzig.com
Slide 2
TIGZIGThe turn
It turned in October 2024, and the selling has barely let up
Net foreign buying of Indian shares each month, US$ billion
Lines on top: totals for the main phases of buying or selling
- -12 -8 -4 0 +4 +8 2020 2021 2022 2023 2024 2025 2026 -12.7 -11.2 +38.3 -33.6 +37.0 -58.6
The switch was sudden. Foreign investors bought US$6.9 billion in September 2024 and sold US$11.2 billion in October, a record month at the time.
March 2026 set a new record at US$12.7 billion. April to June 2026 was the worst calendar quarter NSE has recorded, US$15.1 billion.
The buying months were short pauses. 16 of the 24 months since October 2024 were outflows. In October 2026 they sold a further US$5.1 billion, reported up to 19 October.
SourcesNSDL monthly and daily FPI reports, equity, US$. NSE Market Pulse Aug 2026.
Amar Harolikar · Decision Sciences & Applied AI2 of 7tigzig.com
Slide 3
TIGZIGMarkets
S&P 500 up 33%, Nifty 50 down 22% in dollars, since September 2024
The Nifty 50 made a new high in rupees in January 2026, still 7% below its 2024 peak in dollars, and foreign investors sold US$4.0 billion that month.
Change since 26 Sep 2024, the Nifty 50's record close then
S&P 500, US$ Nifty 50, rupees Nifty 50, US$
80 100 120 140 Sep 2024 Sep 2025 Oct 2026 +33% -12% -22%
Foreign investors bought a record US$1.01 trillion of US stocks in the 12 months to August 2026. Foreign portfolio investors took US$28.0 billion out of Indian shares over the same months.
This is not a case for US stocks. I believe they are in a valuation bubble: 17 Oct 2026IMF's manifesto of warnings 4 Oct 2026US jobs: fewer new jobs, longer searches 25 Sep 2026Bond markets have started acting 31 Aug 2026A correction in AI valuations is looking more likely 17 May 2026S&P at 7,400: irrational exuberance
SourcesNSE index data (Nifty 50, Nifty50 USD). S&P 500: Yahoo Finance. Both to 16 Oct 2026. US flows: US Treasury TIC to Aug 2026.
Amar Harolikar · Decision Sciences & Applied AI3 of 7tigzig.com
Slide 4
TIGZIGWhere the selling happened
They sold even more on the stock exchanges than the net figure shows
Since October 2024, foreign investors net sold US$79.5 billion of shares on the stock exchanges.
At the same time they put US$20.9 billion into the primary market and others: IPOs, placements and similar deals.
So the net figure of US$58.6 billion understates what was sold in the market.
Net foreign buying, US$ billion
On the stock exchanges Primary market and others (IPOs, placements)
-80 -60 -40 -20 0 +20 -40.1 +6.5 Oct 2021 to Jun 2022 +23.9 +13.1 Mar 2023 to Sep 2024 -79.5 +20.9 Oct 2024 to Sep 2026
SourcesNSDL daily FPI report, equity by route, US$, to 30 Sep 2026.
Amar Harolikar · Decision Sciences & Applied AI4 of 7tigzig.com
Slide 5
TIGZIGWho owns India Inc.
Their share of Indian companies is the lowest in 17 years
Foreign share of NSE-listed companies, % Each March year end, and June 2026
- 10 15 20 FY01 FY09 FY17 FY26 FY14 22.1 15.1
Last 12 quarters, % Sep 2023 to Jun 2026 15 17 19 18.4 17.7 Sep 24 15.1 Jun 26
Domestic institutions now own more than foreign investors
Domestic institutions Foreign 0 10 20 FY01 FY09 FY17 FY26 15.1 19.5
Down from 17.7% in Sep 2024 to 15.1% in Jun 2026, the lowest in 69 quarters.
Domestic institutions have owned more for seven quarters, since Dec 2024. The last time before that was 2003.
Part of the fall in their share is domestic buying, NSE says. Holdings: Rs 70.7 lakh crore (82.7 in Sep 2024).
SourcesNSE Market Pulse Aug 2026, tables 2 and 4 (CMIE Prowess, NSE EPR). Domestic institutions: mutual funds, banks, insurers and other institutions.
Amar Harolikar · Decision Sciences & Applied AI5 of 7tigzig.com
Slide 6
TIGZIGSectors
Six sectors made up 80% of the selling, while a few others still drew money
Foreign investors were net sellers in 15 of NSDL's 23 sector groups. Six of them made up 80% of that selling.
They kept buying a few: metals and mining, services, telecom and capital goods.
IT holdings fell from US$83.9 to 37.4 billion. Net selling was US$10.2 billion of that, the rest was falling prices and the rupee.
Net foreign buying by sector, Oct 2024 to Sep 2026, US$ billion
Eight largest sold, then the five largest bought. Others are shares NSDL has not put in a named sector. All sectors together: US$58.4 billion.
Financials -16.2 IT -10.2 FMCG -9.5 Oil and gas -8.4 Autos -8.1 Power -4.1 Healthcare -2.9 Construction materials -2.7 Others (not classified) +4.3 Metals and mining +2.3 Services +1.8 Telecom +1.3 Capital goods +1.3
SourcesNSDL fortnightly sector report, equity, US$, to 30 Sep 2026.
Amar Harolikar · Decision Sciences & Applied AI6 of 7tigzig.com
Slide 7
TIGZIGEarlier analysis
This builds on my earlier analysis
18 Oct 2026 A bond shock could spread faster Hedge funds hold a near-record share of Treasuries, much of it on borrowed money.
28 Sep 2026 Foreign buying of US stocks hit a record. Then July went quiet. US Treasury data on foreign buying of US shares.
19 Sep 2026 India bank credit is up 19 percent The biggest single contributor is lending to NBFCs.
31 May 2026 India was the market's darling. Not any more. The growth story has a big red flag.
24 May 2026 India's next tech wave: AI data centres for the world Adani, Reliance, Airtel and L&T are building it.
About the data. Foreign investors here are foreign portfolio investors (FPIs). Flows are NSDL's net investment in equity, reported by custodians. Ownership is NSE's Market Pulse, based on CMIE Prowess. Each page names its sources below it.
Not investment advice. This is my analysis of public sources, for information only. Care has been taken, but errors are possible. Use of AI. Parts of this work were prepared with AI under my direction. I reviewed, edited and approved every page. The analysis and conclusions are mine.
Amar Harolikar · Decision Sciences & Applied AI7 of 7tigzig.com
Working on something similar? How I work covers the rates, the availability and what I take on.