A Correction in AI Valuations Is Looking More Likely, and That View Now Comes From a Central Bank, an Asset Manager and a Bond Investor.
Published: August 31, 2026
A correction in AI valuations is looking more likely, and that view now comes from a central bank, an asset manager and a bond investor. My own analysis says the same, and so does my experience of the crashes before and after dot-com.
The European Central Bank has said as much in writing. Two weeks later Andrew Bailey, who chairs the Financial Stability Board and is Governor of the Bank of England, told the G20 that leverage, and the cross-investment between AI companies and hyperscalers, could amplify the fall.
All of it rests on free cash flow arriving from 2028, and the expectations priced into that are large. For now it is going the other way, with Alphabet reporting its first negative free cash flow quarter since it listed 22 years ago.
For prior analysis: tigzig.com/analysis
I have written on this a few times over the past months
The readings have kept moving the same way.
S&P at 7,400 with irrational exuberance, and the pattern math on where that puts the index: tigzig.com/post/sp500-irrational-exuberance-7400-may2026
Three warnings on the AI valuation boom inside two weeks, from Warren Buffett, S&P Global and the BIS, which is the bank for central banks: tigzig.com/post/ai-boom-warnings-jul2026
Index at a record, peak valuation, record low sentiment, and what happened the last two times that setup held: tigzig.com/post/us-valuations-record-sentiment-low-jun2026
And the Mag7 cash flows are not the only pressure point
That is just one of many.
The macro underneath has been under pressure for a while: employment, delinquencies, inflation. On top of that, a growing share of the lending now happens outside the banks. That covers non-bank lending from US banks as well as the private credit markets, which themselves are showing signs of stress.
US banks had 2.8 trillion dollars committed to non-bank lenders at the end of Q2 2026, with 1.7 trillion of it already drawn. And Fitch has the private credit default rate at a record 6 per cent: tigzig.com/post/us-banks-nonbank-lending-q2-2026
Private credit, a market for lemons: tigzig.com/post/private-credit-market-for-lemons-may2026
More: tigzig.com/private-credit
Core inflation re-accelerating, with consumer delinquency past 2007: tigzig.com/post/us-inflation-shock-no-modern-playbook-jun2026
NY Fed Q2 2026 household debt, where the headline improved and auto and mortgage went the other way: tigzig.com/post/nyfed-household-debt-q2-2026
Bank losses off the peak but still above 2019: tigzig.com/post/fdic-q2-2026-bank-credit-tremor-aug2026
AI Valuation Red Flags, the Bear Case, August 2026
Browse the slides or download the PDF
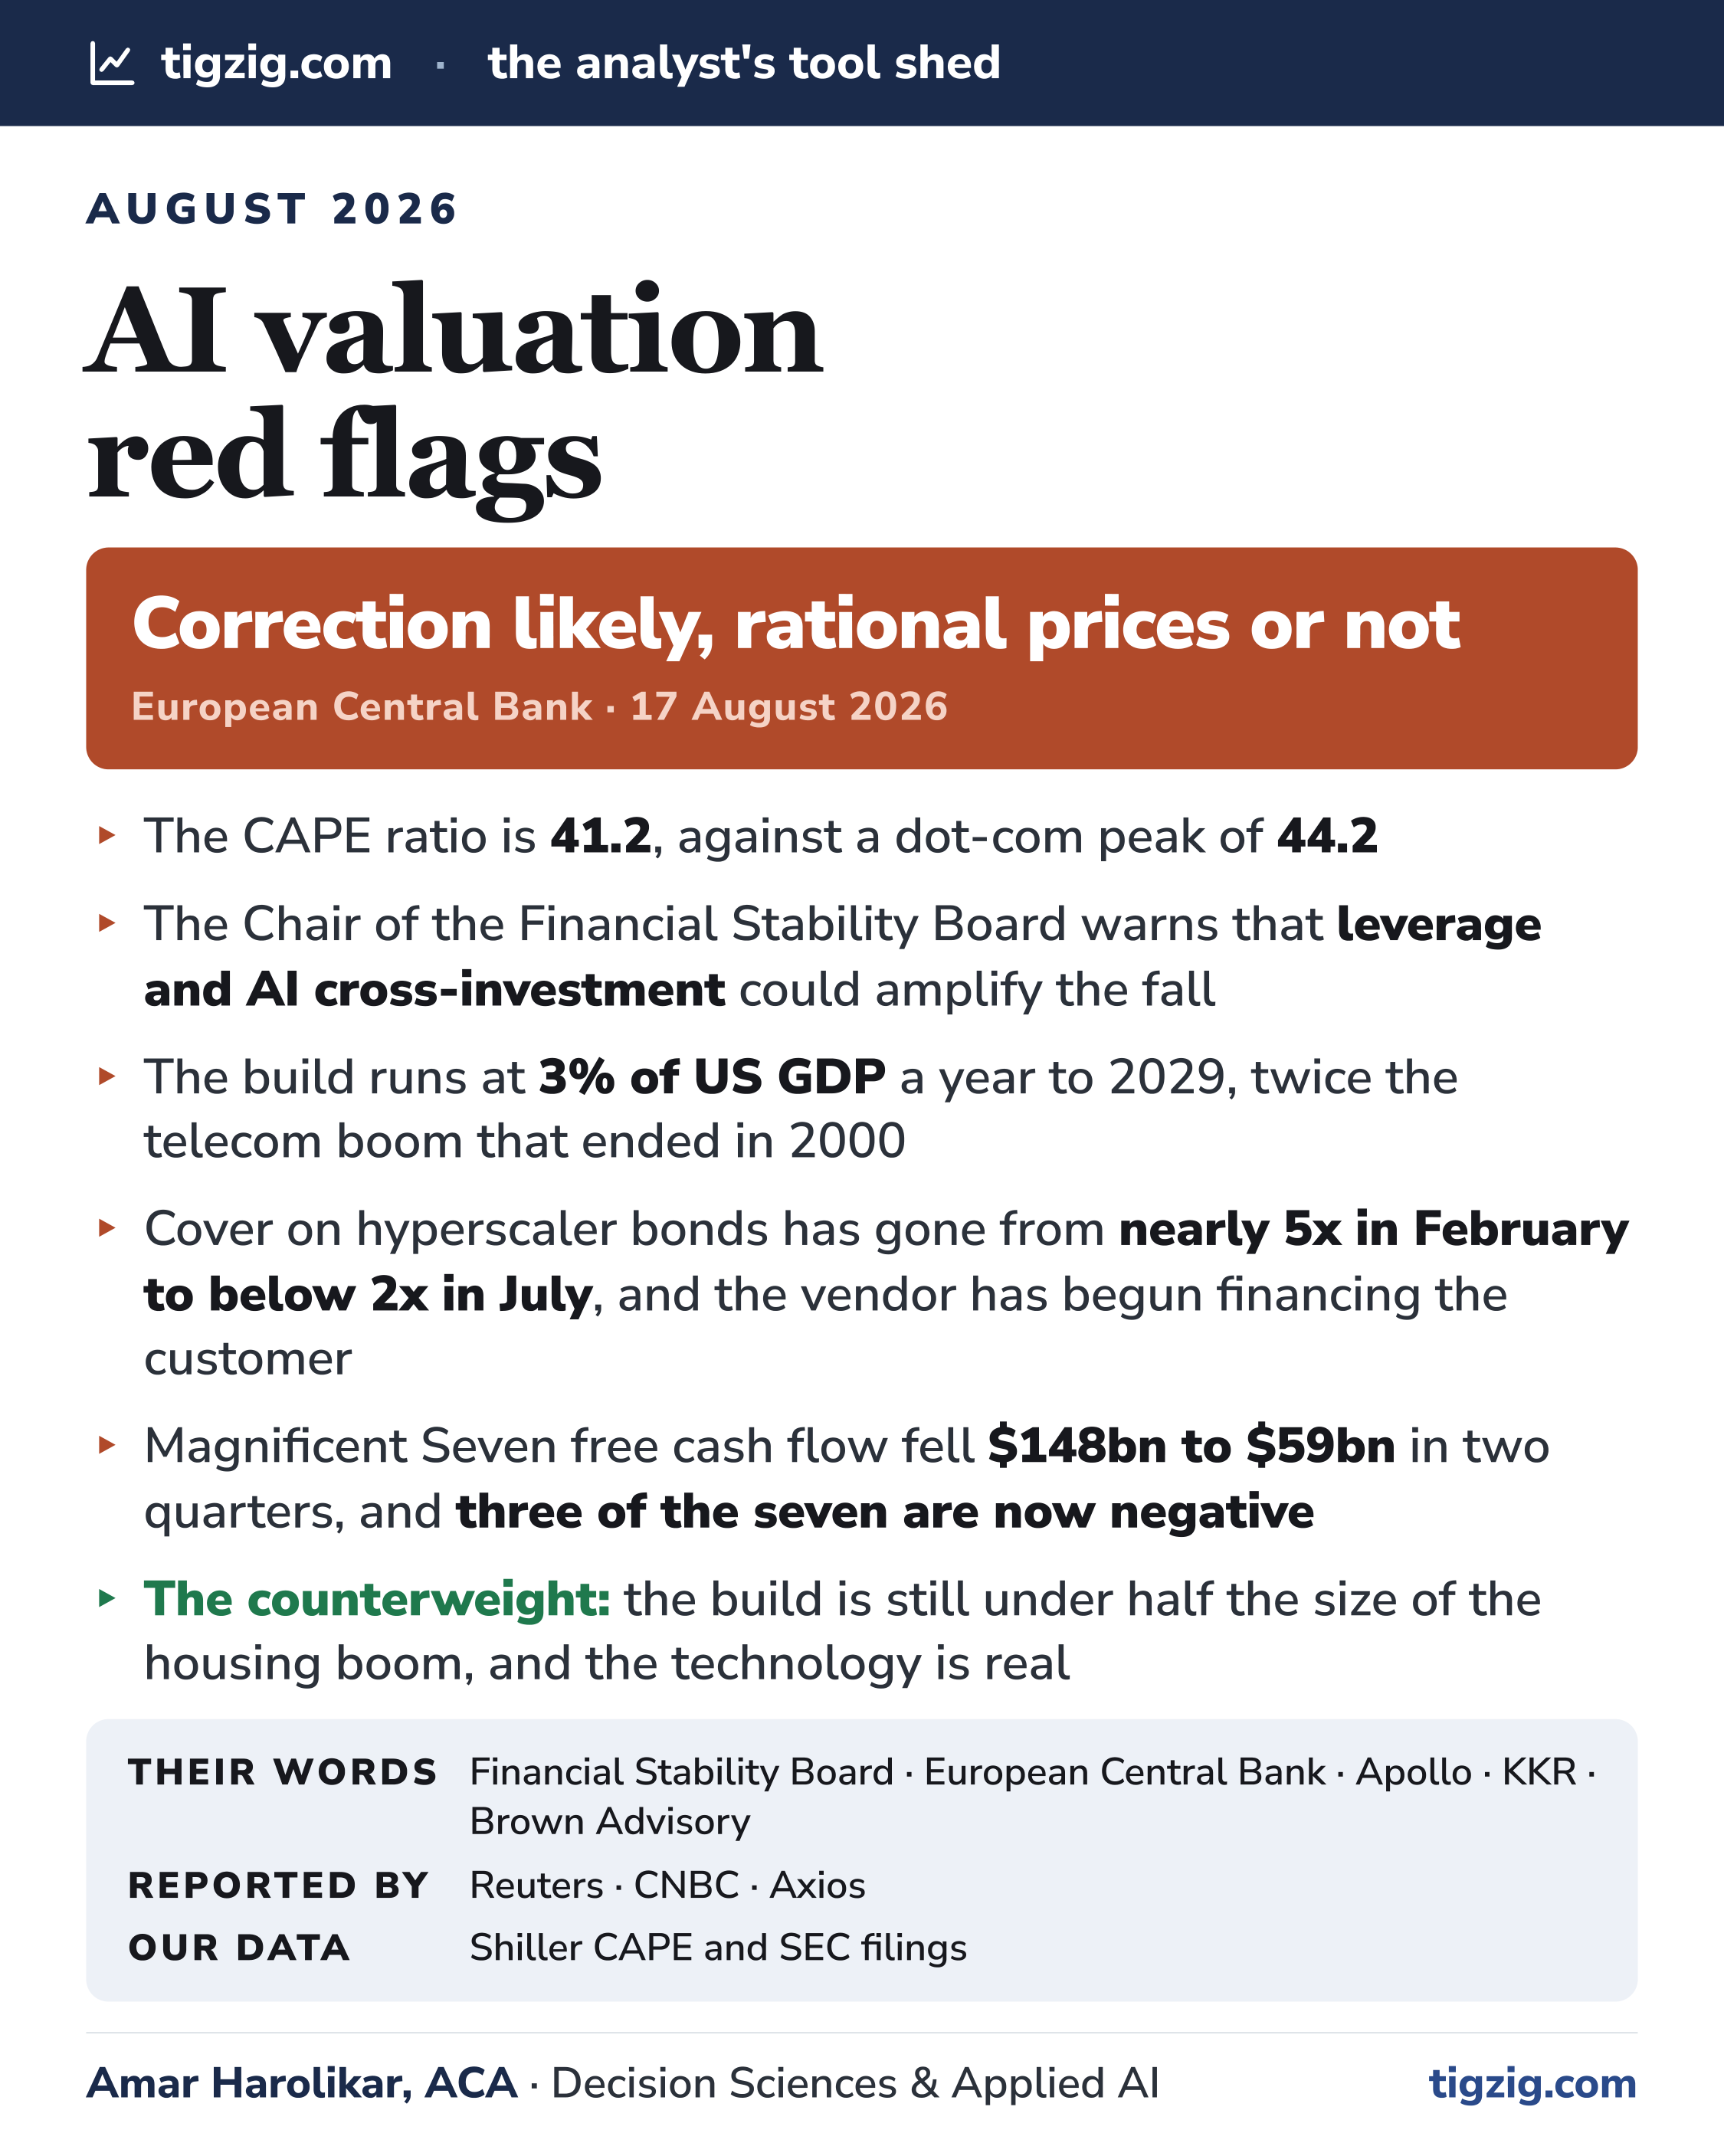
Full Deck Content (Text Format)
Text below was extracted from the source deck. Chart visuals stay in the PDF and as slide images above the post.
Slide 1
tigzig.com·the analyst's tool shed
August 2026
AI valuation red flags
Correction likely, rational prices or not
European Central Bank · 17 August 2026
The CAPE ratio is 41.2, against a dot-com peak of 44.2
The Chair of the Financial Stability Board warns that leverage and AI cross-investment could amplify the fall
The build runs at 3% of US GDP a year to 2029, twice the telecom boom that ended in 2000
Cover on hyperscaler bonds has gone from nearly 5x in February to below 2x in July, and the vendor has begun financing the customer
Magnificent Seven free cash flow fell $148bn to $59bn in two quarters, and three of the seven are now negative
The counterweight: the build is still under half the size of the housing boom, and the technology is real
Their words Financial Stability Board · European Central Bank · Apollo · KKR · Brown Advisory
Reported by Reuters · CNBC · Axios
Our data Shiller CAPE and SEC filings
Amar Harolikar, ACA · Decision Sciences & Applied AI tigzig.com
Slide 2
tigzig.com
The argument
One chain, four links
A dozen sources, all published since early July, each looking at a different point on the same chain. Read together they make one argument.
01
The price
Valuations are back at levels last seen in 2000, and the research says a correction follows whether or not the price is rational
02
The build
A build twice the size of the telecom boom, running faster than either of the last two cycles
03
The money
Bond investors, in rising size and at falling enthusiasm, with the vendor now financing the customer
04
The payoff
Every number above rests on cash flows that do not arrive until 2028
SourcesFull citations on the last page, every one of them linked.
Amar Harolikar 2 / 20
Slide 3
tigzig.comThe price
The price · 01
Back at dot-com levels
The CAPE ratio prices the market against ten years of inflation adjusted earnings, which strips out the cycle. The series runs monthly back to 1881. In all that time it has been above 40 in only two stretches: twenty-one months across 1999 and 2000, peaking at 44.2 in December 1999, and again since May this year.
0
10
20
30
40
50 1881 1929 1960 2000 2026
44.2 in Dec 1999
41.2 today
Shiller CAPE ratio, monthly, 1881 to August 2026. Our chart, from the Tremor macro tracker
"Valuations on the US stock market, as measured by the CAPE ratio, are currently close to their historical peak."
European Central Bank · ECB Blog, 17 August 2026
SourcesTremor, our own macro tracker | Rational enthusiasm or the next dot-com bubble? · ECB Blog, 17 Aug
Amar Harolikar 3 / 20
Slide 4
tigzig.comThe price
The price · 02
A correction either way
The blue line is what happens if today's prices are entirely rational. It still goes through a correction before the next rise. Their reason: a new technology is one company's bet, but once everybody depends on it the risk belongs to everybody, so investors charge more to carry it. Charging more means paying less today.
Fundamental Perpetual boom Plus a bubble
Stylised boom-bust scenarios. Chart: European Central Bank, 17 August 2026
"The case for expecting a correction is not dependent on whether today's prices are rational or irrational. We should be aware of that and prepare."
European Central Bank · Andersson, Breckenfelder, Corradin, Nikolov and Viola
SourceRational enthusiasm or the next dot-com bubble? · ECB Blog, 17 Aug
Amar Harolikar 4 / 20
Slide 5
tigzig.comThe price
The price · 03
It would not stay in America
Most European exposure to the Magnificent Seven is not held directly. It sits inside investment funds and low cost ETFs, which means the holder often does not know how concentrated it is. That structure is itself a transmission channel, because a fall forces the funds to sell to meet redemptions, which pushes prices down further.
"Euro area households, which are increasingly channelling funds into low-cost ETFs, have around €440 billion of exposures to US technology equities without necessarily being aware of the associated concentration risk."
European Central Bank · ECB Blog, 17 August 2026
"A US AI fallout would not remain a US problem."
European Central Bank · the closing line of the same post
SourceRational enthusiasm or the next dot-com bubble? · ECB Blog, 17 Aug
Amar Harolikar 5 / 20
Slide 6
tigzig.comThe price
The price · 04
Leverage is back, aimed at the same names
Bailey names three at once. Leveraged ETFs, momentum strategies including retail money, and hedge funds sitting in equities and sovereign debt together. That last one is his contagion channel.
"The issue is not simply that investors are borrowing more, but that leverage is interacting with high valuations and market concentration, in particular the increasing cross-investment between artificial intelligence (AI) companies and hyper scalers, in a way that could amplify a future market correction."
Andrew Bailey · Chair, Financial Stability Board
"A growing footprint of leveraged entities, such as hedge funds in equity markets, which are also exposed to sovereign debt, increase the scope for contagion risk ... I remain concerned therefore that a large shock or combination of shocks could concurrently trigger multiple vulnerabilities."
Andrew Bailey · the same letter
SourceFSB Chair's letter to the G20 · FSB, 28 Aug
Amar Harolikar 6 / 20
Slide 7
tigzig.comThe build
The build · 01
Three per cent of GDP, every year
Five companies, spending an amount equal to three cents of every dollar the United States produces, for three years running. In 2019 the same figure was three tenths of one per cent.
0%
0.5%
1%
1.5%
2%
2.5%
3%
3.5%
0.3% 2019
0.4% 2020
0.5% 2021
0.6% 2022
0.6% 2023
0.8% 2024
1.4% 2025
2.4% 2026
3.1% 2027
3.2% 2028
3.1% 2029
consensus forecast
Hyperscaler capex as a share of US GDP. Our chart, redrawn from Apollo Chief Economist, 6 August 2026. Hyperscalers are Amazon, Meta, Oracle, Microsoft and Google. Sources: FactSet, BEA, Haver Analytics
"The consensus expects hyperscaler capex to run at roughly 3% of GDP every year from 2027 to 2029, up from 0.3% of GDP in 2019 and 1.4% in 2025."
Torsten Slok · Partner and Chief Economist, Apollo
SourceThe AI Capex Boom Is Building Twice as Fast ... · Apollo, 6 Aug
Amar Harolikar 7 / 20
Slide 8
tigzig.comThe build
The build · 02
Twice the size of the fibre boom
Apollo lines the two cycles up year by year. The orange bar is the telecom and fibre buildout of the late nineties.
Telecom and fibre, from 1995
Hyperscalers, from 2022
0%
1%
2%
3%
4%
0.8%
0.6% 1995 2022
0.8%
0.6% 1996 2023
0.8%
0.8% 1997 2024
0.9%
1.4% 1998 2025
1.0%
2.4% 1999 2026
1.2%
3.1% 2000 2027
1.0%
3.2% 2001 2028
0.7%
3.1% 2002 2029
forecast
Both buildouts as a share of US GDP, lined up year by year. Our chart, redrawn from Apollo Chief Economist, 6 August 2026
"This is more than twice the peak of the telecom and fiber buildout of the late 1990s, which topped out at 1.2% of GDP in 2000 before collapsing and tipping the economy into the mildest post-war recession."
Torsten Slok · Partner and Chief Economist, Apollo
SourceThe AI Capex Boom Is Building Twice as Fast ... · Apollo, 6 Aug
Amar Harolikar 8 / 20
Slide 9
tigzig.comThe build
The build · 03
And still smaller than housing
The counterweight, and it is Apollo's own third chart. Residential investment reached 6.6 per cent of GDP in 2005, more than double where hyperscaler capex is forecast to peak.
Residential investment, from 1996
Hyperscalers
0%
2%
4%
6%
8%
4.4%
0.6% 1996 2022
4.4%
0.6% 1997 2023
4.6%
0.8% 1998 2024
4.8%
1.4% 1999 2025
4.7%
2.4% 2000 2026
4.8%
3.1% 2001 2027
5.1%
3.2% 2002 2028
5.6%
3.1% 2003 2029
6.1% 2004 2030
6.6% 2005 2031
6.1% 2006 2032
4.8% 2007 2033
3.5% 2008 2034
forecast
Both as a share of US GDP, lined up year by year. Our chart, redrawn from Apollo Chief Economist, 6 August 2026
"The data-center buildout is still less than half the size of the housing boom, which peaked at 6.6% of GDP in 2005."
Torsten Slok · Partner and Chief Economist, Apollo
SourceThe AI Capex Boom Is Building Twice as Fast ... · Apollo, 6 Aug
Amar Harolikar 9 / 20
Slide 10
tigzig.comThe build
The build · 04
The unwind is the risk, not the build
The level is the wrong thing to watch. What made 2008 severe was not how high housing got, it was how fast it came down. And this cycle is going up faster than either of the last two.
"The bottom line is that the data-center buildout is smaller than housing in level but larger in the change in share of GDP, and faster than either previous cycle."
Torsten Slok · Partner and Chief Economist, Apollo
"The same arithmetic runs in reverse: housing's unwind, from 6.2% of GDP in early 2006 to 3.0% by the end of 2008, is what made that recession severe, while telecom's much smaller reversal produced the mildest one ... A cycle that builds at 0.85 percentage points a year can unwind at a similar pace, and that, rather than the buildout itself, is the macro risk if AI demand disappoints."
Torsten Slok · the same note
The unwind Apollo is pointing at (residential investment, % of GDP)
Housing, early 2006
6.2%
Housing, end 2008
3.0%
SourceThe AI Capex Boom Is Building Twice as Fast ... · Apollo, 6 Aug
Amar Harolikar 10 / 20
Slide 11
tigzig.comThe money
The money · 01
The buyers are backing away
The cover ratio counts how many dollars of investor orders a bond deal draws for every dollar issued. On hyperscaler deals it has more than halved since February, while every other investment grade borrower has barely moved.
All hyperscaler deals February 2026
nearly 5x July 2026
below 2x Amazon's own bond sales March 2026
3.4x July 2026
1.6x
Dollars of investor orders per dollar of bonds issued. Our chart. Every figure is one the source states in words, from Apollo, 15 July 2026 and Reuters, 29 July 2026
"For hyperscalers, it has fallen from nearly 5x in February 2026 to below 2x in July, suggesting investors may need wider spreads to absorb additional hyperscaler supply."
Torsten Slok · Partner and Chief Economist, Apollo
SourcesCover Ratios for Hyperscaler Bonds Declining · Apollo, 15 Jul | Reuters, 29 Jul
Amar Harolikar 11 / 20
Slide 12
tigzig.comThe money
The money · 02
Borrowing more, at a worse price
Amazon, Alphabet, Meta and Oracle issued about 194 billion dollars of bonds in 2026 to 7 July, up 79 per cent on the whole of 2025. Goldman expects the five, adding Microsoft, to reach roughly 250 billion this year and 400 billion next. Of the bonds issued this year with comparable pricing, 78 of 91 now trade above the yield they were sold at.
Median new issue concession, basis points
The extra yield a borrower must offer, against its existing debt
2025
2.25 bp
2026
12 bp
"I don't see sort of a point in time in the near future where that sort of supply goes away. Technically, that puts pressure on spreads ... We're already seeing fatigue within credit markets in supporting this massive debt issuance."
Colby Stilson · head of fixed income, Brown Advisory
SourceHyperscaler debt binge pushes yields up ... · Reuters, 29 Jul
Amar Harolikar 12 / 20
Slide 13
tigzig.comThe money
The money · 03
The vendor is funding the customer
In late July, Nvidia was reported to be weighing a 250 billion dollar guarantee on an OpenAI data centre in Ohio, and separately a deal to finance OpenAI's purchase of 350 billion dollars of Nvidia chips. Its shares fell 4.5 per cent that morning, and the cost of insuring its bonds against default posted its sharpest intraday rise since they began trading actively in November. Andrew Bailey named this same structure on page 6, calling it cross-investment between AI companies and hyper scalers.
"You buy from me, I invest in you, and everything's fine unless one of us has a problem, in which case both of us have a problem."
Axios · on why the possibility of more circular deals soured the debt market that Monday
"It also renews concerns that the increasingly 'circular' nature of AI deals could create systemic financial risks."
Axios · the same report
SourcesNvidia reignites "circular" AI concerns · Axios, 27 Jul | FSB Chair's letter to the G20 · 28 Aug
Amar Harolikar 13 / 20
Slide 14
tigzig.comThe money
The money · 04
Now compute itself is a commodity
On 5 October, pending approval, CME and Silicon Data list two futures contracts on the hourly rental price of Nvidia H100 and Blackwell chips.
The case for it
"Compute futures give the market ... a public, tradable reference price for the resource every AI system runs on."
Carmen Li · chief executive, Silicon Data
"You can think about it as a revenue stream, and you can securitize it ... and sell it to investors."
Waldemar Szlezak · head of digital infrastructure, KKR
The note of caution
Oil and electricity trade this way. A chip is different, because it ages. Michael Burry argued late last year that the hyperscalers overstate the useful life of their AI chips and understate the depreciation.
"When Wall Street starts getting noticeably excited about securitizing physical assets, a natural question emerges: What could go wrong?"
CNBC · on the same announcement
SourcesAI computing power is a tradable asset class · CNBC, 11 Aug | Wall Street endorsed Huang's big concept · CNBC, 11 Aug
Amar Harolikar 14 / 20
Slide 15
tigzig.comThe payoff
The payoff · 01
Everything rests on 2028
Consensus has hyperscaler free cash flow falling sharply in 2026, recovering slowly through 2027, then more than doubling by 2030. Every valuation, every bond and every spread on the pages before this one is priced off the right hand side of this chart.
Free cash flow for Google, Meta, Microsoft and Amazon, actual and consensus forecast. Chart: Apollo Chief Economist, 9 July 2026. Source: FactSet
"But what if the payoff takes longer than consensus assumes?"
Torsten Slok · Partner and Chief Economist, Apollo
SourceA Slower AI Payoff Would Be Everyone's Problem · Apollo, 9 Jul
Amar Harolikar 15 / 20
Slide 16
tigzig.comThe payoff
The payoff · 02
Three of the seven are already negative
The same turn shows up in our own numbers, on a wider basket. Across the Magnificent Seven, net free cash flow fell from $148 billion in the December quarter to $59 billion in June. Alphabet, Amazon and Tesla were each below zero.
107 Q4 24
90 Q1 25
78 Q2 25
114 Q3 25
148 Q4 25
98 Q1 26
59 Q2 26
Net free cash flow, US dollars billion
Seven quarters to June 2026. Our chart and our data, from SEC EDGAR XBRL filings
Free cash flow, June quarter 2026, $bn. Nvidia is the quarter ended 26 July
Apple +$31.9B
Nvidia +$21.4B
Microsoft +$19.6B
Meta +$1.7B
Tesla -$1.1B
Alphabet -$5.9B
Amazon -$8.8B
Alphabet has never had a negative quarter before.
Its first negative quarter in 22 years as a public company.
SourcesOur own pull from SEC EDGAR | Alphabet Q2 2026 earnings release
Amar Harolikar 16 / 20
Slide 17
tigzig.comThe payoff
The payoff · 03
And the moat is leaking
Two things have to hold for that 2028 cash flow to arrive. Prices have to stop falling, and the American models have to keep their share. Chinese models were five of the world's fifty most used in January 2025. By May 2026 they were about twenty, read off Apollo's unlabelled chart.
China United States France Canada Unattributed
Origin of the world's 50 most-used AI models. Chart: Apollo Chief Economist, 9 July 2026. Source: OurWorldinData.org. Legend redrawn above at a readable size
"If Chinese models keep gaining and token prices keep falling, the hyperscaler cash flows expected may prove too optimistic."
Torsten Slok · Partner and Chief Economist, Apollo
SourceA Slower AI Payoff Would Be Everyone's Problem · Apollo, 9 Jul
Amar Harolikar 17 / 20
Slide 18
tigzig.comThe payoff
The payoff · 04
If it comes late, three things break
Apollo set out what a slower payoff does, in order.
1 Cash flows and earnings disappoint. The free cash flow surge slips later while committed capex and heavy depreciation hit on schedule, squeezing margins.
2 A Mag 7 sell-off that takes the market with it. Because those seven are so much of the index, the pain cannot stay contained. It spreads to chips, power, data centres and the S&P 500 as a whole.
3 Balance sheets stretch and credit risk rises. With internal cash unable to cover spending, the hyperscalers lean further on debt, inviting possible ratings downgrades if profits lag.
"AI has been the one thing holding up both the economy and markets, and with so much riding on so few names, a slower payoff wouldn't just be a sector problem, it would risk tipping the economy into recession and the S&P 500 into a correction."
Torsten Slok · Partner and Chief Economist, Apollo
SourceA Slower AI Payoff Would Be Everyone's Problem · Apollo, 9 Jul
Amar Harolikar 18 / 20
Slide 19
tigzig.comMy read
My read
I have been through a few of these
My own view is that we are at an overvalued point, and this is one of several bubbles waiting to burst.
The dot-com one I remember very clearly. That time it was all about page views, with no revenue, never mind profit. This time the revenues are there, that much is real. It is the profits and cash flows people are counting on that carry the question mark.
Both times the technology itself was real, and in the end all of the value did arrive. It just did not arrive in the amount the market was expecting, or inside the compressed timeframe it was pricing. So the thing went through its whole cycle first.
In the market since 1994. Ex derivative trader (full time, proprietary account).
The ECB economists made the same point in their own words: "The exact timing is unknowable in advance. These boom-bust patterns are only identifiable with hindsight."
More of my work on fundamentals, macro and markets tigzig.com/analysis
Amar Harolikar 19 / 20
Slide 20
tigzig.com·the analyst's tool shed
For the record
Sources
Every quotation is verbatim. Charts are either the publisher's own, reproduced with credit, or ours, drawn from the figures the publisher printed and labelled as such. All published since early July.
The price
FSB, 28 Aug FSB Chair's letter to G20 Finance Ministers and Central Bank Governors
ECB Blog, 17 Aug The AI boom: rational enthusiasm or the next dot-com bubble?
The build, and the payoff
Apollo, 6 Aug The AI Capex Boom Is Building Twice as Fast as the Housing Boom
Apollo, 15 Jul Cover Ratios for Hyperscaler Bonds Declining
Apollo, 9 Jul A Slower AI Payoff Would Be Everyone's Problem
The money
Reuters, 29 Jul Hyperscaler debt binge pushes yields up as investor demand cools
Axios, 27 Jul Nvidia reignites "circular" AI concerns as it weighs OpenAI financing guarantee
CNBC, 11 Aug AI computing power is becoming a tradable asset class as CME launches futures contracts
CNBC, 11 Aug Wall Street just endorsed Jensen Huang's 'big concept' for AI. What now?
Alphabet, 22 Jul Alphabet Q2 2026 earnings release, with its own free cash flow reconciliation
Our own data
Tremor Shiller CAPE, monthly since 1881. Free, no sign up, full data download
Amar Harolikar · more at tigzig.com/analysis 20 / 20
Working on something similar? How I work covers the rates, the availability and what I take on.