US Jobs, September 2026: Fewer New Jobs, Longer Searches, Pay Barely Keeping Up
Published: October 4, 2026
The US added 29,000 jobs in September. The past year adds up to 543,000 jobs, down from 827,000 as first reported. First reports have been revised down four years in a row, the longest run in records back to 1956.
Fewer workers are joining the labour force. More people are retiring and fewer immigrants are arriving. Reuters reports economists put the jobs needed each month at about 50,000. RBC puts it at 20,000. The last three months averaged 51,000.
Health care and social assistance have added more jobs than the whole economy over the past two years. Outside them, monthly job gains fell from 126,000 in 2023 to about zero. One month drags that down. Federal payrolls fell about 166,000 in October 2025 as staff who took a 2025 resignation offer came off the payroll. Leave that month out and jobs outside health care grew about 15,000 a month.
Unemployment is 4.2 per cent against 3.6 on average in 2023. It has eased this year because fewer people are in the labour force.
People stay out of work longer. The typical spell is 11.5 weeks. 27 per cent of the unemployed have been out for six months or more.
Hiring is low. About 4 in 10 people on unemployment benefit now reach the end of it, against 1 in 3 in 2019.
Hourly pay has trailed prices since April, mostly because of energy. The saving rate is down to 4.1 per cent.
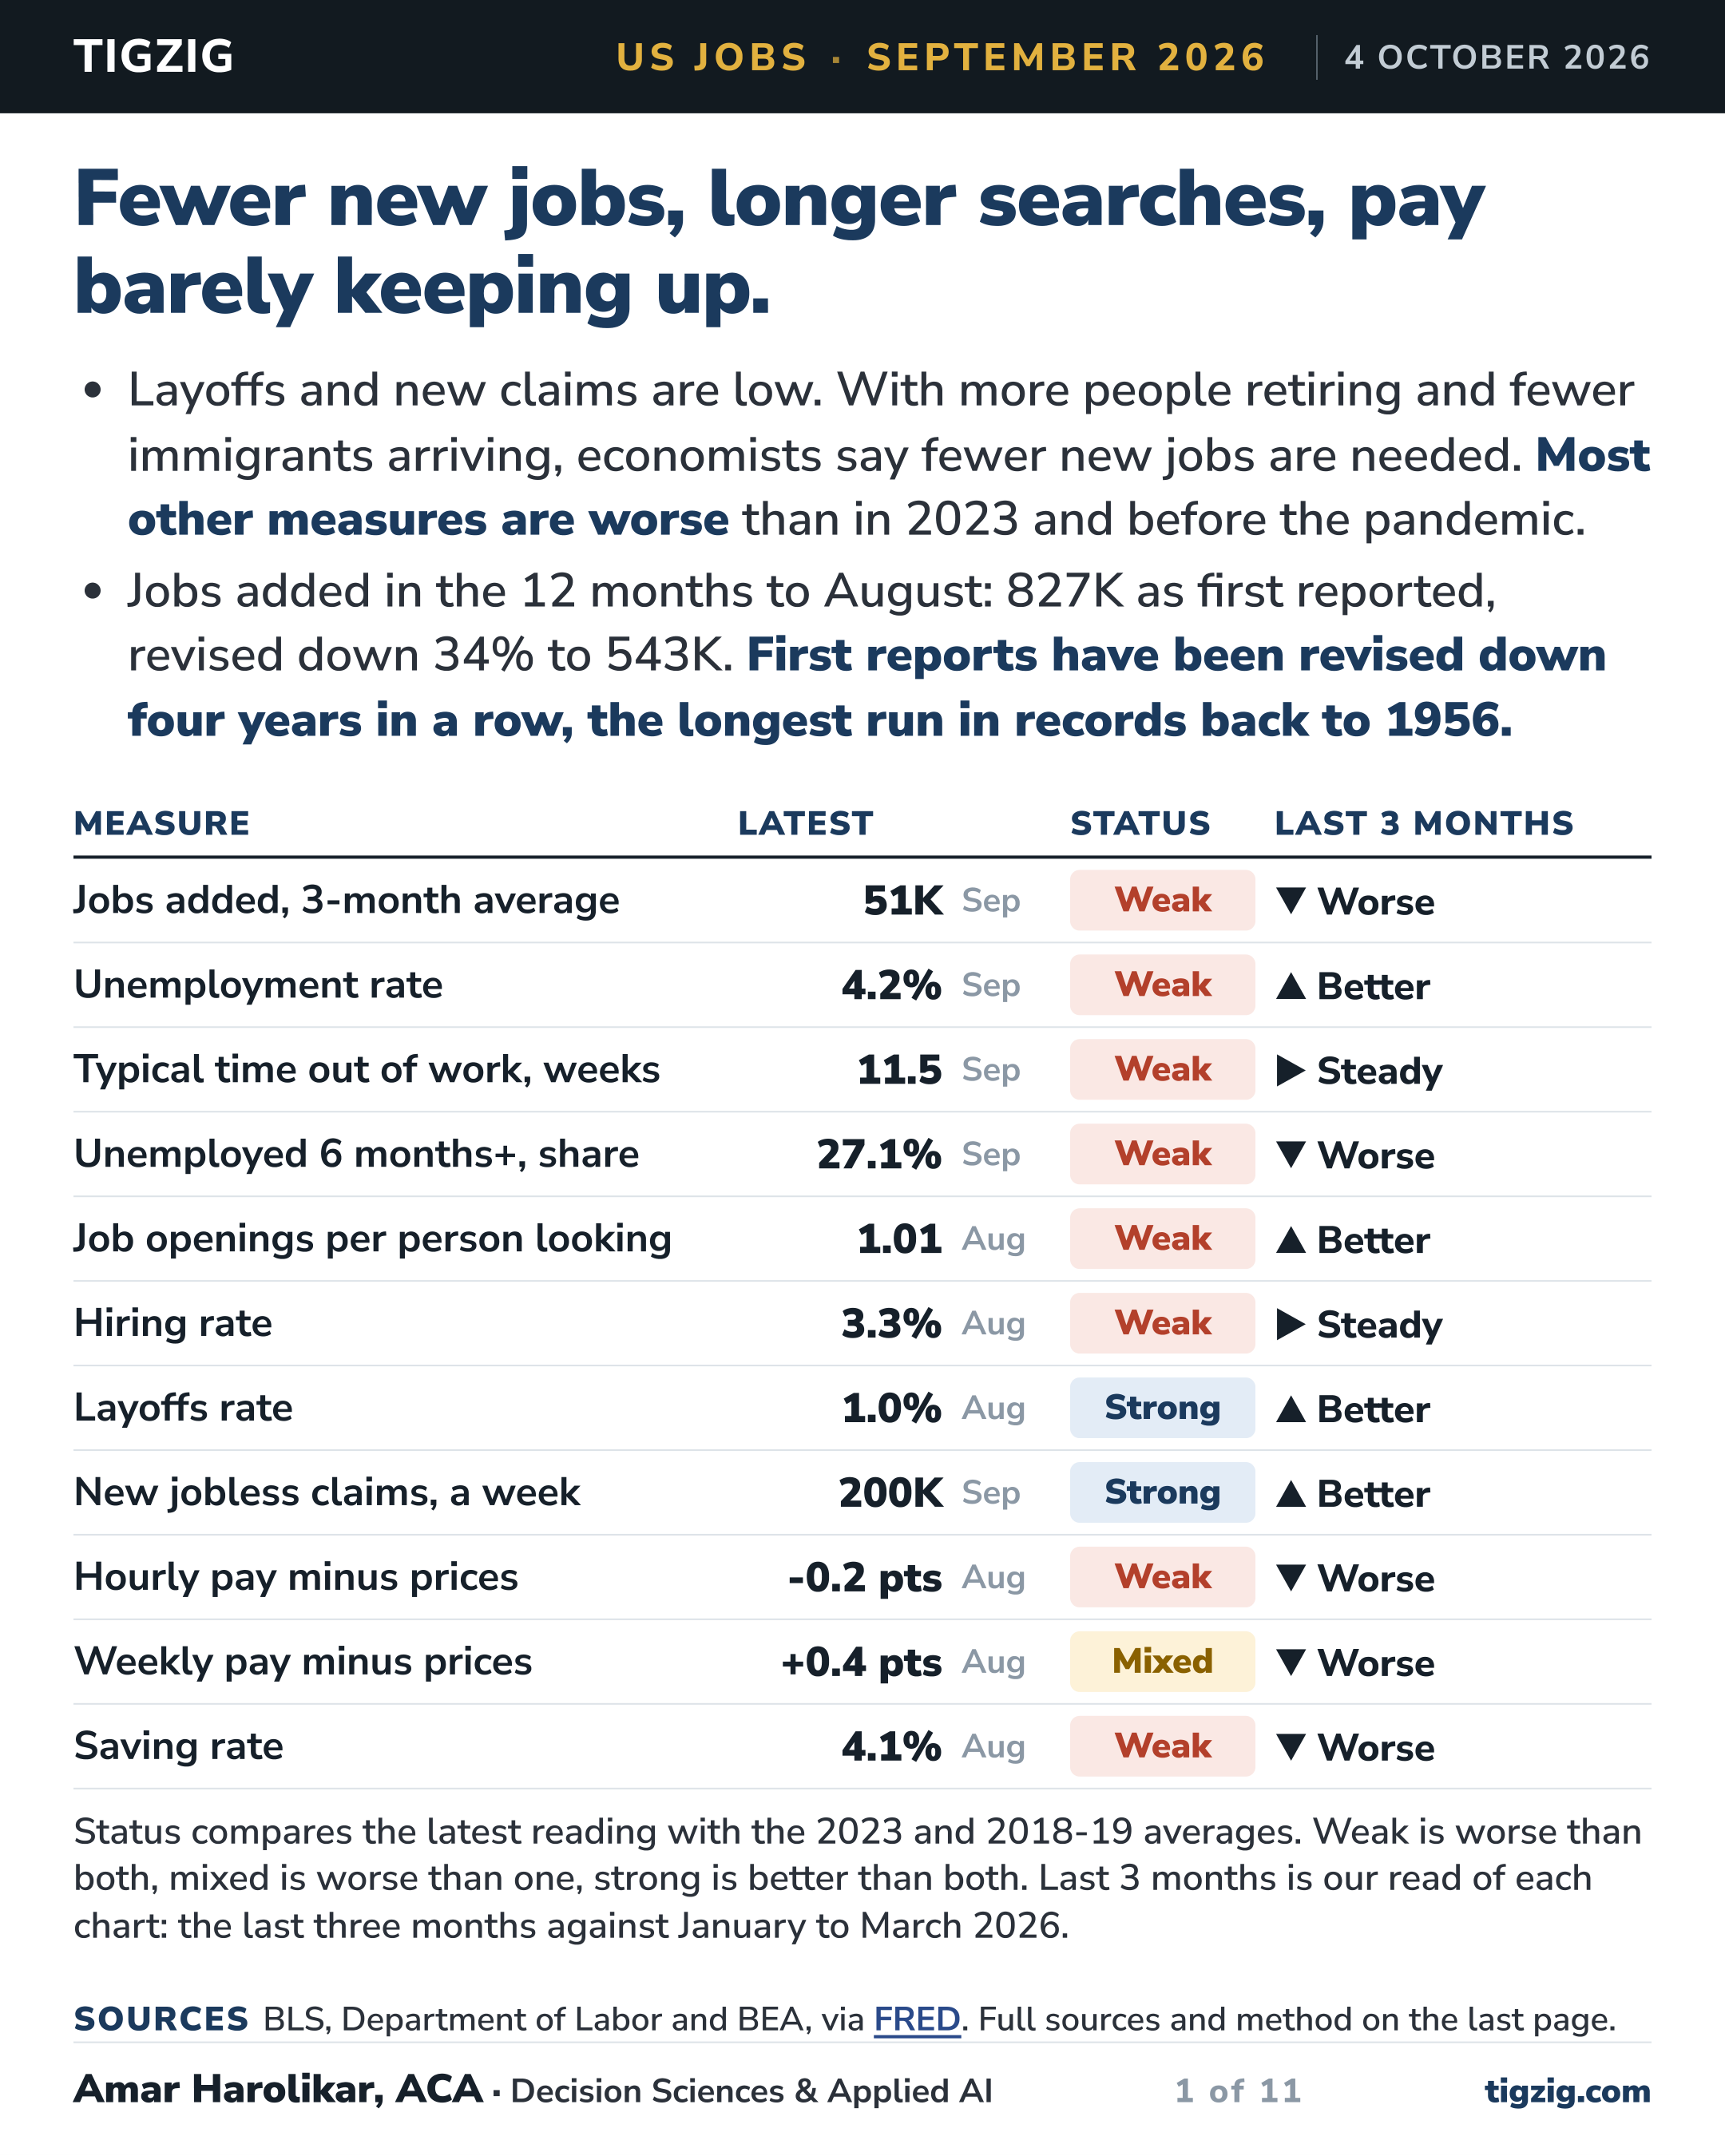
The first page rates 11 measures against 2023 and 2018-19. Eight are weak, one is mixed and two are strong. The rest of the analysis has the charts behind each one, plus a few more measures.
This updates my analysis of 24 September 2026: "On the headline numbers the US job market looks fine. The story changes when you dig deeper". https://www.tigzig.com/post/us-jobs-calm-before-storm-sep2026
Other analysis at: https://www.tigzig.com/analysis
Use of AI, and a few notes on the numbers
Parts of this work were prepared with AI and steered by me. I reviewed, edited and approved every page. Every data series is pulled from the sources above. The analysis and conclusions are mine.
The 827,000 adds up each month's job change as it was first reported. The February benchmark revision accounts for about 16,000 of the cut. The rest came from the regular monthly revisions. September is a first estimate and will be revised twice more.
The revision history compares the same September to August window in every year, using the jobs report published that October. Later benchmark revisions cut 2024 and 2025 to about 100,000 a month. This year's benchmark comes in February 2027, and the BLS early estimate is a small cut of 79,000.
September may be understated. Reuters reports economists noting that payrolls tend to come in weak when Labor Day falls late, as it did this year. Reuters also links the July and August revisions to the seasonal adjustment model.
JOLTS, the openings, hiring, quits and layoffs data, is published a month after the jobs report, so those figures end in August.
BEA revised income and saving on 30 September. The saving figures here are the revised ones.
My earlier analyses on the economy and markets
The labour deck from 24 September. On the headline numbers the job market looked fine, and the numbers underneath told a different story. https://www.tigzig.com/post/us-jobs-calm-before-storm-sep2026
The bond market rout. The US ten year is above 5 per cent for the first time since 2007, and those rates set mortgages, company refinancing and government borrowing. https://www.tigzig.com/post/bond-market-rout-sep2026
US diesel went above $6 a gallon for the first time, and the cost is reaching truck freight, airfares and farm bills. https://www.tigzig.com/post/diesel-above-six-dollars-sep2026
Credit union losses in Q2 2026 are above the pre-crisis level, and 60 plus day delinquency is above pre-COVID in every segment. https://www.tigzig.com/post/credit-union-q2-2026-losses-delinquency-sep2026
A Correction in AI Valuations Is Looking More Likely https://www.tigzig.com/post/ai-valuation-correction-aug2026
US Jobs, September 2026: Fewer New Jobs, Longer Searches, Pay Barely Keeping Up
Browse the slides or download the PDF
Full Deck Content (Text Format)
Text below was extracted from the source deck. Chart visuals stay in the PDF and as slide images above the post.
Slide 1
TIGZIG US JOBS · SEPTEMBER 2026 4 OCTOBER 2026
Fewer new jobs, longer searches, pay barely keeping up.
Layoffs and new claims are low. With more people retiring and fewer immigrants arriving, economists say fewer new jobs are needed. Most other measures are worse than in 2023 and before the pandemic.
Jobs added in the 12 months to August: 827K as first reported, revised down 34% to 543K. First reports have been revised down four years in a row, the longest run in records back to 1956.
Measure Latest
Status Last 3 months
Jobs added, 3-month average 51K Sep Weak ▼Worse
Unemployment rate 4.2% Sep Weak ▲Better
Typical time out of work, weeks 11.5 Sep Weak ▶Steady
Unemployed 6 months+, share 27.1% Sep Weak ▼Worse
Job openings per person looking 1.01 Aug Weak ▲Better
Hiring rate 3.3% Aug Weak ▶Steady
Layoffs rate 1.0% Aug Strong ▲Better
New jobless claims, a week 200K Sep Strong ▲Better
Hourly pay minus prices -0.2 pts Aug Weak ▼Worse
Weekly pay minus prices +0.4 pts Aug Mixed ▼Worse
Saving rate 4.1% Aug Weak ▼Worse
Status compares the latest reading with the 2023 and 2018-19 averages. Weak is worse than both, mixed is worse than one, strong is better than both. Last 3 months is our read of each chart: the last three months against January to March 2026.
SourcesBLS, Department of Labor and BEA, via FRED. Full sources and method on the last page.
Amar Harolikar, ACA · Decision Sciences & Applied AI
1 of 11
tigzig.com
Slide 2
TIGZIG US JOBS · SEPTEMBER 2026 4 OCTOBER 2026
The past year was smaller than first reported.
Jobs added, 12 months to August 827K First reported 543K Today
Revised down 34%
Added up month by month as each was first reported, the 12 months to August came to 827K jobs. Today the same months add up to 543K. 8 of the 12 were revised down.
How many jobs a month does the US need now? Fewer, because retirements and the immigration crackdown mean fewer new workers. Reuters reports economists put this break-even at about 50K a month. RBC puts it at 20K. The last three months averaged 51K.
The same 12 months, plus September, in thousands
First reported As published today · September is a first estimate
+76 Sep 25 -140 Oct +41 Nov -17 Dec +160 Jan 26 -156 Feb +214 Mar +148 Apr +63 May +31 Jun -10 Jul +133 Aug +29 Sep 26
SourcesBLS payroll survey via ALFRED and FRED; break-even, Reuters and RBC. Full sources and method on the last page.
Amar Harolikar · Decision Sciences & Applied AI
2 of 11
tigzig.com
Slide 3
TIGZIG US JOBS · SEPTEMBER 2026 4 OCTOBER 2026
Job growth has been revised down four years in a row. That is the longest run in records back to 1956.
How much each year's jobs were revised, thousands a month
Revised up Revised down · 12 months from September to August
-50 -25 +25 +50 +75 +100 0 1980 1990 2000 2010 2020 2026 4 years down in a row
The cuts usually grow later. Each bar compares first reports with that October's jobs report. Every February, BLS checks the past year against tax records. That took 2024 and 2025 to cuts of about 100K a month, the second and fourth largest since 1980. This year's comes in February 2027, and the early estimate is a small cut of 79K.
MethodEach bar is the 12-month change in that year's October report, minus the sum of the months as first reported, divided by 12. ALFRED, every vintage of PAYEMS, which go back to 1956; before 1980 no run was longer than one year. The September 2025 report, normally out in early October, came on 20 November after the shutdown.
Amar Harolikar · Decision Sciences & Applied AI
3 of 11
tigzig.com
Slide 4
TIGZIG US JOBS · SEPTEMBER 2026 4 OCTOBER 2026
Job gains fell from 210K a month in 2023 to 41K. Outside health care, from 126K to near zero.
Average jobs added a month, in thousands
All jobs +210 2023 +41 Last 12m Health care, social +83 2023 +43 Last 12m All except health, social +126 2023 -2 Last 12m +15 Excl. Oct 25 Government +60 2023 -18 Last 12m Professional, business -11 2023 +10 Last 12m Leisure, hospitality +38 2023 +5 Last 12m Construction +18 2023 +9 Last 12m Financial +2 2023 -9 Last 12m Information -11 2023 -10 Last 12m
One month pulls this down. Federal payrolls fell about 166K in October 2025, as staff who took a 2025 offer to resign came off the payroll. Without October, jobs outside health care grew 15K a month and all jobs 58K. In the last six months, about 32K outside health care.
SourcesBLS payroll survey via FRED. Full sources and method on the last page.
Amar Harolikar · Decision Sciences & Applied AI
4 of 11
tigzig.com
Slide 5
TIGZIG US JOBS · SEPTEMBER 2026 4 OCTOBER 2026
Health care added jobs in 23 of the last 24 months. Jobs outside it fell in 14 of them.
The same nine sectors, month by month. Each chart has its own scale, to show its trend.
Jobs added each month, in thousands, January 2023 to September 2026. The October 2025 drop is the federal one-off on the page before. In February 2026 a strike kept more than 30,000 health care workers off payrolls.
All jobs Health care, social All except health, social Government Professional, business Leisure, hospitality Construction Financial Information
SourcesBLS payroll survey via FRED. Full sources and method on the last page.
Amar Harolikar · Decision Sciences & Applied AI
5 of 11
tigzig.com
Slide 6
TIGZIG US JOBS · SEPTEMBER 2026 4 OCTOBER 2026
Unemployment is higher than in 2023 and people stay out of work longer. This year unemployment eased because fewer people are in the labour force.
Unemployment rate per cent Jan 2023 Sep 2026 3.5 4.2 Broad rate, U-6 adds involuntary part-time Jan 2023 Sep 2026 6.7 7.6 Laid off for good per cent of the labour force Jan 2023 Sep 2026 0.78 1.03 Out of work 15 weeks+ per cent of the labour force Jan 2023 Sep 2026 1.2 1.8 Out of work 6 months+ per cent of the labour force Jan 2023 Sep 2026 0.66 1.14 Median time out of work weeks Jan 2023 Sep 2026 9.6 11.5
In September the unemployment rate rose from 4.14 to 4.18 per cent, within the survey's margin of error. More people joined the labour force and most of them found work. Since January, participation fell from 62.1 to 61.8 per cent and the share of adults in work from 59.4 to 59.2. Both comparisons start after the annual population update in January, so they are like for like.
SourcesBLS household survey via FRED. Full sources and method on the last page.
Amar Harolikar · Decision Sciences & Applied AI
6 of 11
tigzig.com
Slide 7
TIGZIG US JOBS · SEPTEMBER 2026 4 OCTOBER 2026
Hiring has slowed since 2023 and workers quit less. Layoffs are low, but finding work takes longer.
Job openings per person looking Jan 2023 Aug 2026 1.79 1.01 Hiring rate per cent of employment Jan 2023 Aug 2026 4.1 3.3 Quits rate per cent of employment Jan 2023 Aug 2026 2.5 1.9 Layoffs rate per cent of employment Jan 2023 Aug 2026 1.1 1.0
If layoffs are this low, why is "laid off for good" on page six higher than in 2023? Layoffs count people let go in a month, and that stays low. Laid off for good counts people who lost a job for good and are still out of work. Few are let go, but those who are take longer to find a new job, so the count built up. It peaked early in 2026 and at 1.03 per cent of the labour force is still above the 0.78 of January 2023.
The news is full of layoffs. Why is the rate low? About 1.6 million people were laid off or let go in August. That happens every month: in 2018 and 2019 it was 1.8 million a month. Headlines report the big announcements. As a share of all jobs, layoffs are below where they were before the pandemic. These figures come from JOLTS, which is published a month later.
SourcesBLS JOLTS via FRED. Full sources and method on the last page.
Amar Harolikar · Decision Sciences & Applied AI
7 of 11
tigzig.com
Slide 8
TIGZIG US JOBS · SEPTEMBER 2026 4 OCTOBER 2026
Fewer people are being let go than a year ago, so fewer claim benefit. More of those who claim now reach the end of it than in 2023.
New jobless claims thousands a week Jan 2023 Sep 2026 204 200 Continuing claims thousands, monthly average Jan 2023 Sep 2026 1,604 1,710 Reach end of benefit per cent of claimants Jan 2023 Aug 2026 31.9 39.2
Unemployment is higher than in 2023. Why are new claims not? New claims count people let go each week, and that has not risen. Those let go stay out of work longer, so the number of unemployed who lost a job is up 24 per cent since January 2023 while new claims are flat.
Why are continuing claims lower than a year ago? A new claim becomes a continuing claim, and fewer people are starting one: first payments in the three months to August were down 7 per cent on a year earlier. The share reaching the end of their benefit is about the same as a year ago, 39.2 per cent against 39.8, and well above the 31.9 of January 2023.
SourcesDepartment of Labor and BLS, via FRED. Full sources and method on the last page.
Amar Harolikar · Decision Sciences & Applied AI
8 of 11
tigzig.com
Slide 9
TIGZIG US JOBS · SEPTEMBER 2026 4 OCTOBER 2026
Hourly pay beat prices from May 2023 to March 2026. Since April it has been behind.
Hourly pay growth on a year, per cent Jan 2023 Aug 2026 4.5 3.1 Prices, CPI growth on a year, per cent Jan 2023 Aug 2026 6.3 3.4 Energy prices growth on a year, per cent Jan 2023 Aug 2026 0 8.3 16.0 Hourly pay minus prices points Jan 2023 Aug 2026 0 -1.83 -0.24 Pay minus core prices points, no food or energy Jan 2023 Aug 2026 0 -1.05 0.67 Weekly pay minus prices points, hours included Jan 2023 Aug 2026 0 -1.53 0.36
Why it moved. In January 2023, after the 2021-22 inflation surge, prices rose 6.3% a year and pay 4.5%. By June 2023 prices had slowed to 3.1% and pay at 4.7% was well ahead. In March 2026 energy prices jumped to 12.6% a year. By April prices rose 3.8%, above pay at 3.6%.
SourcesBLS, via FRED. Full sources and method on the last page.
Amar Harolikar · Decision Sciences & Applied AI
9 of 11
tigzig.com
Slide 10
TIGZIG US JOBS · SEPTEMBER 2026 4 OCTOBER 2026
Spending per person is growing faster than income, so people are saving less of their income.
Income per person growth on a year, after prices Jan 2025 Aug 2026 0 0.8 1.1 Spending per person growth on a year, after prices Jan 2025 Aug 2026 2.6 2.3 Saving rate per cent of after-tax income Jan 2025 Aug 2026 5.7 4.1
The dotted line is growth over the last 12 months against the 12 months before.
Saving rate since 1959 per cent of after-tax income, yearly average 1959 2026 13.5 in 1971 2.3 in 2005 7.9 in 2012 15.1 in 2020 10.3 4.7
Over the last 12 months, spending per person grew 1.9 per cent and income per person 1.1 per cent. Those are the dotted lines.
Saving averaged 8.5 per cent of after-tax income from 1959 to 2019. It is 4.7 in 2026 so far.
SourcesBEA, revised 30 September 2026, via FRED. Full sources and method on the last page.
Amar Harolikar · Decision Sciences & Applied AI
10 of 11
tigzig.com
Slide 11
TIGZIG US JOBS · SEPTEMBER 2026 4 OCTOBER 2026
Sources and method
Updates my analysis of 24 September 2026: On the headline numbers the US job market looks fine. The story changes when you dig deeper.
Source What we use Series
BLS payroll survey Jobs by month and sector, hourly and weekly pay, hours PAYEMS, CES0500000003 and ten more
ALFRED Each month's jobs number as first reported PAYEMS, every vintage
BLS household survey Unemployment, U-6, time out of work, laid off for good, participation UNRATE, U6RATE, UEMPMED, LNS13025703, CIVPART, EMRATIO and seven more
BLS JOLTS Job openings, hires, quits, layoffs JTSJOL, JTSHIR, JTSQUR, JTSLDR, JTSLDL
Department of Labor weekly claims New and continuing claims, weekly figures averaged by month ICSA, CCSA
Department of Labor ETA 5159 Share of claimants who reach the end of their benefit, first payments ETA 5159, c51 and c56
BLS consumer prices Prices, core and energy CPIAUCSL, CPILFESL, CPIENGSL
BEA Saving rate, income and spending per person PSAVERT, A229RX0, PCEC96, POPTHM
Reuters, RBC Break-even job growth, page 2 2 October 2026
Unrounded unemployment rate. The unemployed over the labour force, before BLS rounds it. Openings per person looking. JOLTS openings over the unemployed, same month. Pay minus prices. Yearly pay growth less yearly price growth, in points. Reach the end of benefit. Final payments over the twelve months to date, divided by first payments over the twelve months ending six months earlier. October 2025. The household survey and CPI have no reading for it, because of the shutdown.
Data. FRED and ALFRED pulled 4 October 2026; DOL ETA 5159 pulled 2 October 2026.
Use of AI. Parts of this work were prepared with AI and steered by me. I reviewed, edited and approved every page. Every data series is pulled from the sources above. The analysis and conclusions are mine.
Amar Harolikar · Decision Sciences & Applied AI
11 of 11
tigzig.com
Working on something similar? How I work covers the rates, the availability and what I take on.