On the Headline Numbers the US Job Market Looks Fine. The Story Changes When You Dig Deeper.
Published: September 24, 2026
On the headline numbers the US job market looks fine. The story changes when you dig deeper. Taken together with the pressure on the economy, markets and geopolitics, unless something changes drastically, I believe we are heading towards a tipping point. And not only for the US economy.
The August jobs report came in well above expectations... and twelve days later the Fed raised rates and described the economy as growing at a solid pace.
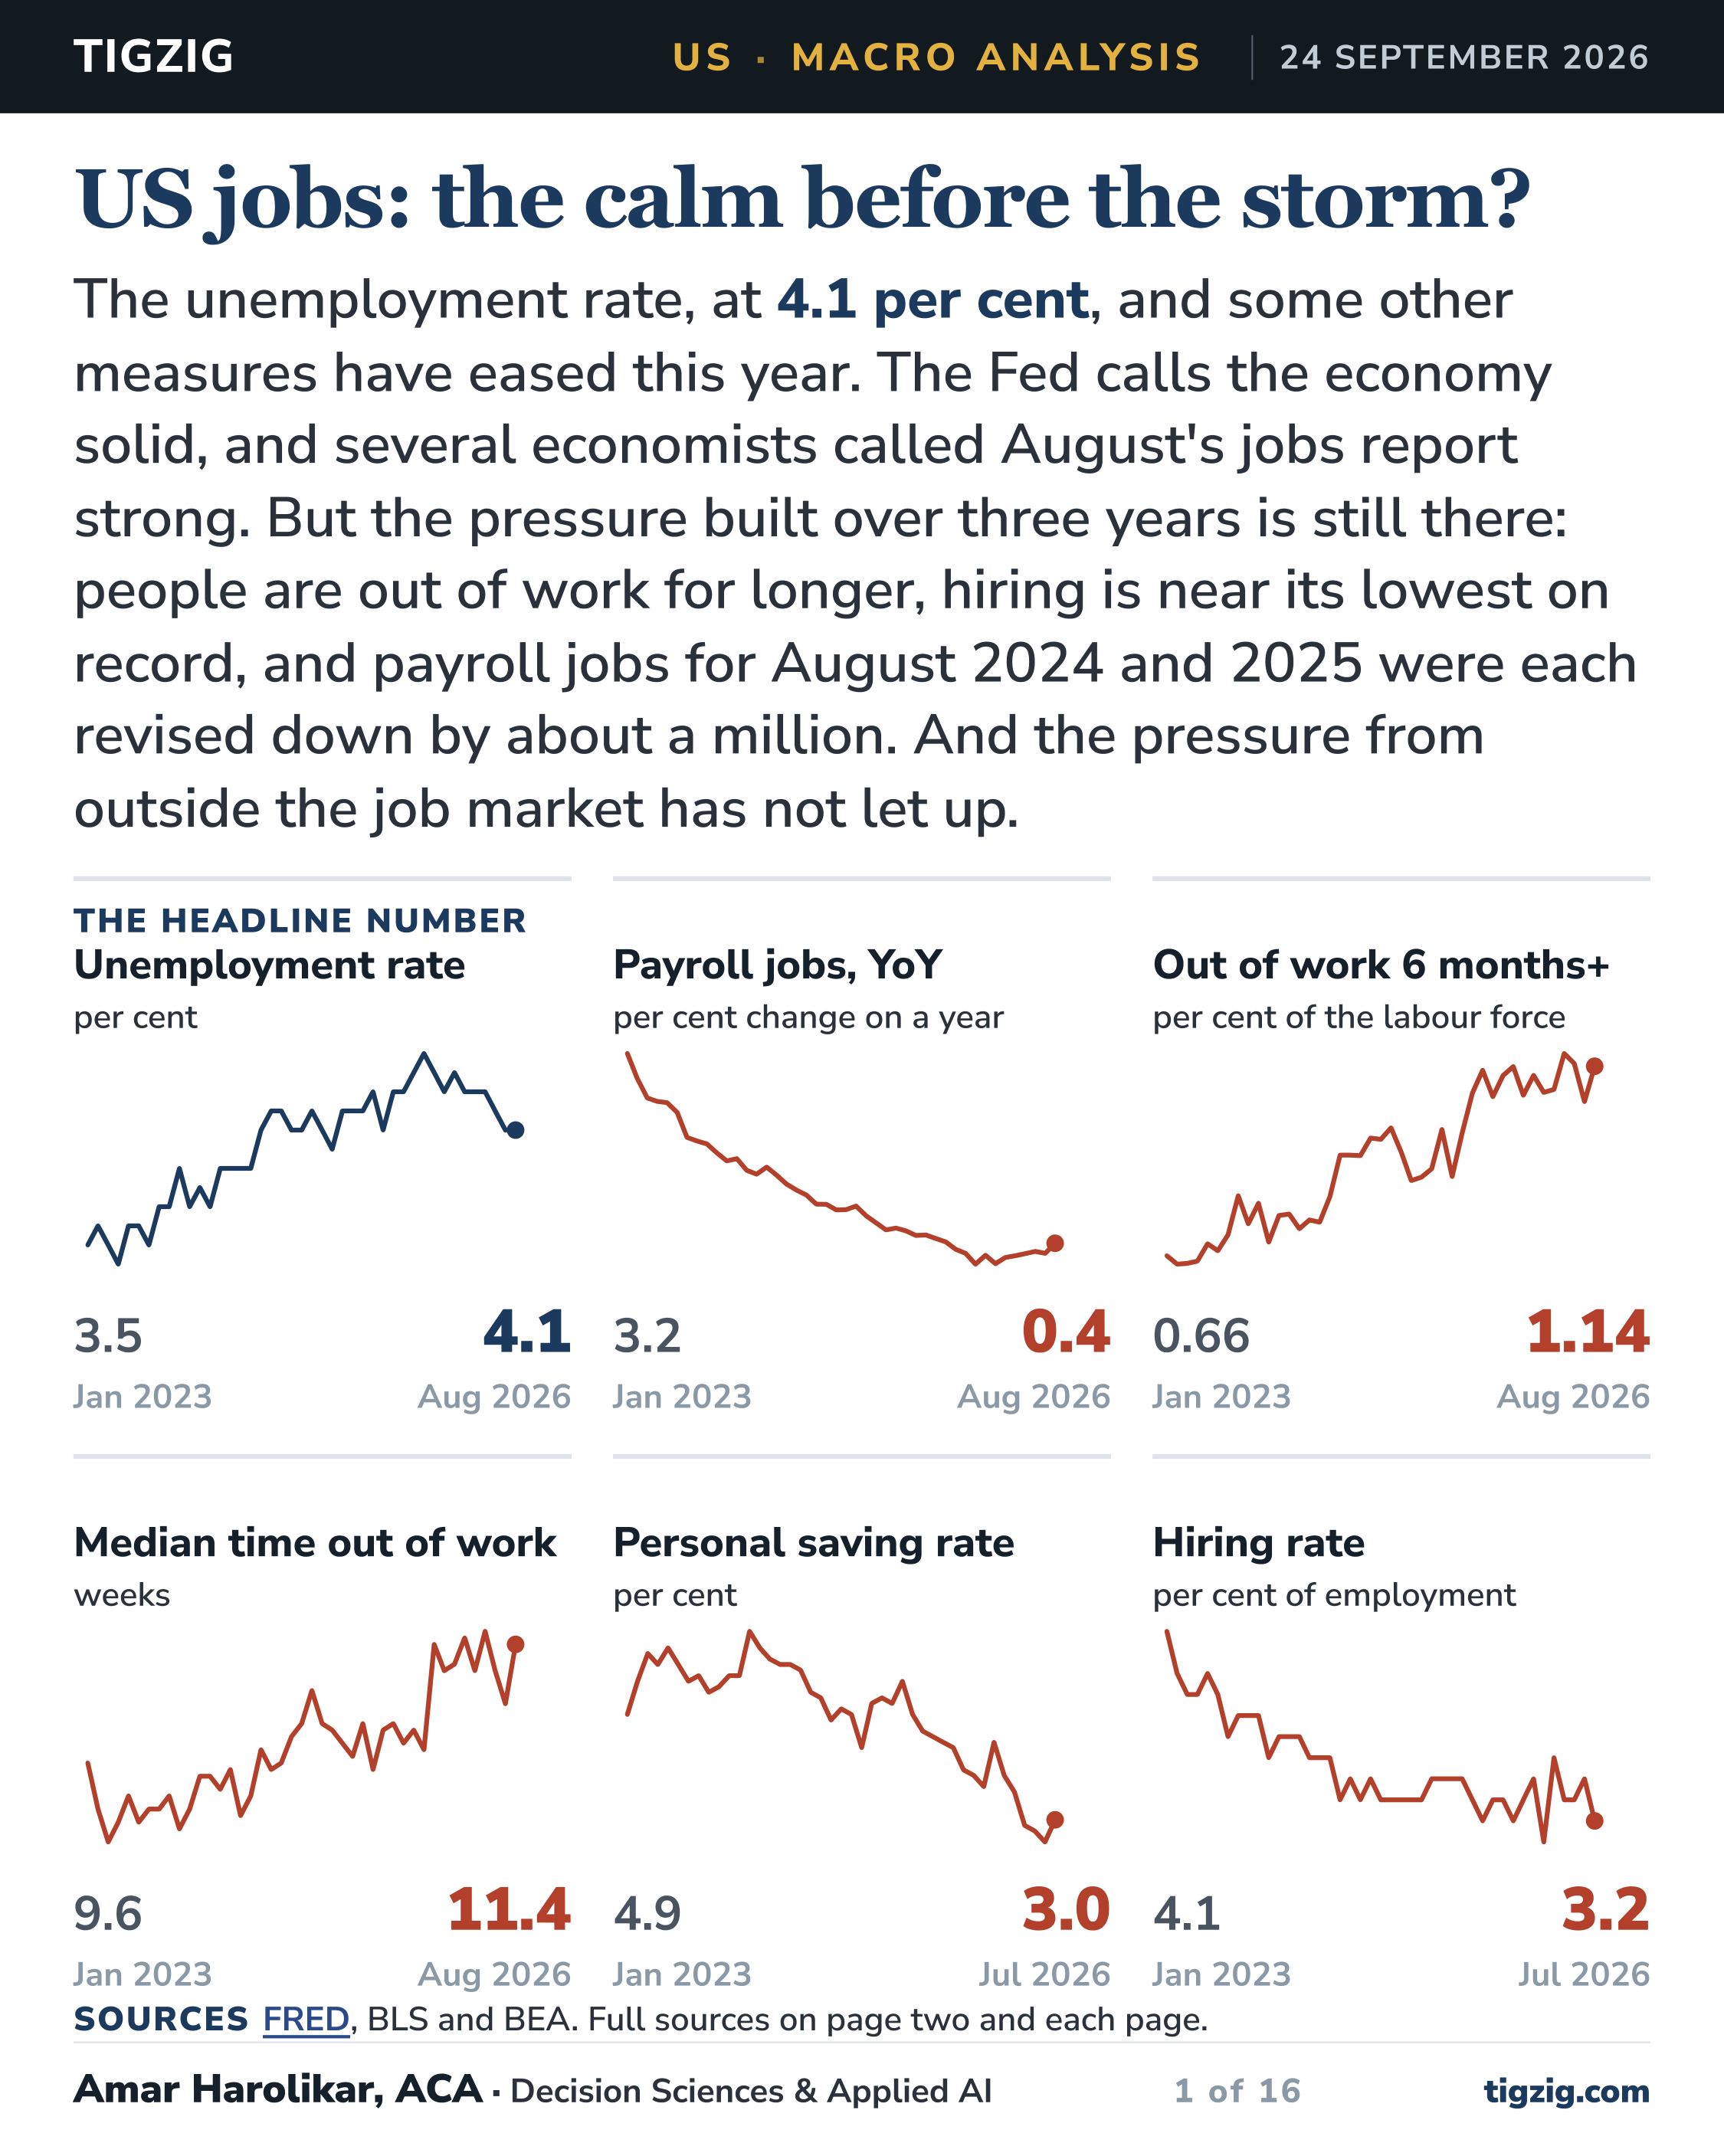
A deeper analysis gives a more mixed picture. Job growth has slowed from 3.2 per cent a year in January 2023 to 0.4 per cent now, and payroll jobs for August 2024 and August 2025 were each revised down by about a million. Hiring is near its lowest on record, and people who lose a job are staying out of work longer, with the median time out of work up from 9.6 weeks to 11.4.
Hourly pay has grown more slowly than prices for five months in a row, and the saving rate is down to 3.0 per cent as spending keeps running ahead of income. Some measures point the other way. Layoffs are low and weekly pay is still just ahead of prices, and the deck shows those as well.
Labour is one part of a bigger story. Links to earlier analysis are in the deck and below.
A few things about the labour data that are easy to trip on
The numbers come from several surveys, and each counts something different. Payrolls count jobs and the household survey counts people, so someone with two jobs counts twice in one and once in the other. A payroll change has to reach about 122,000 before it stands out from survey noise, and a household change about 650,000.
The household survey resets its population estimates every January. This January the reset took 0.4 of a point off the participation rate in one month, so any comparison across January needs care.
Payrolls are checked once a year against tax records. The early estimate of that revision comes out around late August and the final one in February, and the August counts for 2024 and 2025 were each revised down by about a million.
Layoffs show up in two ways. JOLTS layoffs count people let go in a month, and that number is flat. Permanent job losers count people laid off and still out of work, and that number has gone up because people are taking longer to find work.
October 2025 is missing from the household survey, because the survey was not carried out during the government shutdown.
Some of the earlier analysis on the economy, markets and valuation risks
Bond markets are sounding an alarm. The US thirty year went above 5.2 per cent this year for the first time since 2007, and long rates kept rising even while the Fed was cutting. Bond markets are sounding an alarm
US banks have 2.8 trillion dollars committed to non-bank lenders, and 1.7 trillion of it is already drawn, while Fitch has private credit defaults at a record. US banks and non-bank lending, Q2 2026
Credit unions in Q2 2026. Losses are above the pre-crisis level, and delinquency is above pre-COVID in every segment. Credit unions, Q2 2026
A correction in AI valuations looks more likely. A central bank, an asset manager and a bond investor now say so, and it all rests on free cash flow arriving from 2028. A correction in AI valuations
The FSB chair is not hedging. Andrew Bailey told the G20 that markets remain vulnerable to a disorderly correction that could spread across borders. The FSB chair's warning
All of them are at tigzig.com/analysis
US jobs: the calm before the storm?
Browse the slides or download the PDF
Full Deck Content (Text Format)
Text below was extracted from the source deck. Chart visuals stay in the PDF and as slide images above the post.
Slide 1
TIGZIG US · MACRO ANALYSIS 24 SEPTEMBER 2026
US jobs: the calm before the storm?
The unemployment rate, at 4.1 per cent, and some other measures have eased this year. The Fed calls the economy solid, and several economists called August's jobs report strong. But the pressure built over three years is still there: people are out of work for longer, hiring is near its lowest on record, and payroll jobs for August 2024 and 2025 were each revised down by about a million. And the pressure from outside the job market has not let up.
THE HEADLINE NUMBER Unemployment rate per cent 3.54.1 Jan 2023Aug 2026
Payroll jobs, YoY per cent change on a year 3.20.4 Jan 2023Aug 2026
Out of work 6 months+ per cent of the labour force 0.661.14 Jan 2023Aug 2026
Median time out of work weeks 9.611.4 Jan 2023Aug 2026
Personal saving rate per cent 4.93.0 Jan 2023Jul 2026
Hiring rate per cent of employment 4.13.2 Jan 2023Jul 2026
SourcesFRED, BLS and BEA. Full sources on page two and each page.
Amar Harolikar, ACA · Decision Sciences & Applied AI
1 of 16
tigzig.com
Slide 2
TIGZIG US · MACRO ANALYSIS 24 SEPTEMBER 2026
Where these numbers come from
Six official sources carry most of this deck, each counting a different thing on a different clock.
Why the two job numbers disagree
Payrolls count jobs. The household survey counts people. Someone holding two jobs adds two to the first and one to the second. The household survey is the wider one. It takes in the self-employed, farm work, paid help in homes and people on unpaid leave. Payrolls leave all four out. Neither one is exact. A payroll change has to reach 122,000 before the survey can tell it from noise. A household change has to reach 650,000.
Every series here can be pulled from its original source. Many are also in one place on TIGZIG TREMOR, to chart, overlay, download or pull through an API or MCP.
| Source | Who is counted | How late | Is it revised |
|---|---|---|---|
| CPSThe household survey | About 60,000 households. Counts people, so a second job shows once. | First Friday after the month | Once a year. The seasonally adjusted series, used here, are recut each January over five years. |
| CESThe payroll survey | 119,000 businesses, 622,000 worksites, 26 per cent of payroll jobs. Counts jobs. | Same day as the household survey | Twice in two months, then checked each year against a near census of employers. |
| JOLTSOpenings and turnover | About 21,000 establishments. | Five to six weeks after | Once, the next month. Then pinned to revised payrolls each January. |
| CPIConsumer prices | Prices taken in 75 urban areas. Urban households, no farm or rural. | About two weeks after | The raw index, never. The seasonally adjusted series, used here, is recut each year over five years. |
| BEAThe national accounts | Nobody. An accounting build from Census, BLS, IRS and Treasury data. | About four weeks after | Three cycles. Each month, five years every September, a rebuild every five years. |
| ALFREDEvery figure as first published | Not a survey. The archive of what each series said on the day it came out. | Updated with each release | Never. That is the point: it keeps the versions others overwrite. |
Amar Harolikar · Decision Sciences & Applied AI
2 of 16
tigzig.com
Slide 3
TIGZIG US · MACRO ANALYSIS 24 SEPTEMBER 2026
The Fed and several economists read the same numbers as solid
The Fed raised rates, and economists called August strong.
The Fed, 16 September
What the Fed says What the data shows
"Economic activity is expanding at a solid pace." Real GDP is up 2.1 per cent on a year earlier.
"Job gains have kept pace with the workforce, and the unemployment rate has changed little." The rate has held between 4.0 and 4.5 since 2025. But the workforce is 688,000 smaller than in January, so keeping pace takes fewer jobs.
Economists and strategists on August jobs, 4 September
Payrolls rose 162,000 against about 53,000 expected, the most since March.
"This print was unambiguously strong." Jeff Schulze, Franklin Templeton
"...evidence of a stable labor market..." Jennifer Timmerman, Wells Fargo
"Very strong" on payroll. Jan Hatzius, Goldman Sachs
Labor market clearly not weakening Roger Ferguson, former Fed vice chair
Not all agreed. "The broader trend of labor market rebalancing is still intact," said Tim Urbanowicz of Innovator ETFs. The next pages look at that side.
SourcesFederal Reserve, FOMC statement, 16 Sep 2026. CNBC, 4 Sep 2026: Schulze, Timmerman, Urbanowicz and the Dow Jones payroll forecast from CNBC's round-up of the report; Hatzius and Ferguson as CNBC headlined their interviews (Hatzius, Ferguson). Data from FRED; labour force January to Aug 2026 on one population base.
Amar Harolikar · Decision Sciences & Applied AI
3 of 16
tigzig.com
Slide 4
TIGZIG US · MACRO ANALYSIS 24 SEPTEMBER 2026
The headline numbers look calm, but jobs are being added far more slowly
Job growth has slowed sharply over three years. This year has been better than last, ▶ in months not yet revised.
Payroll jobs millions Jan 2023 Aug 2026 154.8 159.1 ▶
Jobs are at a record 159.1 million.
YoY growth: 3.2 per cent in Jan 2023, 0.07 in Dec 2025, 0.4 now.
Added Jan to Aug: 1.9 million in 2023, 900,000 in 2024, 156,000 in 2025, 643,000 in 2026.
Five months of 2025 lost jobs, four within the margin of error. 2026 has had one, in February.
Unemployment is 4.1 per cent: 3.5 in Jan 2023, 4.3 in January.
Unemployment rate per cent Jan 2023 Aug 2026 3.5 4.1 ▶ Jobs added each month thousands, change on month Jan 2023 Aug 2026 Payroll jobs, YoY per cent change on a year Jan 2023 Aug 2026 3.2 0.4 ▶
SourcesFRED. Unemployment rate from the Current Population Survey, a survey of households; payroll jobs from the Current Employment Statistics survey, a survey of employers; both from the US Bureau of Labor Statistics, seasonally adjusted. The bars are the change on the previous month and the latest two are preliminary. YoY is the per cent change on the same month a year earlier.
Amar Harolikar · Decision Sciences & Applied AI
4 of 16
tigzig.com
Slide 5
TIGZIG US · MACRO ANALYSIS 24 SEPTEMBER 2026
Payroll jobs were revised down by a million, two years running
159,005 First Nov 2024 159,061 Second Dec 2024 159,068 Third Jan 2025 158,358 True-up Feb 2025 157,945 True-up Feb 2026 Payroll jobs for October 2024, counted five times, in thousands.
The last count is 1,060,000 fewer than the first. Both big cuts came at the yearly true-ups, against tax records.
Thousands
First
Today Change
August 2021 147,190 147,314 +124 (+0.08%)
August 2022 152,744 153,362 +618 (+0.40%)
August 2023 156,419 156,261 -158 (-0.10%)
August 2024 158,779 157,757 -1,022 (-0.64%)
August 2025 159,540 158,472 -1,068 (-0.67%)
August 2026 159,075 159,075 not yet
It does not always go this way. Fourteen of the twenty-six Augusts since 2000 now stand higher than first reported. The early estimate of the next true-up, published on 28 August, is a cut of 79,000, far smaller than the last two.
SourcesALFRED, the vintage archive behind FRED, which holds every figure as first published. Payroll jobs, seasonally adjusted, from the Current Employment Statistics survey (CES), US Bureau of Labor Statistics. The staircase is October 2024 counted five times; the table is August of each year. The yearly true-up reconciles the survey against tax records, and August 2026 has not had one.
Amar Harolikar · Decision Sciences & Applied AI
5 of 16
tigzig.com
Slide 6
TIGZIG US · MACRO ANALYSIS 24 SEPTEMBER 2026
Unemployment fell this year, but people are out of work for longer
Fewer people are out of work than at their recent peaks. Those who are out are staying out longer than three years ago, and that has barely eased. Since January 337,000 fewer are unemployed, but 351,000 fewer are in work too, on the household survey. Payrolls show 483,000 more jobs.
How many are out of work
Unemployment rate per cent Jan 2023 Aug 2026 3.5 4.1 ▶ Broad rate, U-6 adds part-timers, discouraged Jan 2023 Aug 2026 6.7 7.7 ▶ Laid off for good per cent of the labour force Jan 2023 Aug 2026 0.78 1.05 ▶
How long they stay out of work
Out of work 15 weeks+ per cent of the labour force Jan 2023 Aug 2026 1.2 1.8 ▶ Out of work 6 months+ per cent of the labour force Jan 2023 Aug 2026 0.66 1.14 ▶ Median time out of work weeks Jan 2023 Aug 2026 9.6 11.4 ▶
SourcesFRED, Current Population Survey, published by the US Bureau of Labor Statistics, seasonally adjusted. The unemployment rate is U-3, the published headline. U-6 adds people working part time who want more hours and people who have stopped looking. Out of work 15 weeks+ is U-1. Laid off for good is permanent job losers still unemployed, a count of people out of work now; JOLTS layoffs on page eight count layoffs in a month. There is no October 2025 reading in any of these series: the survey was not carried out during the government shutdown.
Amar Harolikar · Decision Sciences & Applied AI
6 of 16
tigzig.com
Slide 7
TIGZIG US · MACRO ANALYSIS 24 SEPTEMBER 2026
Job openings are high, but hiring is near its lowest on record
Hiring has been lower than today only during and just after the 2008 financial crisis, for one month in the pandemic, and in February this year.
Job openings 4.4 per cent of employment plus openings 2 3 4 5 6 7 2004 2014 Jul 2026 Hires 3.2 per cent of employment peaks at 6.1 in May 2020, above the top 3.0 3.5 4.0 4.5 2004 2014 Jul 2026
Employers are still advertising, but hiring has slowed to levels last seen after 2008.
SourcesFRED. The Job Openings and Labor Turnover Survey (JOLTS), published by the US Bureau of Labor Statistics, monthly since December 2000. Openings have been lower than today's 4.4 in 226 of 308 months, hires lower than 3.2 in 21. The two rates do NOT share a denominator: openings are a share of employment plus openings, hires a share of employment alone, so they can be read side by side and cannot be subtracted from one another. Ends in Jul 2026.
Amar Harolikar · Decision Sciences & Applied AI
7 of 16
tigzig.com
Slide 8
TIGZIG US · MACRO ANALYSIS 24 SEPTEMBER 2026
People are holding on to the jobs they have
Layoffs have been lower only in 2021 and 2022, when employers were short of workers, and in one month of 2024. People quit about as rarely as in 2014.
Layoffs 1.0 per cent of employment peaks at 8.6 in Mar 2020, above the top 1.0 1.5 2.0 2.5 2004 2014 Jul 2026 Quits 1.9 per cent of employment 1.5 2.0 2.5 3.0 2004 2014 Jul 2026
Slow hiring normally comes with more people losing their jobs. Not this time. Hiring and layoffs this low together did not happen once from 2000 to 2023, and it has happened 13 times since June 2024.
If layoffs are this low, why is "laid off for good" on page six higher than three years ago? Layoffs count people let go each month, and that is flat. Laid off for good counts those still out of work. With hiring slow they stay out longer: the average for everyone unemployed went from 20.4 weeks in January 2023 to 26.3.
SourcesFRED. The Job Openings and Labor Turnover Survey (JOLTS), published by the US Bureau of Labor Statistics, monthly since December 2000. Both rates are a share of employment, and the layoffs series is layoffs and discharges. HOW THE MONTHS ARE COUNTED: hiring at or below 3.3 and layoffs at or below 1.1, a tenth above today's readings so one-decimal rounding cannot decide it, with 2020 excluded because both series leave their range that year. On today's exact readings the count is 2. Ends in Jul 2026.
Amar Harolikar · Decision Sciences & Applied AI
8 of 16
tigzig.com
Slide 9
TIGZIG US · MACRO ANALYSIS 24 SEPTEMBER 2026
Bank of America: the stock boom is fuelling a retirement party
The share of over-55s in the workforce fell from 38.6 per cent in August 2024 to 37.2. If stocks fall, some may come back.
All adults 61.6 per cent in the workforce, 16 and over 62 64 66 2002 2014 Aug 2026 Over 55 37.2 per cent in the workforce 32 36 40 2002 2014 Aug 2026
"Labor force participation is collapsing among older workers. We think the strength of the equity market is partly to blame." Bank of America economists, via CNBC
"An end to the boom-fueled retirement party could pose a risk to the labor market and economy." CNBC, summarising economists
Age plays the larger part. More than 4 million Americans turn 65 each year, and people aged 55 to 64 are more likely to be in the workforce than in 2019.
Sources and methodUS Bureau of Labor Statistics, Current Population Survey, seasonally adjusted via FRED; charts cross yearly population revisions, and 0.6 of the over-55 fall came in January 2026 when BLS revised its population figures. Age: a shift-share split by band (55 to 64, 65 and over), January to Aug each year, puts most of the fall since 2019 on the rising share of over-65s. CNBC, 21 Sep 2026: stock gains fuel retirements (also the 4 million).
Amar Harolikar · Decision Sciences & Applied AI
9 of 16
tigzig.com
Slide 10
TIGZIG US · MACRO ANALYSIS 24 SEPTEMBER 2026
Pay growth slowed, prices sped up
Over the year to Aug 2026, pay growth fell from 4.0 per cent to 3.1 while inflation went from 2.9 to 3.4. The two lines crossed.
-2 +0 +2 +4 +6 +8 Pay growth Price growth Pay 3.1% Prices 3.4% 2008 2011 2014 2017 2020 2023 2026 What moved the gap, over the year
Pay growth slowed 0.89 points
Prices sped up 0.41 points
The gap moved 1.30 points
SourcesFRED. Average hourly earnings for all private employees, from the Current Employment Statistics survey (CES), against CPI for all urban consumers, year on year, both published by the US Bureau of Labor Statistics. The chart draws both from 2008.
Amar Harolikar · Decision Sciences & Applied AI
10 of 16
tigzig.com
Slide 11
TIGZIG US · MACRO ANALYSIS 24 SEPTEMBER 2026
So pay fell behind prices
Private-sector hourly pay has grown more slowly than prices for five months in a row, the first such stretch since 2023, by 0.3 of a point in the latest month.
How far pay growth ran ahead of or behind price growth, percentage points · all private employees, monthly, with Brent below on the same timeline. Shaded stretches are the five episodes, listed on the next page
-4 +4 +8 0 1 2 3 4 5 50 100 Brent, dollars a barrel 2008 2012 2016 2020 2024
Sources and methodFRED. Average hourly earnings for all private employees, from the Current Employment Statistics survey (CES), against CPI for all urban consumers, both from the US Bureau of Labor Statistics. Oil is Brent, monthly averages, published by the US Energy Information Administration and taken from FRED. This is hourly pay against headline prices, and both choices decide the answer: against core prices pay is ahead in all five months, and against weekly pay there is no 2026 stretch. The 2020 spike reflects who was still employed, not pay rises.
Amar Harolikar · Decision Sciences & Applied AI
11 of 16
tigzig.com
Slide 12
TIGZIG US · MACRO ANALYSIS 24 SEPTEMBER 2026
Five times in twenty years
What else was going on. Oil rose in the year before all five, twice as a rebound from a crash rather than a shock.
1 Oct 2007 to Oct 200813 months below, deepest -2.4 points
Oil went from 82 dollars to 133. The financial crisis ran through the same months: recession from December 2007, Lehman in September 2008.
2 Mar 2010 to May 20103 months below, deepest -0.4 points
Gasoline fell 43 per cent in 2008 and came back 54 in 2009, a rebound rather than a shock. Unemployment near 10.
3 Feb 2011 to Apr 201215 months below, deepest -1.9 points
The Arab Spring. Libya's civil war cut its oil output by 60 to 90 per cent and oil went from 104 dollars to 123.
4 Apr 2021 to Apr 202325 months below, deepest -3.6 points
Reopening and supply-chain shortages, then Russia invaded Ukraine. Prices peaked at 9 per cent and core prices at 6.6, which is food and energy stripped out.
5 Apr 2026 to Aug 2026 now5 months below, deepest -0.8 points
A war with Iran shut the Strait of Hormuz. Oil left its old range in March: above 90 dollars on seven trading days in ten since, against a 2024 to 2025 median of 75.
Sources and methodA stretch is three or more months in a row with pay behind prices, and two stretches three months or less apart count as one; the month count is the months below, not the span. Oil is Brent (DCOILBRENTEU), published by the US Energy Information Administration and taken from FRED; the Libya output cut is from EIA, 2011. Dollar figures are monthly averages; seven in ten is 101 of 142 daily closes since 1 March; the latest months are not final. Gasoline, pay and prices are BLS. Prices here are CPI, and that decides the count: against core PCE, the Federal Reserve's own target index, there is one episode in twenty years rather than five.
Amar Harolikar · Decision Sciences & Applied AI
12 of 16
tigzig.com
Slide 13
TIGZIG US · MACRO ANALYSIS 24 SEPTEMBER 2026
Incomes have stopped growing and people are saving less
Income per head is up 0.2 per cent over the year, and spending per head 1.9. Spending has kept going, so people save less.
The same three years, to Jul 2026
Income per person dollars a year, after inflation Jan 2023 Jul 2026 50,353 52,849 ▶ Spending per person dollars a year, after inflation Jan 2023 Jul 2026 46,167 49,288 ▶ Personal saving rate per cent Jan 2023 Jul 2026 4.9 3.0 ▶
On today's figures, which BEA revises heavily, Americans have saved this little in only three other stretches since 1959: a single month in 2001, three months in 2022, and the three years to April 2008, before the financial crisis.
Over the year, spending per head grew 1.7 points faster than income per head. That gap is why saving fell.
SourcesFRED. Saving rate and real disposable income per head, real consumer spending and population all from the Bureau of Economic Analysis. Spending per head is real personal consumption divided by population, built on the same basis as income per head. All three charts are drawn to Jul 2026, the latest month all three have. THE SAVING RATE IS A RESIDUAL between two much larger numbers and BEA revises it heavily: July 2024 was first published at 2.9 and now reads 5.3. The direction holds on any vintage; a single month should not be read too closely.
Amar Harolikar · Decision Sciences & Applied AI
13 of 16
tigzig.com
Slide 14
TIGZIG US · MACRO ANALYSIS 24 SEPTEMBER 2026
Other measures give a more mixed picture
The first two point the same way as the pages before. The other four show a steadier job market: fewer people stuck in part-time work, few being let go, and weekly pay still ahead of prices.
Job openings per unemployed person Jan 2023 Jul 2026 1.79 1.05 ▶ Fewer openings for each person looking, and below the 1.16 of 2018 and 2019.
Continuing claims thousands, still on benefit Jan 2023 Aug 2026 1604 1778 ▶ More people still drawing unemployment benefit, though fewer than last year.
Part time, want full time millions Jan 2023 Aug 2026 4.0 4.4 ▶ Below the 4.6 million of 2018 and 2019, and down from 4.8 a year ago.
New claims thousands a week Jan 2023 Aug 2026 204 206 ▶ No lasting rise, and below the 219 thousand of 2018 and 2019.
Pay minus prices weekly pay, points Jan 2023 Aug 2026 -1.53 0.34 ▶ Ahead of prices from June 2023. Behind in April and May, just ahead now.
Hourly pay minus core points Jan 2023 Aug 2026 -1.05 0.64 ▶ Against prices without food and energy, ahead every month since August 2023.
Sources and methodFRED, from the US Bureau of Labor Statistics and the Department of Labor. Job openings per unemployed person is JOLTS openings over the unemployed, to Jul 2026. Claims are weekly filings to state programmes, averaged by month. Part time, want full time is people working part time for economic reasons. Pay minus prices is year-on-year growth in average weekly earnings (CES0500000011) less CPI inflation; the core panel is average hourly earnings (CES0500000003) less core CPI. All charts run from Jan 2023, with no October 2025 household reading (shutdown).
Amar Harolikar · Decision Sciences & Applied AI
14 of 16
tigzig.com
Slide 15
TIGZIG US · MACRO ANALYSIS 24 SEPTEMBER 2026
My read
Labour is under pressure, and that is one part of a bigger story. The pressure runs across the economy, the markets and geopolitics, and the pieces are listed on the next page. My read is that, unless something changes drastically, we are moving fairly rapidly towards a tipping point, and not only for the US economy.
Long rates are going up, and the Fed raised rates in September. The US thirty year is 5.3 per cent, a level last seen in 2007, and it sets mortgages, refinancing and government borrowing alike.
Credit is under pressure, and deteriorating in parts. The household, bank and credit union data I track each show it differently.
Private credit is the new risk, and not only for banks. Banks have 2.8 trillion dollars committed to non-bank financial firms, Fitch puts defaults at a record 6.3 per cent, and life insurers hold a great deal of it.
The AI build has turned cash negative. Three of the five hyperscalers had negative free cash flow in the June quarter.
Valuations are close to their record. The Shiller CAPE is 40.6, higher in only nineteen months since 1881. It was 27 before the 2008 crash.
Inflation has not gone and the war keeps oil up. Core PCE is 3.34 per cent against a 2 per cent target, and Brent has been above 90 dollars on seven trading days in ten since March.
The people who run the money are saying it too. Dimon says a credit recession would be worse than people think, and the FSB chair told the G20 that leverage and AI cross-investment could amplify a correction.
Amar Harolikar · Decision Sciences & Applied AI
15 of 16
tigzig.com
Slide 16
TIGZIG US · MACRO ANALYSIS 24 SEPTEMBER 2026
My previous analyses
Each pressure behind this story has its own piece.
Macro and rates Sep 2026 Bond markets are sounding an alarm
Sep 2026 Macro charts back at their 2007 levels
Sep 2026 The Fed is caught
Consumer and bank credit Sep 2026 Credit unions, losses above pre-crisis
Aug 2026 NY Fed household debt, Q2 2026
Private credit and non-bank lending Aug 2026 US banks, 2.8 trillion committed to non-banks
May 2026 Private credit. A market for lemons
May 2026 Red flag in US life insurance
Valuations and the AI build Aug 2026 A correction in AI valuations looks more likely
Jul 2026 Three warnings on the AI valuation boom
May 2026 S&P at 7,400. Irrational exuberance
What the regulators are saying Sep 2026 The FSB chair is not hedging
Jun 2026 The BIS red-flagged the AI boom
All of my analysis tigzig.com/analysis
Amar Harolikar · Decision Sciences & Applied AI
16 of 16
tigzig.com
Working on something similar? How I work covers the rates, the availability and what I take on.