Bond Markets Are Sounding an Alarm. The US Thirty Year Is at 5.25 Per Cent and the Fed Has Been Cutting Through All of It.
Published: September 6, 2026
Bond markets are sounding an alarm, and combined with all the other negative forces in play, this has the potential to run a lot deeper than a higher interest bill, into recessions and corrections across asset classes.
The US thirty year is at 5.25 per cent, and before this year it had not been above 5.2 since 2007. Europe and Japan are moving the same way at the same time.
The Fed has been cutting its own rate through all of this, the last one in Dec 2025. Short term rates came down with it ...but long term rates went up anyway, by 106 basis points on the ten year and 122 on the thirty year.
It is the long rate that sets a mortgage, a corporate refinancing and a project that takes years to pay for itself. There is direct impact on households, companies, and governments.
Interest rates is a single issue .. the problem is the combination of pressure factors playing out at the same time - from valuations and AI debt to delinquencies, charge-offs, oil, inflation, private credit, employment... and all the geo-political tensions
Analysis attached.
For prior analysis: tigzig.com/analysis
The Fed is in a very tight spot going into the September meeting
The Fed is in a very tight spot going into the meeting on 15 and 16 September.
Kevin Warsh is Trump's own pick for the chair. At Jackson Hole in August he said the Fed still has work to do on inflation, and the market read it as hawkish. Odds of a hike moved from about a third to just under 60 per cent on the CME FedWatch tool.
The administration has spent the past week pressing publicly for the opposite. The President, the Vice President and the Treasury Secretary have all argued that rates should be coming down.
Inside the committee the pressure runs the other way. Three members dissented in July wanting a rise.
So the chair who was appointed with lower rates in mind is being pushed towards higher ones by his own committee and by the inflation numbers, while the people who appointed him are asking publicly for cuts.
What I have written on these as the data came along
On valuation, the pattern math pointed the same way.
- S&P 500, irrational exuberance at 7400
- S&P 500 at an all-time high, cracking underneath, and the October 2007 parallel
On private credit, the default rate is at a record and a growing share of the lending now sits outside the banks.
- Jamie Dimon's six warnings
- Private credit, a market for lemons
- US banks and their lending to non-banks, Q2 2026
On delinquencies and charge-offs, several consumer measures are past their 2007 levels, and the most recent quarterly data came out in August.
And on the AI build, which is financed on debt.
Bond Markets Are Sounding an Alarm
Browse the slides or download the PDF
Full Deck Content (Text Format)
Text below was extracted from the source deck. Chart visuals stay in the PDF and as slide images above the post.
Slide 1
TIGZIG MACRO ANALYSIS
Bond markets · September 2026
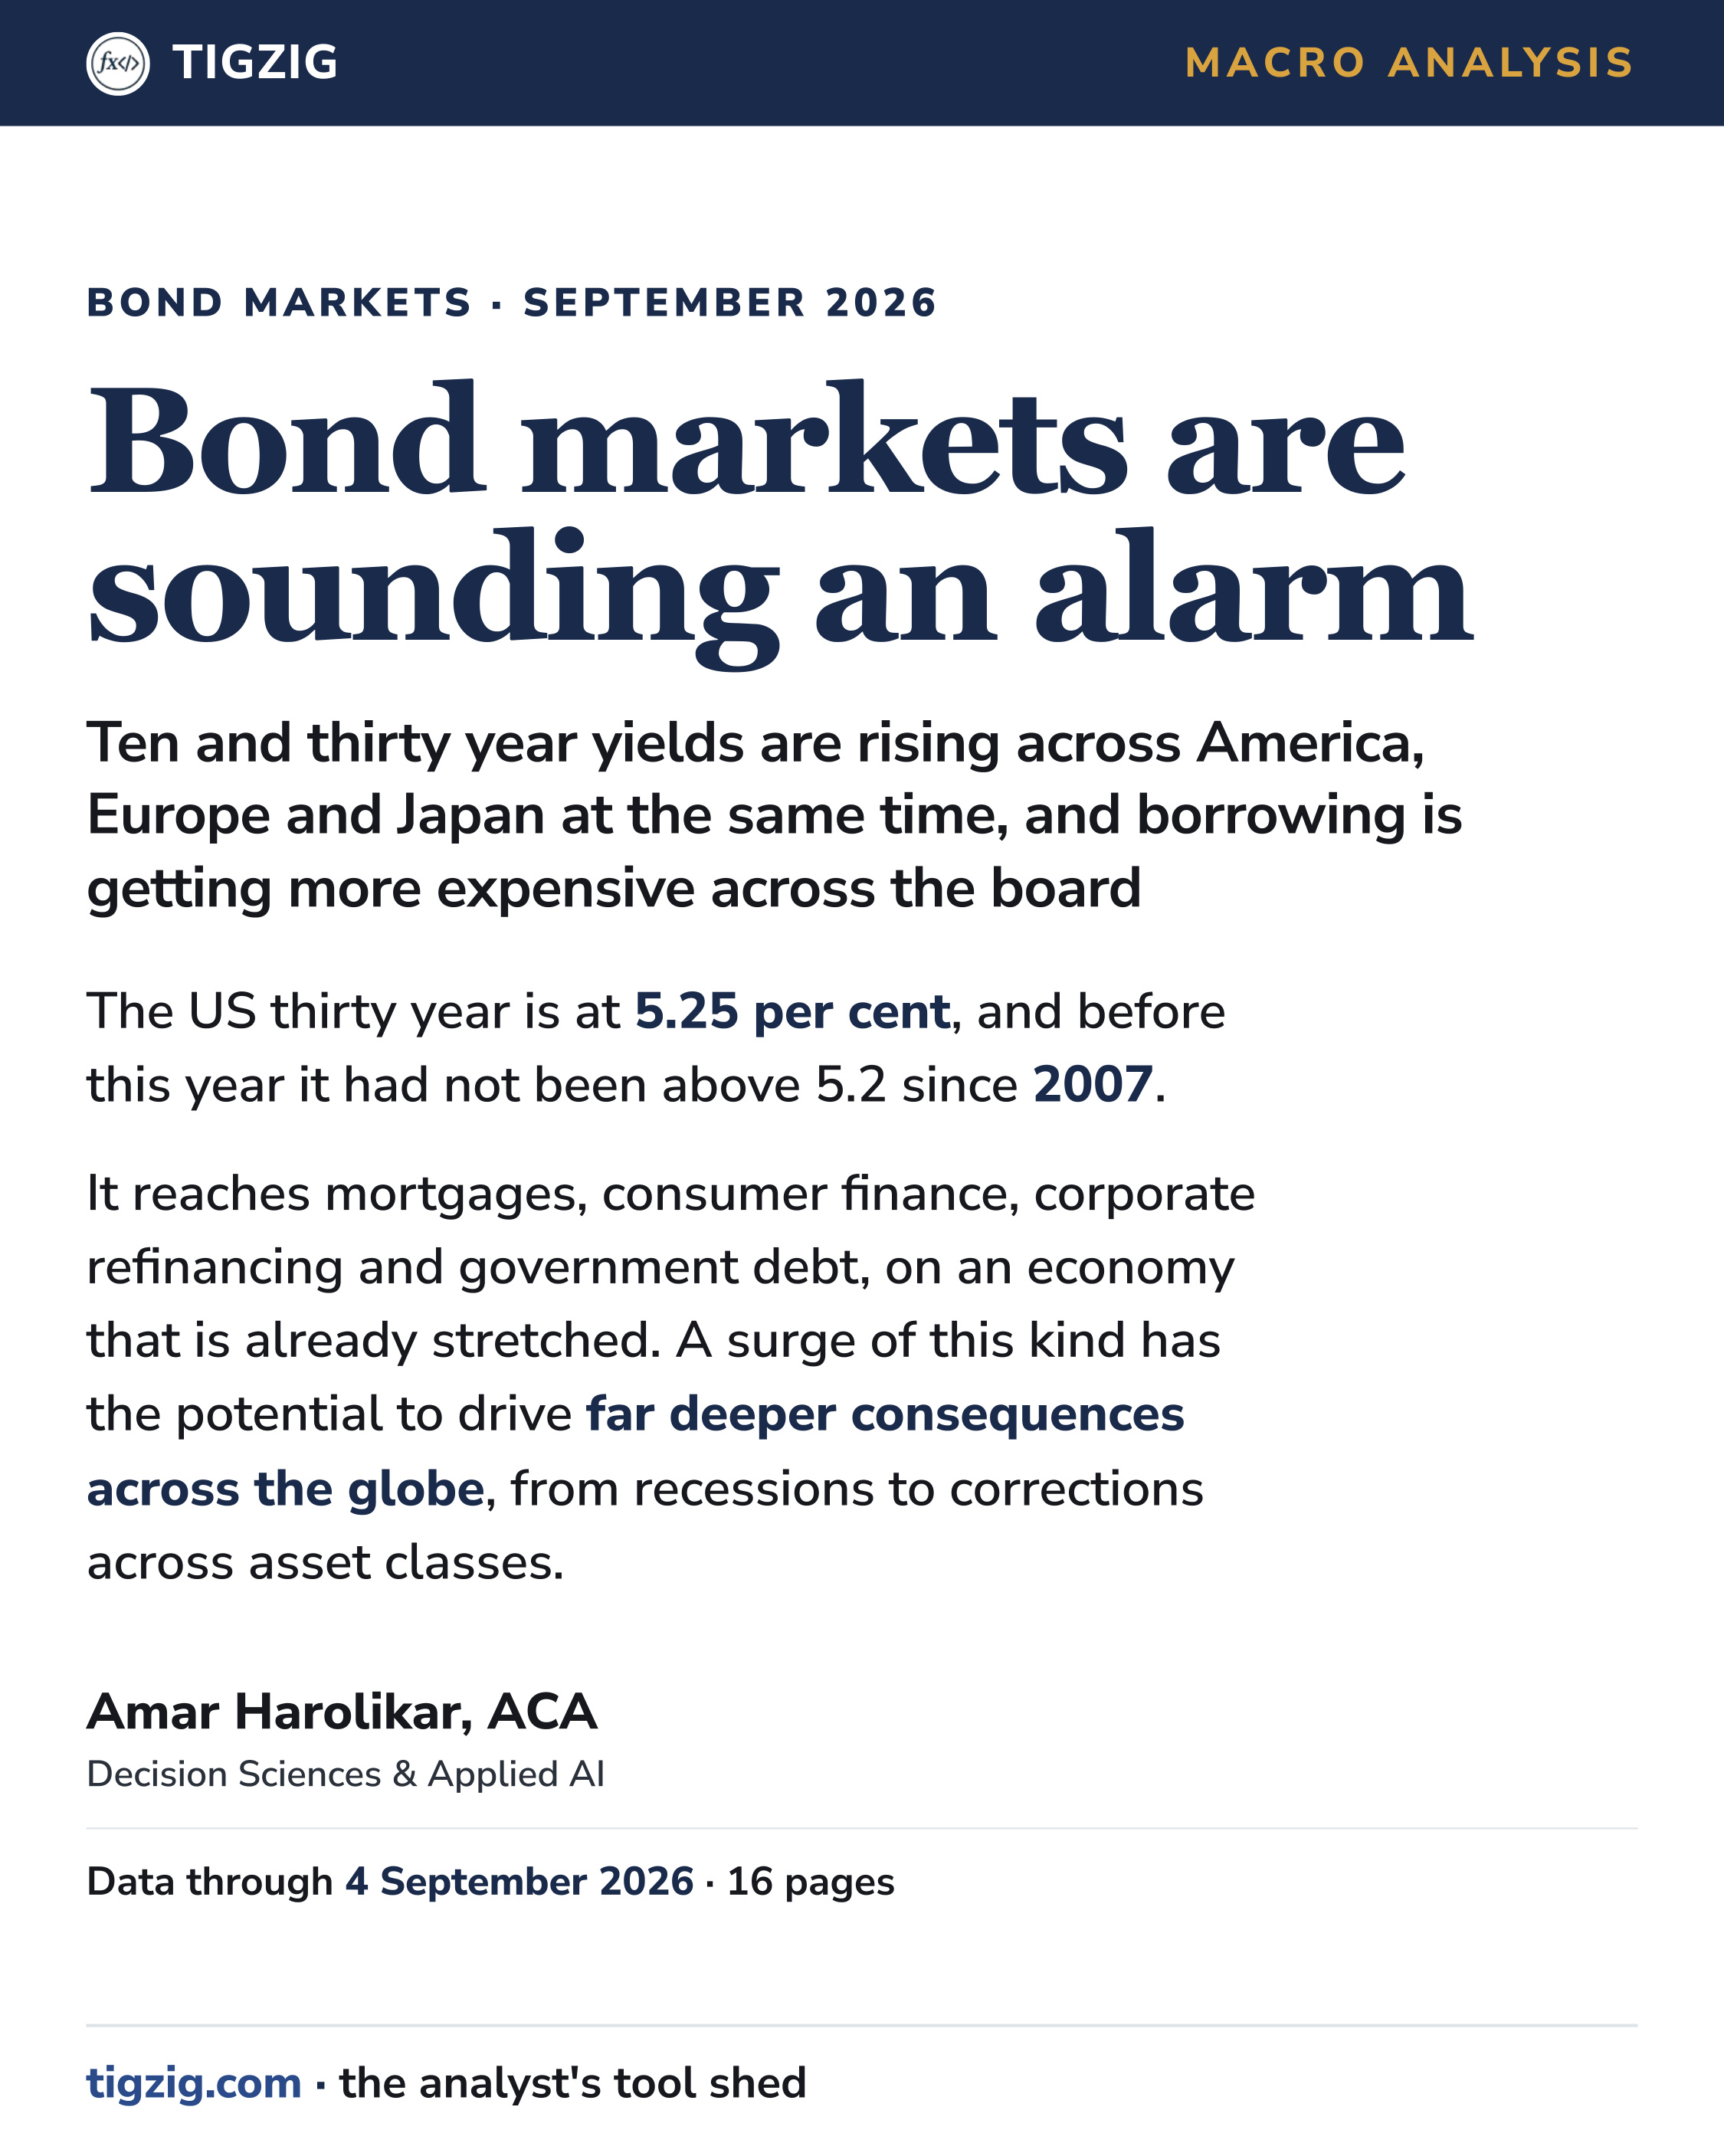
Bond markets are sounding an alarm
Ten and thirty year yields are rising across America, Europe and Japan at the same time, and borrowing is getting more expensive across the board
The US thirty year is at 5.25 per cent, and before this year it had not been above 5.2 since 2007.
It reaches mortgages, consumer finance, corporate refinancing and government debt, on an economy that is already stretched. A surge of this kind has the potential to drive far deeper consequences across the globe, from recessions to corrections across asset classes.
Amar Harolikar, ACA
Decision Sciences & Applied AI
Data through 4 September 2026 · 16 pages
tigzig.com** · **the analyst's tool shed
Slide 2
tigzig.comIn short
The whole thing in six lines
Everywhere at once. Long term government bond yields have been rising in the United States, the United Kingdom, Germany and Japan at the same time
The gap. Since the Fed started cutting, the US ten year is up 106 basis points and the thirty year is up 122, while the Fed cut its own target range by 175
Who sets what. The Fed sets the short rate and the market sets the long one, and it is the long one that mortgages and corporate borrowing follow
Three forces. Inflation that may be structurally higher, an oil shock, and buyers stepping back from government debt
Who pays. It reaches borrowers of every kind, households and companies and governments, and the AI data centre build, which is financed on debt
Not a straight line. The long end has climbed and reversed twice in three years, so this is a rising floor, with reversals along the way
Amar Harolikar** · **tigzig.com
02 / 16
Slide 3
tigzig.comWhat is happening
What is happening
Long money is getting dearer
The US ten year is at 4.79% and the thirty year at 5.27%. The ten year is back where it stood in October 2023, and it got there while the Federal Reserve was cutting.
4.0
4.5
5.0
5.5
5.26% 30 year
4.78% 10 year Jan 24 Jul 24 Jan 25 Jul 25 Jan 26 Jul 26 Per cent, monthly average
US Treasury yields, ten and thirty year. Chart: ours, FRED series via TREMOR
These two rates set the floor under a mortgage, a corporate bond and a project loan. When they move, everything with a long life reprices behind them.
The last two cuts: 29 October 2025 and 10 December 2025, both 25 basis points, taking the target range to 3.50% to 3.75%. There has been no cut since, and at the July 2026 meeting three members wanted a rise.
SourcesYields ours, FRED series via TREMOR, daily to 3 September 2026. Rate decisions from the Federal Reserve
Amar Harolikar** · **tigzig.com
03 / 16
Slide 4
tigzig.comWhat is happening
And it is not only America
The same move, three markets
The major developed bond markets have moved the same way at the same time. That makes a purely American explanation unlikely.
Each line runs September 2024 to September 2026, the same window throughout United States 3.72% to 4.78%
+106 bp United Kingdom 3.87% to 5.22%
+135 bp Germany 2.21% to 3.36%
+115 bp
Sep 2024 Sep 2026
Ten year government bond yields, each scaled to its own range. Chart: ours. US from FRED, UK from the Bank of England, Germany from the Bundesbank, all via TREMOR
CNBC reports Japan above 3% for the first time since 1996, the UK gilt at a post-2008 high and the German Bund at levels last seen in 2011.
SourcesUS, UK and Germany ours via TREMOR. Japan from CNBC, 4 September 2026
Amar Harolikar** · **tigzig.com
04 / 16
Slide 5
tigzig.comThe transmission
The transmission
The cut did not reach the borrower
A central bank cuts so that the cheaper money travels down the curve and reaches the rates households and companies actually pay. Since September 2024 the Fed has cut its target range by 175 basis points. The mortgage rate went up.
3.5
4.0
4.5
5.0
5.5
6.0
6.5
7.0
6.71% 30y mortgage
4.78% 10y Treasury
3.63% Fed funds Jan 25 Jul 25 Jan 26 Jul 26 Per cent, monthly average, from the month the Fed started cutting
Fed funds, the ten year and the thirty year mortgage, from the month the cutting began. Chart: ours, FRED series via TREMOR
The Federal Reserve sets the overnight rate. Ten and thirty year money is priced by the market, and the market has moved the other way.
SourcesOurs, FRED series via TREMOR. The mortgage rate is the Freddie Mac survey, weekly to 3 September 2026
Amar Harolikar** · **tigzig.com
05 / 16
Slide 6
tigzig.comWhat changed
What changed
One measure went the other way
The extra yield companies pay over their government has narrowed while long term borrowing costs rose. That reads oddly next to rising delinquencies and private credit markdowns.
United States, change since September 2024, basis points fell rose 3 month Treasury
-101 10 year Treasury
+106 30 year Treasury
+122 30 year mortgage
+53 Corporate spread
-12 Fed funds rate
-150
Short money got cheaper. Long money got dearer
The credit spread is Moody's Baa against the ten year. Fed funds is the effective rate, which moves less than the target range
The OECD looked at this. Corporate fundamentals did improve, and on their own they do not explain it. Government debt itself got riskier, which lifts the benchmark the spread is measured against, and bonds got easier to trade as index funds and trading firms grew, which shrinks what buyers charge for liquidity.
SourcesChart ours, FRED series via TREMOR. Interpretation from the OECD Global Debt Report 2026
Amar Harolikar** · **tigzig.com
06 / 16
Slide 7
tigzig.comWhy
Why · part one
Several things are pushing at once
No single cause explains this. Three forces are working at the same time.
01 Inflation may be structurally higher
A pivot away from globalisation and towards protectionism, geopolitical tension, trade tariffs, industrial reshoring and higher defence spending. Investors read these as durable pressures, and the Fed itself is split. At its July 2026 meeting it held rates on a 9 to 3 vote, and all three dissenters wanted a rise.
Emma Moriarty, CG Asset Management, via CNBC · FOMC minutes, July 2026
02 Oil
Brent jumped after the United States and Iran traded strikes and has been trading around 95 dollars against an August average of 88. Oil feeds into transport, food and manufacturing, so a jump lifts expected inflation right along the chain.
CNN · Brent front month via TREMOR
SourcesCNBC, 4 September 2026 and FOMC minutes, July 2026
Amar Harolikar** · **tigzig.com
07 / 16
Slide 8
tigzig.comWhy
Why · part two
The third one, and a check on it
03 The buyers are stepping back
Norway's fund proposes cutting Treasuries from 34.1% to 21.9% of its bond holdings. Mohamed El-Erian says issuance from governments, hyperscalers and companies now exceeds what you can count on in reliable buyers, and that this is more about imbalance than about inflation.
Mohamed El-Erian · Norges Bank Investment Management
A different view on the third one
If foreign official buyers were walking away from dollar assets, that would explain a lot. The New York Fed tested it. The dollar's share of official reserves did fall from 64% to 56% over ten years, but they find that is a handful of large holders, with the broad cross section of countries largely unchanged.
Federal Reserve Bank of New York
SourcesNorway, CNBC 4 Sep, El-Erian, CNBC 4 Sep and Liberty Street Economics
Amar Harolikar** · **tigzig.com
08 / 16
Slide 9
tigzig.comThe caution
The caution
It has turned twice before
This is the third climb in three years, and the first two both reversed. What has changed is the floor each one starts from.
3.5
4.0
4.5
5.0
5.5
5.26% 30 year
4.78% 10 year
3.72%
4.06% Jan 24 Jul 24 Jan 25 Jul 25 Jan 26 Jul 26 Per cent, monthly average. Circles mark the two ten year troughs
US Treasury yields, ten and thirty year, monthly average. Chart: ours, FRED series via TREMOR
The ten year bottomed at 3.72% in September 2024 and at 4.06% in October 2025. The thirty year bottomed at 4.04% and then 4.64%. This pattern holds for the long maturities and not for the two year, whose second trough was lower than its first, because the two year tracks what the Fed is expected to do rather than the cost of long money.
SourcesOurs, FRED series via TREMOR. All of these are free to download at tigzig.com under TREMOR
Amar Harolikar** · **tigzig.com
09 / 16
Slide 10
tigzig.comWho pays
Who pays · part one
Households
Higher long yields pass into mortgages, car loans and other household credit, and the burden is not shared evenly. A household already spending a large share of its income on debt feels a higher payment immediately. A household with savings earns more on them.
"That long end of the curve is really important because it drives the cost of capital, not just for companies, but people with mortgages, the housing market."
Larry Holzenthaler · senior portfolio manager, Catalyst Funds
It arrives slowly, as fixed rate loans mature and people refinance. If it pushes spending down at the lower end, the effect spreads into the wider economy.
SourcesMortgage rate ours, FRED series via TREMOR. Quote from CNBC, 3 September 2026
Amar Harolikar** · **tigzig.com
10 / 16
Slide 11
tigzig.comWho pays
Who pays · part two
Companies
When a bond matures, a company either repays it or issues a new one in its place. Where it borrows again, the new debt is priced at whatever the market charges that day. So a higher long yield reaches a company slowly, and then in one step when a large maturity arrives.
The OECD counts 59.5 trillion dollars of corporate debt outstanding at the end of 2025, and a record 13.7 trillion raised during the year alone.
"The pressure points are the most leveraged ones that are accustomed to free money."
Masahiko Loo · State Street Investment Management, on commercial real estate, private equity backed companies, direct lending portfolios and lower quality software businesses
Smaller companies feel it sooner. They carry more floating rate debt than large ones, so their interest bill climbs along with the market as it moves.
SourcesOECD Global Debt Report 2026 and CNBC, 3 September 2026, where the small caps point is Thomas Browne of Keeley Teton Advisors
Amar Harolikar** · **tigzig.com
11 / 16
Slide 12
tigzig.comWho pays
Who pays · part three
And the AI build is financed on debt
The OECD puts planned capital spending by the nine hyperscalers at 4.1 trillion dollars between 2026 and 2030. Capital spending by every non-financial company in the United States came to just over 3 trillion in 2025. Private credit is expected to supply 800 billion dollars of the AI build over four years.
"You have an enormous amount of debt being issued to fund different AI projects, and the issuers of that debt are fairly price insensitive."
Larry Holzenthaler · senior portfolio manager, Catalyst Funds
1 That borrowing competes with governments and other companies for the same buyers
2 And at a higher rate, a data centre has to earn more to be worth building. Some will not
This is where the two stories meet.
The AI valuation case rests on cash flows arriving from 2028, and the build that is meant to produce them is being financed at a rate that keeps going up.
SourcesOECD Global Debt Report 2026 and CNBC, 3 September 2026
Amar Harolikar** · **tigzig.com
12 / 16
Slide 13
tigzig.comWho pays
Who pays · part four
Governments
Sovereign debt loads are already high, and every maturing bond refinances at the new rate. Japan carries government debt above 200% of its economy, with debt service estimated at more than a quarter of government spending this fiscal year.
A government that pays more to service its debt has less to spend on everything else, or it borrows more, which brings it back to the same market. Emerging markets running twin deficits are exposed twice over, because higher global yields lift their borrowing costs and their funding risk together.
"The most vulnerable sovereigns are those combining large fiscal deficits, elevated debt burdens and reliance on external capital. France stands out among developed markets."
Masahiko Loo · senior fixed income strategist, State Street Investment Management
SourcesCNBC, 3 September 2026
Amar Harolikar** · **tigzig.com
13 / 16
Slide 14
tigzig.comMy read
My read
Why this combination worries me
The bond market is sending a very strong message.
What concerns me is the combination. Yields that keep climbing, oil higher again, inflation that may be structurally higher, and an AI build financed on debt. It arrives on an economy already under pressure, on employment, on layoffs, on delinquencies and charge-offs, and on private credit.
And on top of all of it, valuations that in 145 years have been higher only at the dot-com peak.
A surge of this kind, with everything else already in place, has the potential to drive far deeper consequences across the globe, from recessions to corrections across asset classes.
In the market since before the dot-com boom, through both crashes. Ex derivative trader (full time, proprietary account).
Amar Harolikar** · **tigzig.com
14 / 16
Slide 15
tigzig.comEarlier
Earlier
My previous analyses
Each pressure behind this story has its own piece.
Macro and rates
Mar 2026 Are we headed for stagflation lite?
May 2026 Three red flags hit together
Apr 2026 The crisis in auto loans
Valuations
May 2026 S&P at 7,400. Irrational exuberance
Apr 2026 S&P at an all time high, cracking underneath
Private credit and non-bank lending
May 2026 Private credit. A market for lemons
Aug 2026 US banks, 2.8 trillion committed to non-banks
Consumer and bank credit
Jun 2026 US credit unions at GFC era loss rates
Jun 2026 Unemployment is 4.3%. What sits underneath it
The AI build
Jun 2026 The BIS red-flagged the AI boom
Aug 2026 A correction in AI valuations looks more likely
All of my analysis, free to read
Amar Harolikar** · **tigzig.com
15 / 16
Slide 16
tigzig.comSources
Sources
Where all of this comes from
Federal Reserve FOMC minutes, 28 to 29 July 2026
New York Fed Are central banks moving out of dollar assets?
OECD Global Debt Report 2026, corporate debt market outlook
CNBC The higher rate era and who pays, 3 Sep
CNBC The structural inflation argument, 4 Sep
CNBC El-Erian on the sell-off, 4 Sep and Norway cutting Treasuries, 4 Sep
CNN Business Global bonds sell off as Middle East conflict escalates, 1 Sep
Our own data FRED, Bank of England and Bundesbank, via tigzig.com → TREMOR
The series in these charts, free to download
tigzig.com → TREMOR
Amar Harolikar** · **tigzig.com
16 / 16
Working on something similar? How I work covers the rates, the availability and what I take on.