US Unemployment Is 4.3%. The Stuff Underneath Says Otherwise. 2M Jobless Over Six Months, Up 3 Straight Years.
Published: June 11, 2026
US unemployment is 4.3%. The curve even looks like it is calming down. The data underneath says otherwise. 2 million Americans have now been jobless for more than half a year. Nearly double of early 2023. Three straight years of rising, with no give-back.
The headline moved 3.5% to 4.3% during that time. When long-term unemployment pulls away from the headline like this, that is the 2008 pattern. Covid never had this shape, rehiring was too fast. This one is a slow grind.
It also fits the picture from my last week's note: consumer sentiment at a 73-year low, valuations near 145-year highs.
And the question I keep coming back to: is AI doing to the jobless floor what dot-com did? Too early to call. Watching it.
Analysis, tools and early warning indicators at: tigzig.com
US Labour Market Note - 5-Slide Deck
Browse the slides or download the PDF
Full Deck Content (Text Format)
Text below was extracted from the source HTML the PDF was rendered from. The 5 slide images above are the visual.
Slide 1 - The 4.3% is hiding a problem
US unemployment · May 2026 data
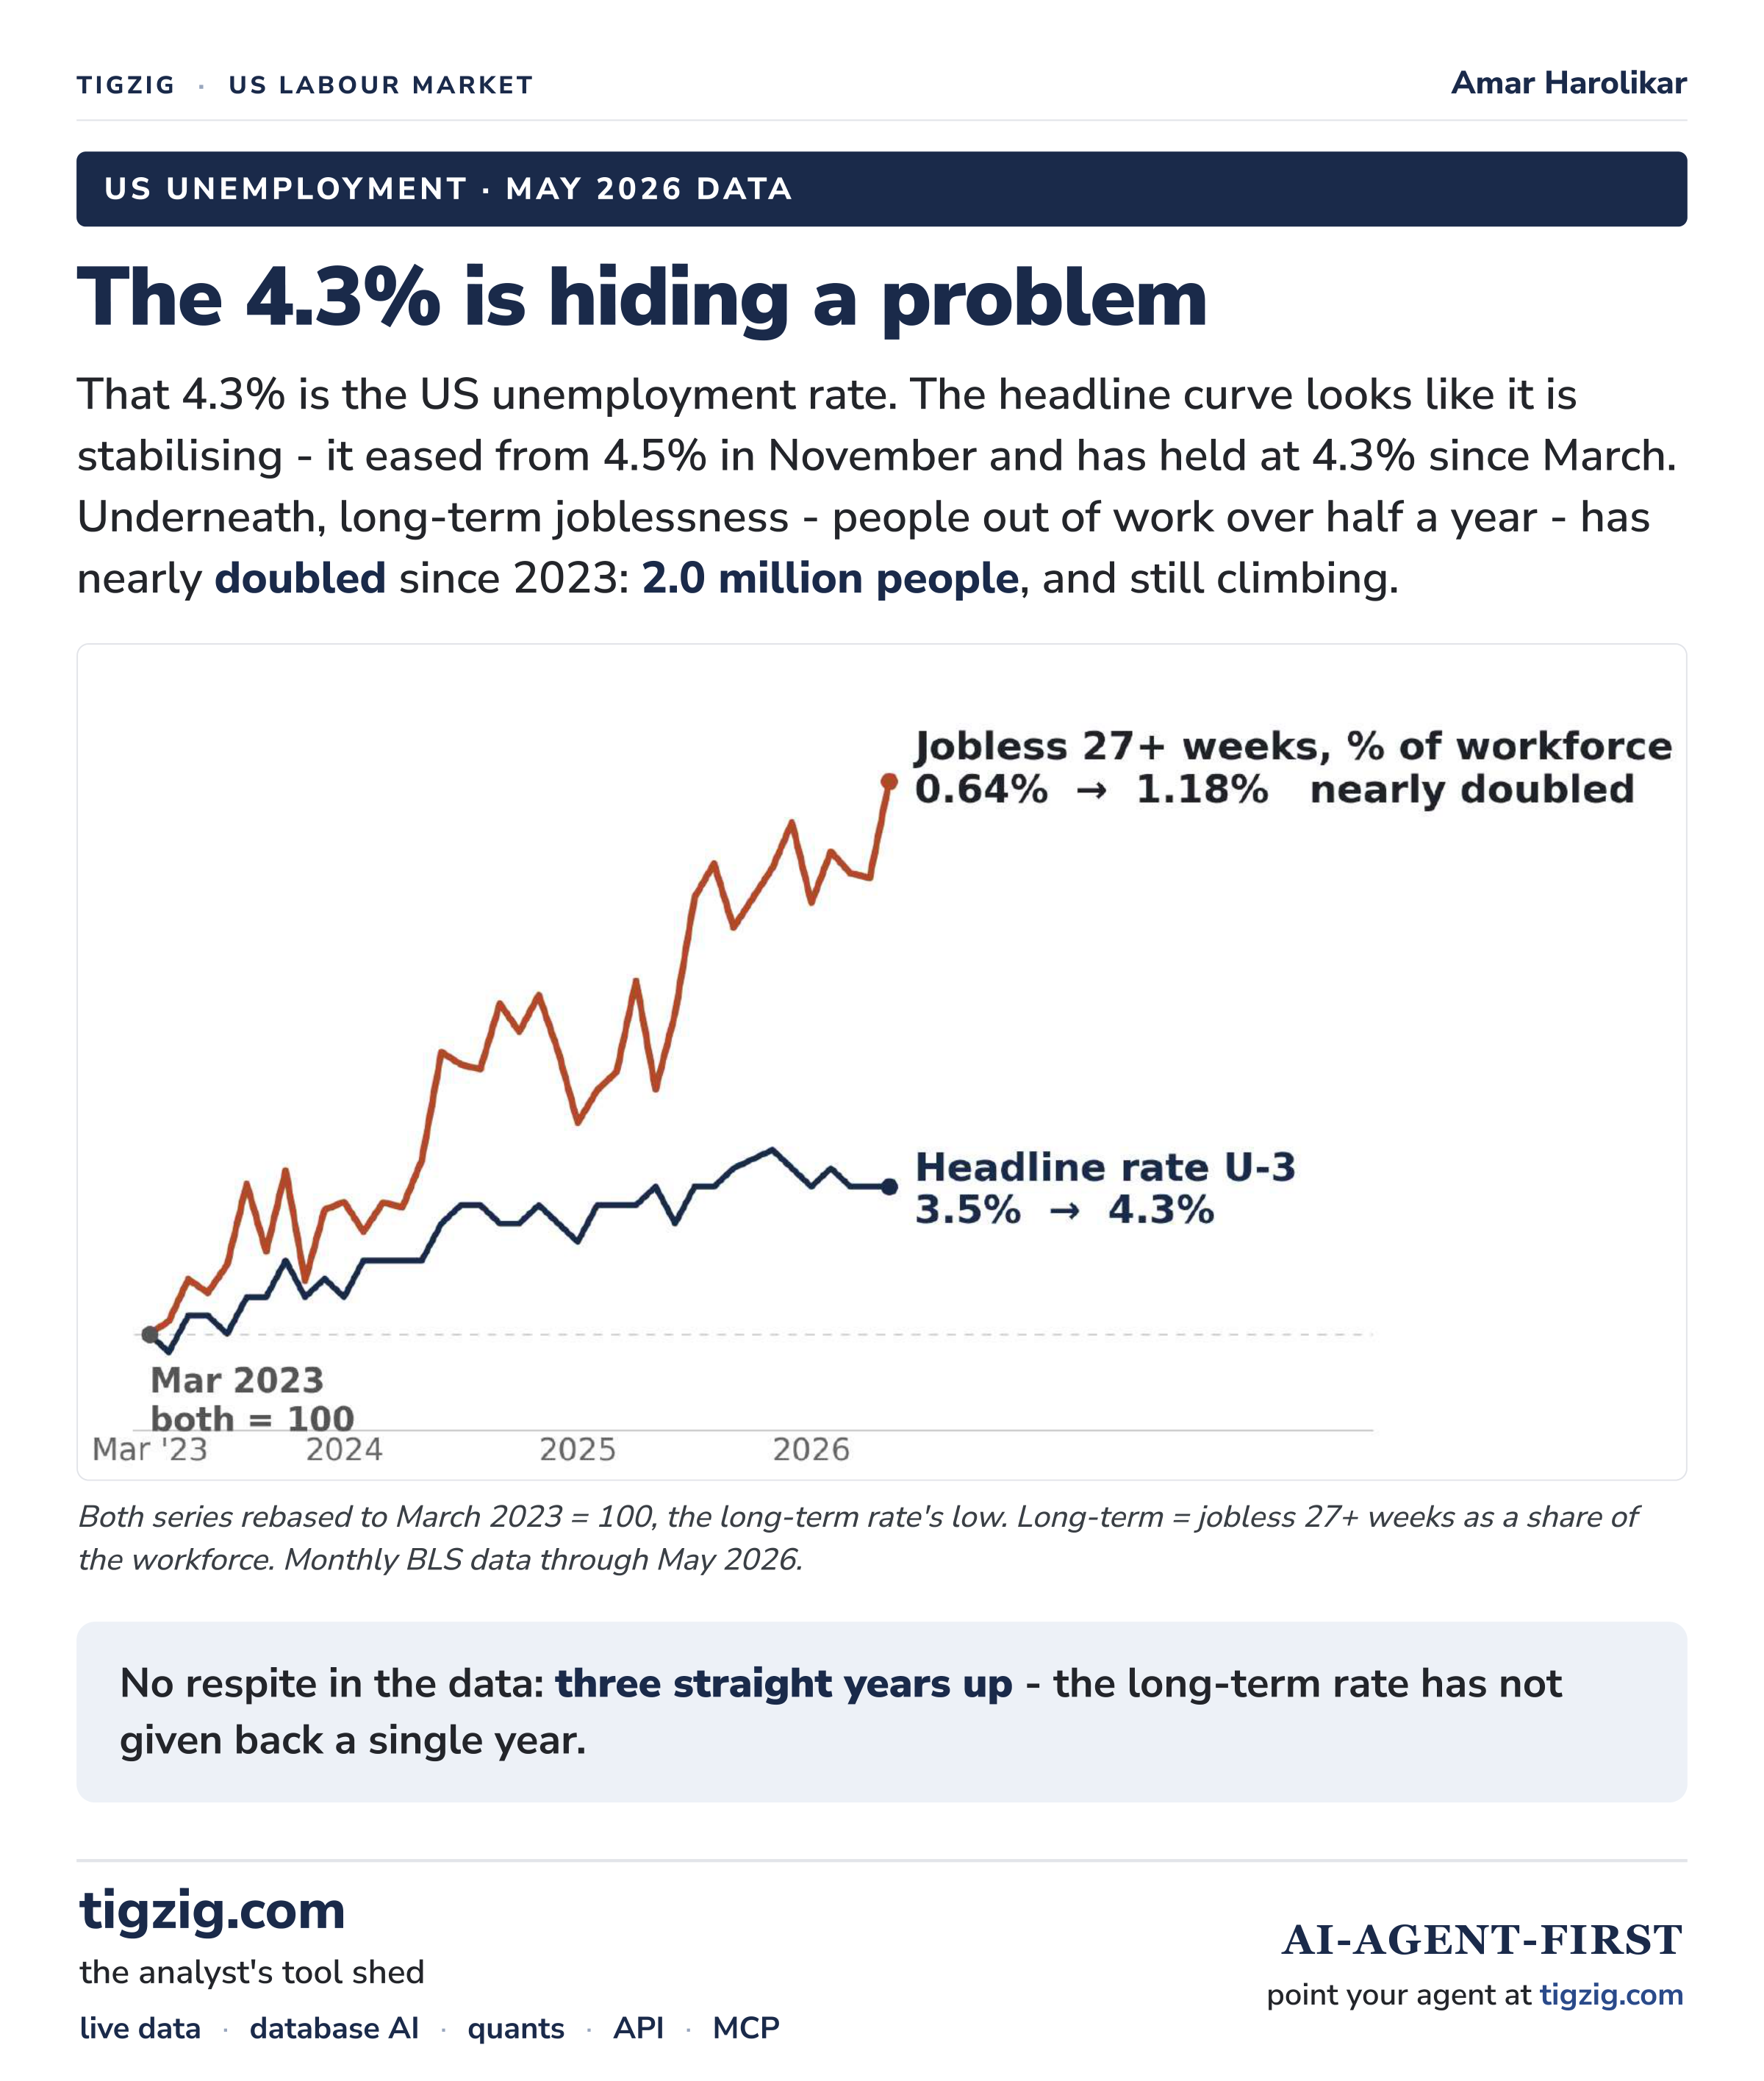
That 4.3% is the US unemployment rate. The headline curve looks like it is stabilising - it eased from 4.5% in November and has held at 4.3% since March. Underneath, long-term joblessness - people out of work over half a year - has nearly doubled since 2023: 2.0 million people, and still climbing.
Chart: long-term unemployment rate vs headline U-3, both rebased to March 2023 = 100 (the long-term rate's low). Long-term = jobless 27+ weeks as a share of the workforce. Monthly BLS data through May 2026.
No respite in the data: three straight years up - the long-term rate has not given back a single year.
Slide 2 - We have seen this shape before
Angle 1: the crisis signature
Chart: headline U-3 (navy) and the long-term rate (terracotta), both rebased to January 2006 = 100. Shaded bands = recessions.
Into 2008 the long-term line did not just rise - it towered over the headline, about 6x its pre-crisis level while U-3 only doubled. That divergence is the signature of a market where people stop getting re-hired.
Covid was the exception: millions did cross 27 weeks, but rehiring was so fast the surge unwound within about a year. Today's rise has the slow-grind 2008 shape.
The gap is opening again - with no recession to blame. That is the red flag.
Slide 3 - The mix is moving to the part that scars
Angle 2: composition
Chart: every unemployed person, split by how long they have been jobless. Each month adds to 100%. The terracotta band (27+ weeks) is the story.
When the terracotta band widens, it means the people who lost their jobs months ago are still searching - re-hiring has stalled. That is exactly what it has been doing since 2023.
The long-term share fell to 17.8% after Covid (Feb 2023). It is back to 27.5% now. The GFC extreme was 45.5%.
Short-term unemployment is healthy churn. Long-term is the part that scars - skills fade, employers screen it out. More than one in four of the unemployed are now past that line.
Slide 4 - Is AI the next dot-com?
Angle 3: the structural question
Chart: the long-term rate (grey line) with its average in each calm stretch between crises (terracotta bars). One step up, then a 15-year plateau.
Measured against the whole workforce, long-term joblessness has stepped up once in 25 years: from 0.53% to 0.81% in the dot-com era, when work moved to the web. The GFC and Covid spiked and fell back - cyclical episodes, both of them.
This cycle has not played out: 1.18% in May and still rising - it has not topped out, let alone settled.
Too early to call. The test comes when this cycle finally turns: does the rate settle back near 0.8%, or on a new, higher floor? That is the chart to watch.
Slide 5 - Previous analysis, data tools, sources & method
Previous analysis - this series
- Markets at a record while the economy hurts - peak valuations, record-low consumer sentiment. 8 Jun 2026.
- Irrational exuberance: S&P at 7,400 - the last two times this setup held, the index halved. 17 May 2026.
- Are we headed for stagflation-lite? - the Fed caught between inflation and weak jobs. 28 Mar 2026.
The data tools
- U-1 (15+ weeks), U-3 and U-6 are live on tigzig.com → Tremor - a macro early-warning dashboard, 100+ indicators with validation built in. The 27+ duration series came via FRED.
- Agent-first portal with MCP servers and free APIs: agents.tigzig.com - point your AI at it.
Sources & method
- BLS household survey, via FRED: U-3
UNRATE· durationUEMPLT5UEMP5TO14UEMP15T26UEMP27OV(27+ wks = "long-term"). Pulled 10 June 2026; cross-checked to the BLS Employment Situation. - 27+ share = long-term ÷ total unemployed. 27+ rate = long-term ÷ workforce.
- BLS seasonally adjusts each duration series independently, so the buckets sum to total unemployment with a small residual. The survey samples ~60,000 homes, so single months are noisy. October 2025 has no reading (government shutdown).