Foreign Buying of US Stocks Hit a Record. Then July Went Quiet.
Published: September 28, 2026
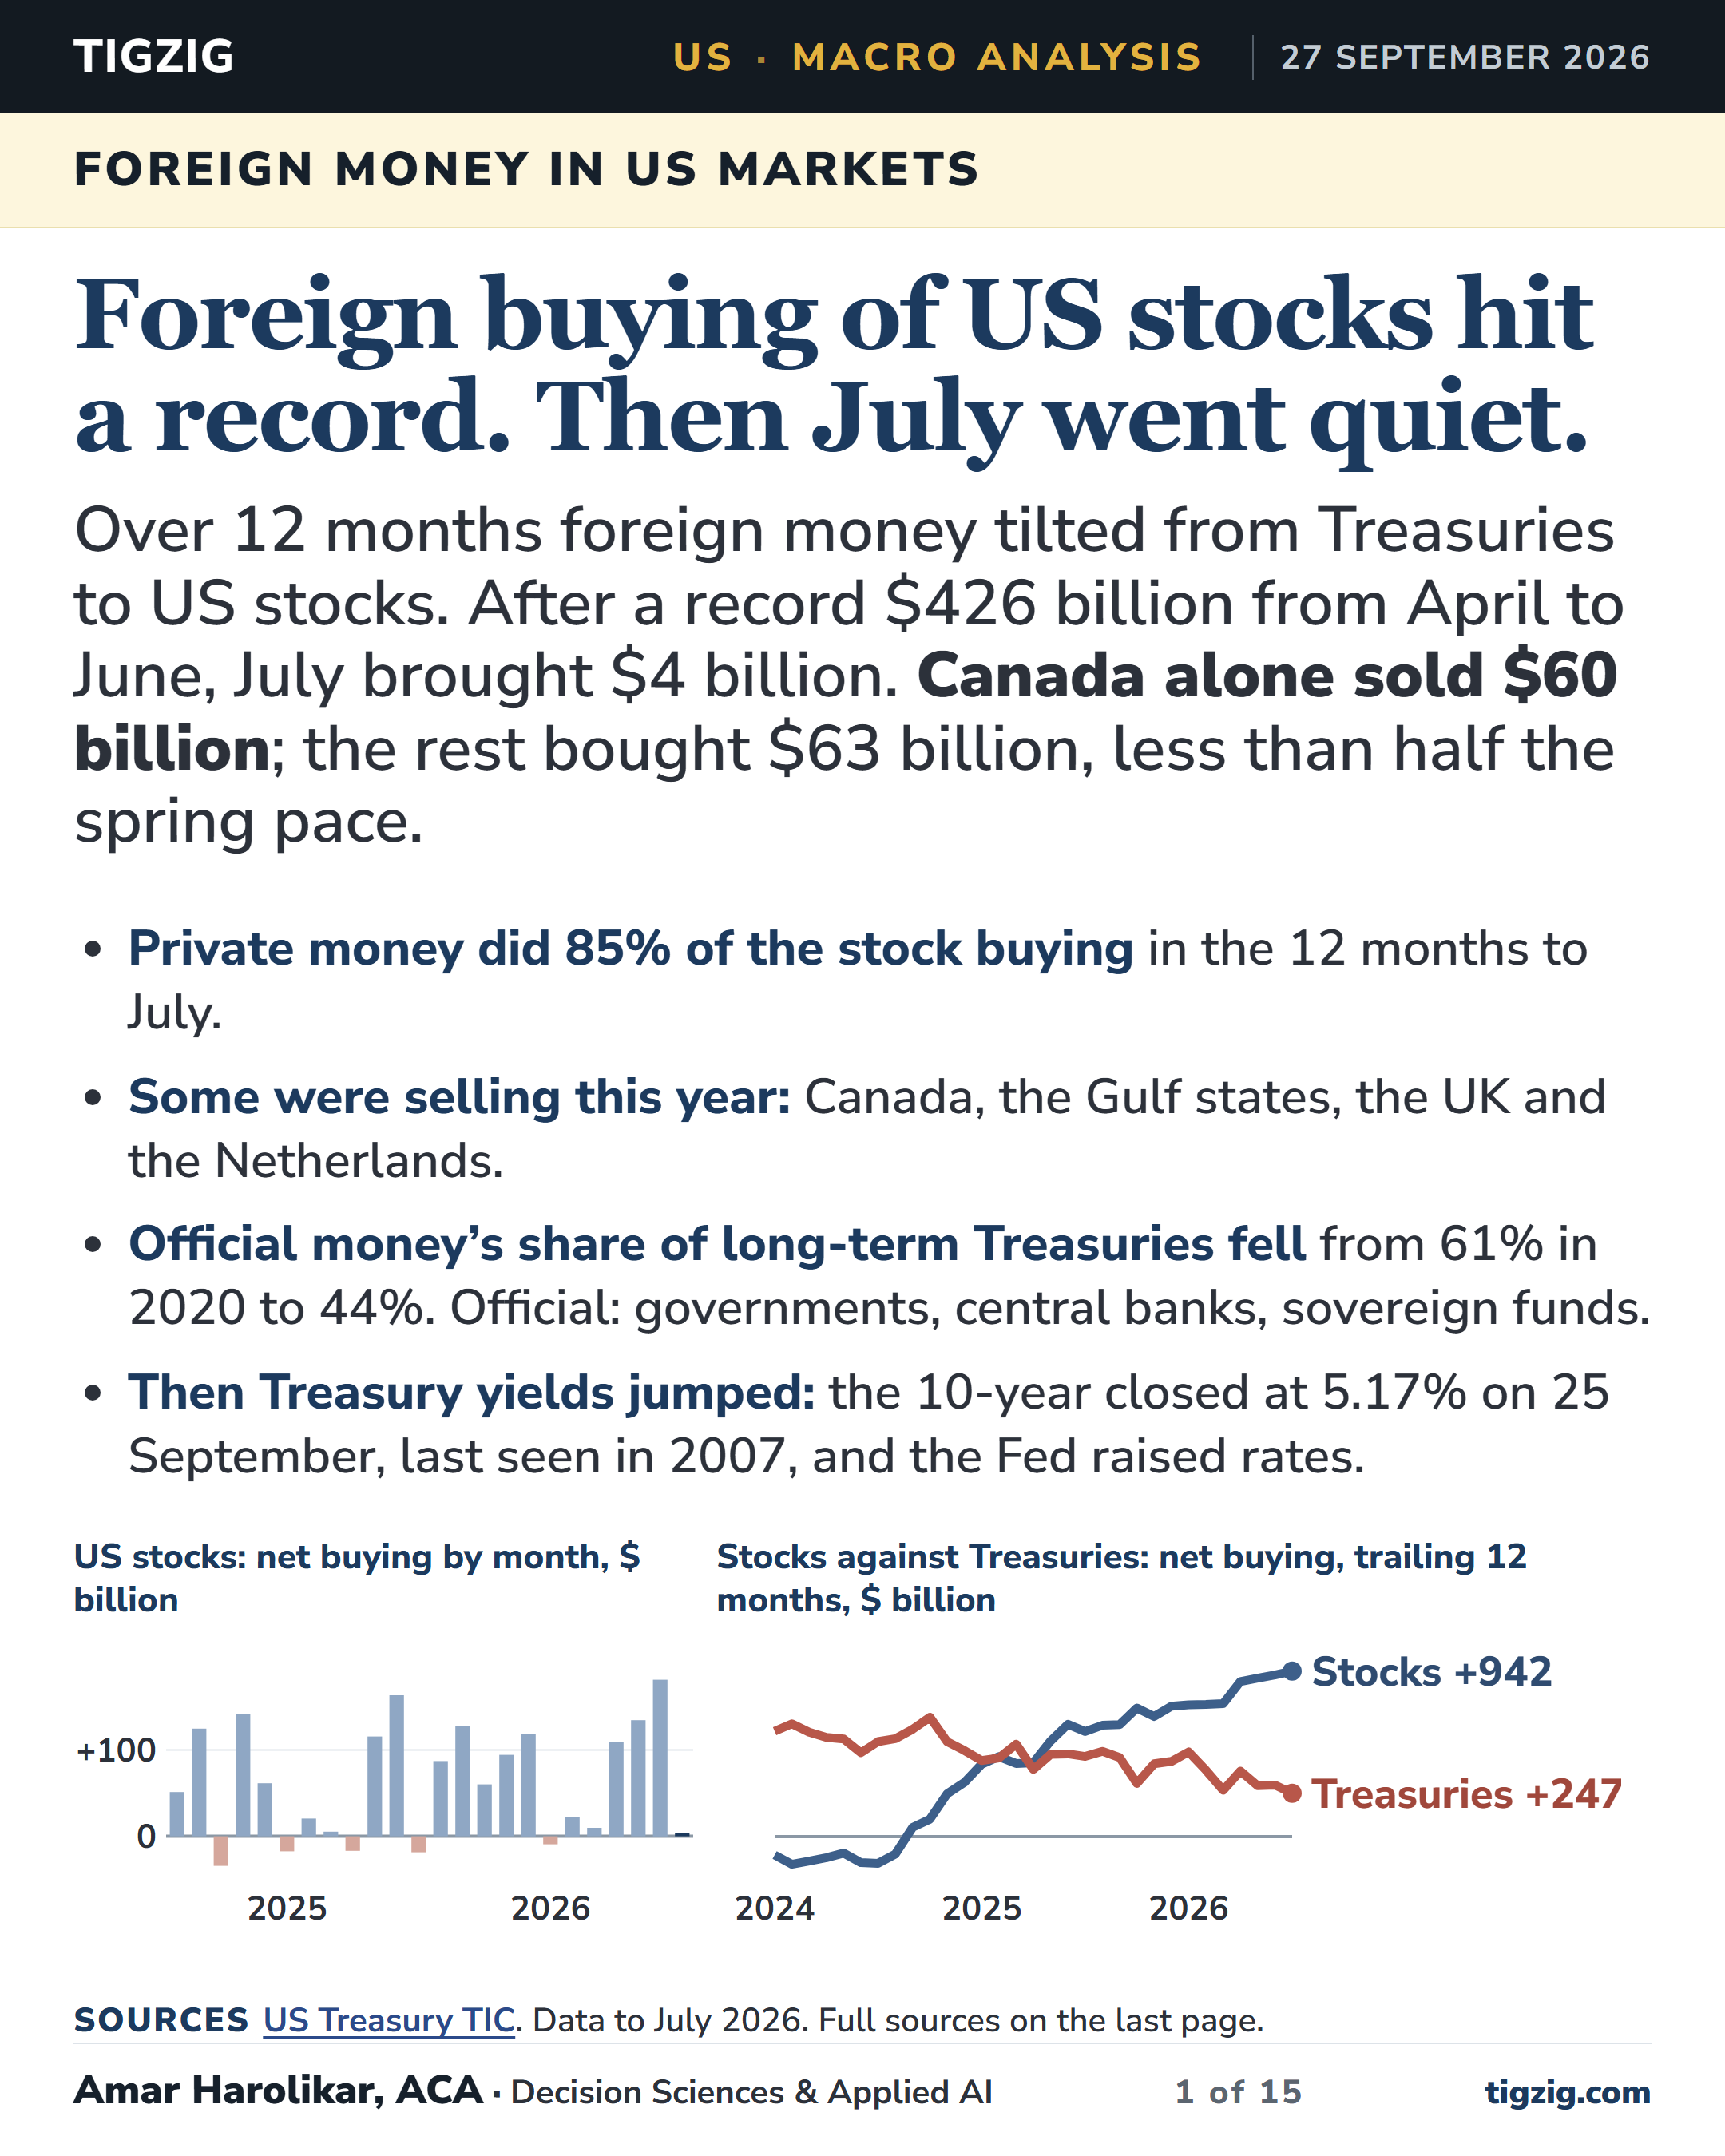
Foreigners bought a record $942 billion of US stocks in a year. Then in July they bought $4 billion. Canada alone sold $60 billion.
It is the most in US Treasury data. $426 billion of it came from April to June alone.
Without Canada, the rest of the world bought $63 billion in July, less than half the spring pace.
Money tilted from Treasuries to stocks. Treasury buying fell to $247 billion, from $541 billion two years earlier.
Private money did 85% of the stock buying. Governments, central banks and sovereign funds (official money) hold only 11% of foreign-held US stocks.
Official money's share of long-term Treasuries fell from 61% in 2020 to 44%.
Then yields jumped. The 10-year closed at 5.17% on 25 September, a level last seen in 2007, and the Fed raised rates.
July data came out on 16 September. September, due in mid-November, is the first month that shows how foreign buyers reacted to 5%.
The deck has the country tables for stocks, Treasuries, company bonds and agency bonds as well as links to source tables (US Treasury TIC files).
A few notes on the data
Everything comes from the US Treasury's TIC files, free to download. slt_table1.txt holds holdings, net buying and price changes by country from 2023. s1_globl.txt holds the older series back to 1977.
Country means where the security is held, often a custodian. The Cayman Islands, Ireland and Singapore bought $629 billion of the $942 billion. The owners can be anywhere.
These are long-term securities only. Treasury's headline table includes bills, so its China figure ($618 billion) is higher than the long-term figure in the deck.
Rising prices did three quarters of the rise in foreign holdings over the 12 months. Buying did most of the rest.
The Gulf states sold $90 billion of US stocks over the 12 months and bought $36 billion of US bonds. The selling began before the Iran war.
Some of the earlier analysis
Each one covers a part of the overall story.
Bond markets have been warning for months. Now they have started acting. tigzig.com/post/bond-market-rout-sep2026
The Fed is caught. The market had already made most of the decision for it. tigzig.com/post/fed-caught-rate-decision-sep2026
On the headline numbers the US job market looks fine. The story changes when you dig deeper. tigzig.com/post/us-jobs-calm-before-storm-sep2026
US banks had $2.8 trillion committed to non-bank lenders at the end of June. tigzig.com/post/us-banks-nonbank-lending-q2-2026
A correction in AI valuations is looking more likely. tigzig.com/post/ai-valuation-correction-aug2026
Foreign buying of US stocks hit a record. Then July went quiet.
Browse the slides or download the PDF
Full Deck Content (Text Format)
Text below was extracted from the source deck. Chart visuals stay in the PDF and as slide images above the post.
Slide 1
TIGZIGUS · MACRO ANALYSIS27 SEPTEMBER 2026
Foreign money in US markets
Foreign buying of US stocks hit a record. Then July went quiet.
Over 12 months foreign money tilted from Treasuries to US stocks. After a record $426 billion from April to June, July brought $4 billion. Canada alone sold $60 billion; the rest bought $63 billion, less than half the spring pace.
Private money did 85% of the stock buying in the 12 months to July.
Some were selling this year: Canada, the Gulf states, the UK and the Netherlands.
Official money's share of long-term Treasuries fell from 61% in 2020 to 44%. Official: governments, central banks, sovereign funds.
Then Treasury yields jumped: the 10-year closed at 5.17% on 25 September, last seen in 2007, and the Fed raised rates.
US stocks: net buying by month, $ billion 0 +100 2025 2026
Stocks against Treasuries: net buying, trailing 12 months, $ billion Stocks +942 Treasuries +247 2024 2025 2026
SourcesUS Treasury TIC. Data to July 2026. Full sources on the last page. Amar Harolikar, ACA · Decision Sciences & Applied AI1 of 15tigzig.com
Slide 2
TIGZIGUS · MACRO ANALYSIS27 SEPTEMBER 2026
Stocks overtook bonds
Stocks: $942 billion in the trailing 12 months to July. Two years earlier foreigners were net sellers, at $152 billion.
Treasuries: $247 billion, down from $541 billion two years earlier. Official holders sold $17 billion. Private investors bought $263 billion.
Company bonds: $452 billion, up from $306 billion two years earlier. The slowdown is in Treasuries only.
Agency bonds (Fannie Mae, Freddie Mac and others): $114 billion.
Net foreign buying of long-term US securities, trailing 12 months, $ billion
-200 0 +200 +400 +600 +800 +1000 Stocks +942 Company bonds +452 Treasuries +247 Agency bonds +114 Jan 2024 Jul 2024 Jan 2025 Jul 2025 Jan 2026 Jul 2026
SourcesUS Treasury TIC, net foreign purchases by type, Grand Total and official / non-official rows. Long-term securities only. Amar Harolikar · Decision Sciences & Applied AI2 of 15tigzig.com
Slide 3
TIGZIGUS · MACRO ANALYSIS27 SEPTEMBER 2026
Stock buying took off in late 2024, then dipped in July
$942 billion in the trailing 12 months, a record in dollar terms. Most of it came through the Cayman Islands, Ireland and Singapore.
July buying was $4 billion, after $110 billion to $182 billion a month from April to June. August is due on 16 October.
each month trailing 12 months, $ billion S&P 500, right scale -300 -200 -100 0 +100 +200 +300 +400 +500 +600 +700 +800 +900 +1000 2,000 4,000 6,000 8,000 2016 2018 2020 2022 2024 2026
SourcesUS Treasury TIC, net foreign purchases of US equity, Grand Total; s1_globl before February 2023. Full sources on page 15. Amar Harolikar · Decision Sciences & Applied AI3 of 15tigzig.com
Slide 4
TIGZIGUS · MACRO ANALYSIS27 SEPTEMBER 2026
Then Treasury yields jumped
The 10-year yield closed at 5.17 per cent on 25 September, a level last seen in 2007. A year earlier it was 4.18. The 2‑year closed at 4.81.
The Fed raised rates by a quarter point on 16 September, to 3.75 to 4 per cent.
Yields were already rising inside our data. The 10-year went from 3.97 per cent at the end of February to 4.75 at the end of July. Foreign buying of Treasuries fell from $107 billion in April and May to $3 billion in June and July.
The jump above 5 per cent came in mid-September. The September data, due in mid-November, is the first to show how foreign buyers reacted.
10-year Treasury yield, weekly, per cent 0% 2% 4% 6% 5.17 2000 2008 2016 2024
2-year Treasury yield, weekly, per cent 0% 2% 4% 6% 4.81 2000 2008 2016 2024
SourcesFRED DGS10 and DGS2 via Tremor to 23 September, US Treasury par yield curve for 24 and 25 September. Dashed line at 5 per cent. Federal Reserve statement, 16 September. US Treasury TIC: price change on long-term Treasuries, 12 months to July. Amar Harolikar · Decision Sciences & Applied AI4 of 15tigzig.com
Slide 5
TIGZIGUS · MACRO ANALYSIS27 SEPTEMBER 2026
Most of the gain came from prices
- Stocks: foreign holdings of US stocks rose from $12.7 trillion in January 2023 to $24.3 trillion in July 2026. Higher prices added $9.4 trillion. Net buying added $1.5 trillion.
Foreign holdings of long-term US securities, January 2023 to July 2026, $ trillion
- Stocks 24.3 Treasuries 7.8 Company 5.3 Agency 1.4 12.7 6.4 3.9 1.2 2023 2024 2025 2026
Share: stocks are now 63 per cent of foreign holdings of long-term US securities, up from 53 per cent in January 2023.
- Treasuries: foreigners bought $1.6 trillion. Lower prices took back $0.2 trillion.
Change in holdings, February 2023 to July 2026, $ trillion
net buying price change other
-1 0 +2 +4 +6 +8 +10 +12 Stocks +11.6 Treasuries +1.4 Company bonds +1.3 Agency bonds +0.2
SourcesUS Treasury TIC: holdings, net U.S. sales and valuation change by type, Grand Total. Other is our residual: change in holdings less net buying and price change, for example reporting and reclassification changes. Amar Harolikar · Decision Sciences & Applied AI5 of 15tigzig.com
Slide 6
TIGZIGUS · MACRO ANALYSIS27 SEPTEMBER 2026
Private money now holds most foreign Treasuries
Official: national governments, central banks, international organisations and sovereign wealth funds (Treasury SLT instructions). Private: everyone else.
Treasuries: official holders held 61 per cent of foreign-held Treasuries in January 2020. By July 2026 it was 44 per cent. Private holders passed them in June 2024.
Sovereign funds in September: Norway's fund proposed cutting Treasuries. New Zealand's warned of "some reversion to the mean" in US stocks.
Share held by official holders, each type on its own
- Treasuries 44% Agency 33% Stocks 11% Company 6% 61% 55% 13% 4% 2020 2022 2024 2026
Stocks: private money did 85% of the buying in the 12 months to July. Official holders own 11%.
Net buying, $ billion. 2026* is January to July
| Official | Private | |
|---|---|---|
| 2024 | 2025 | |
| Treasuries | -27 | -28 |
| Agency bonds | -45 | -54 |
| Stocks | +24 | +56 |
| Company bonds | +40 | +43 |
SourcesUS Treasury TIC, Foreign Official and Foreign Non-Official rows. The June 2021 step is a one-month $319 billion jump in private holdings, about 3 points of the fall. Official money held via custodians abroad counts as private. Reuters, 4 September. CNBC, 16 September. Amar Harolikar · Decision Sciences & Applied AI6 of 15tigzig.com
Slide 7
TIGZIGUS · MACRO ANALYSIS27 SEPTEMBER 2026
Most of the stock buying went into company shares
Net foreign buying of US stocks by type of issuer, $ billion. 2026* is January to July
+308 2024 +742 2025 +453 2026*
- Banks Other financial Funds and ETFs Non-financial
Company shares: 64% of buying in 2025, 66% in 2026*. Non-financial alone: 59% in 2026*.
- Funds and ETFs: 21% in 2024, about a third since. 17% of holdings.
Net foreign buying of US company and other bonds by issuer, $ billion. Includes municipal and asset-backed
+305 2024 +392 2025 +282 2026*
- State and local Banks Other financial Non-financial
Non-financial: 53% of company bond buying in 2025.
SourcesUS Treasury TIC, Grand Total "of which" rows by type of US issuer and fund shares. Listed US banks are bank holding companies and Treasury counts them as other financial. Fund shares are taken out of other financial. Amar Harolikar · Decision Sciences & Applied AI7 of 15tigzig.com
Slide 8
TIGZIGUS · MACRO ANALYSIS27 SEPTEMBER 2026
The buying came through fund hubs
Cayman Islands: a fund hub where many hedge funds are registered. The owners can be anywhere in the world. It was the largest single location in 2025.
Ireland: a hub for European ETFs. Amundi counts €26 billion into US stock ETFs in the second quarter, up from €8.2 billion. European stock ETFs had outflows.
Singapore: bought more in 2026 to July than in any full year before it.
Germany: $110 billion this year after three flat years.
Net buying of US stocks, $ billion a year, 2016 to 2026
Navy is buying, red is selling. The last, lighter bar (26*) is January to July 2026.
Cayman +4 +222 +111 16 17 18 19 20 21 22 23 24 25 26* Ireland -7 +102 +138 16 17 18 19 20 21 22 23 24 25 26* Singapore -1 +79 +127 16 17 18 19 20 21 22 23 24 25 26* Germany -3 -8 +110 16 17 18 19 20 21 22 23 24 25 26*
SourcesUS Treasury TIC. Amundi monthly flows report, via RankiaPro, 9 Jul. From February 2023 country is where the stock is held; before that, the foreign counterparty. Amar Harolikar · Decision Sciences & Applied AI8 of 15tigzig.com
Slide 9
TIGZIGUS · MACRO ANALYSIS27 SEPTEMBER 2026
The Gulf sold, Norway bought back
Gulf: after the Iran war began in late February, a Gulf official told Reuters three of the four biggest Gulf economies were reviewing investments, including possible divestments. The UAE said its plans had not changed.
The selling predates the war: Saudi Arabia, Kuwait and the UAE sold $34 billion in 2024, then $50 billion of US stocks from August to February and $41 billion from March to July. They bought $36 billion of US bonds over the 12 months.
Norway: sold $31 billion from January to March, then bought $20 billion from April to July. In September its manager proposed fewer Treasuries: nearly $80 billion of about $215 billion, Reuters calculates.
Net buying of US stocks, $ billion a year, 2016 to 2026
Navy is buying, red is selling. The last, lighter bar (26*) is January to July 2026.
Saudi Arabia -5 -22 -25 16 17 18 19 20 21 22 23 24 25 26* Kuwait +2 -37 -13 16 17 18 19 20 21 22 23 24 25 26* UAE -3 +1 -30 16 17 18 19 20 21 22 23 24 25 26* Norway +4 +82 -11 16 17 18 19 20 21 22 23 24 25 26*
SourcesUS Treasury TIC. Reuters, 11 Mar. Reuters, 4 Sep 2026. Amar Harolikar · Decision Sciences & Applied AI9 of 15tigzig.com
Slide 10
TIGZIGUS · MACRO ANALYSIS27 SEPTEMBER 2026
Canada, the UK and the Netherlands also sold
Canada: the biggest seller of 2026 so far, at $68 billion, against $174 billion in 2024. It swings hard month to month: it sold $60 billion in July after buying $17 billion in June.
UK: sold $29 billion this year, $28 billion of it in July. London is a custody hub, so this includes money from other countries.
Netherlands: sold in 6 of the 7 months this year, $30 billion in all.
Luxembourg: another fund hub. It sold $29 billion in 2025.
Net buying of US stocks, $ billion a year, 2016 to 2026
Navy is buying, red is selling. The last, lighter bar (26*) is January to July 2026.
Canada +2 +10 -68 16 17 18 19 20 21 22 23 24 25 26* UK +14 +7 -29 16 17 18 19 20 21 22 23 24 25 26* Netherlands +3 +14 -30 16 17 18 19 20 21 22 23 24 25 26* Luxembourg -12 -29 -7 16 17 18 19 20 21 22 23 24 25 26*
SourcesUS Treasury TIC, net foreign purchases of US equity. From February 2023 country is where the stock is held; before that, the country of the foreign counterparty. Amar Harolikar · Decision Sciences & Applied AI10 of 15tigzig.com
Slide 11
TIGZIGUS · MACRO ANALYSIS27 SEPTEMBER 2026
Who holds US stocks, and what they did
Top 25 locations by holdings of US stocks at the end of July 2026. Share is of all foreign holdings. Net buying in $ billion; a minus sign is net selling.
| # | Location | Holdings $ billion | Share | Net 2024 | Net 2025 | Net Jan to Jul 2026 | Net trailing 12m |
|---|---|---|---|---|---|---|---|
| 1 | UK | 2,600 | 10.7% | +7 | +7 | -29 | -38 |
| 2 | Cayman Islands | 2,581 | 10.6% | +162 | +222 | +111 | +275 |
| 3 | Canada | 2,516 | 10.3% | -174 | +10 | -68 | -8 |
| 4 | Ireland | 2,005 | 8.2% | +145 | +102 | +138 | +185 |
| 5 | Luxembourg | 1,697 | 7.0% | -1 | -29 | -7 | -19 |
| 6 | Japan | 1,392 | 5.7% | -40 | +15 | +2 | -2 |
| 7 | Switzerland | 1,144 | 4.7% | -2 | +22 | +10 | -13 |
| 8 | Singapore | 1,077 | 4.4% | +70 | +79 | +127 | +169 |
| 9 | Norway | 1,029 | 4.2% | +30 | +82 | -11 | +52 |
| 10 | Australia | 848 | 3.5% | +37 | +15 | +25 | +45 |
| 11 | South Korea | 784 | 3.2% | +15 | +74 | +35 | +69 |
| 12 | France | 747 | 3.1% | +63 | +67 | +26 | +73 |
| 13 | Netherlands | 504 | 2.1% | +29 | +14 | -30 | -37 |
| 14 | Germany | 500 | 2.1% | -7 | -8 | +110 | +101 |
| 15 | Sweden | 465 | 1.9% | +26 | +6 | -2 | +4 |
| 16 | Kuwait | 412 | 1.7% | -15 | -37 | -13 | -31 |
| 17 | China (mainland) | 401 | 1.6% | -28 | -34 | +13 | +16 |
| 18 | Hong Kong | 350 | 1.4% | +6 | +4 | +17 | +24 |
| 19 | Denmark | 340 | 1.4% | +4 | +11 | +9 | +12 |
| 20 | UAE | 265 | 1.1% | -24 | +1 | -30 | -24 |
| 21 | Israel | 257 | 1.1% | +7 | +16 | +18 | +31 |
| 22 | British Virgin Is. | 231 | 0.9% | -8 | +33 | -22 | +12 |
| 23 | Taiwan | 217 | 0.9% | -1 | +10 | +11 | +11 |
| 24 | Saudi Arabia | 212 | 0.9% | +4 | -22 | -25 | -35 |
| 25 | Bermuda | 178 | 0.7% | -4 | +9 | +4 | +12 |
| All others | 1,590 | 6.5% | +5 | +73 | +32 | +58 | |
| Total | 24,341 | 100.0% | +308 | +742 | +453 | +942 |
SourcesUS Treasury TIC: holdings and net U.S. sales by location. Country is where the stock is held. All others includes international organisations, so rows add to Treasury's total. Amar Harolikar · Decision Sciences & Applied AI11 of 15tigzig.com
Slide 12
TIGZIGUS · MACRO ANALYSIS27 SEPTEMBER 2026
Who holds long-term Treasuries, and what they did
Top 25 locations by holdings of long-term Treasuries at the end of July 2026. Share is of all foreign holdings. Net buying in $ billion; a minus sign is net selling.
| # | Location | Holdings $ billion | Share | Net 2024 | Net 2025 | Net Jan to Jul 2026 | Net trailing 12m |
|---|---|---|---|---|---|---|---|
| 1 | Japan | 1,024 | 13.2% | -45 | +65 | -11 | +4 |
| 2 | UK | 888 | 11.4% | +35 | +187 | +126 | +119 |
| 3 | China (mainland) | 578 | 7.4% | -102 | -110 | -48 | -75 |
| 4 | Belgium | 394 | 5.1% | -8 | -17 | -18 | -9 |
| 5 | Canada | 389 | 5.0% | +43 | +71 | -36 | +44 |
| 6 | Luxembourg | 354 | 4.5% | +28 | +21 | +11 | +41 |
| 7 | France | 329 | 4.2% | +87 | +33 | -13 | -26 |
| 8 | Taiwan | 290 | 3.7% | +40 | +5 | -3 | -8 |
| 9 | Singapore | 259 | 3.3% | +49 | +23 | +2 | +14 |
| 10 | Cayman Islands | 249 | 3.2% | +77 | +5 | +5 | -15 |
| 11 | Ireland | 239 | 3.1% | -9 | +9 | +2 | +9 |
| 12 | Switzerland | 228 | 2.9% | +26 | +6 | -1 | -6 |
| 13 | Hong Kong | 222 | 2.8% | +36 | +38 | +33 | +54 |
| 14 | Norway | 206 | 2.7% | +16 | +46 | +4 | -1 |
| 15 | India | 183 | 2.4% | -13 | -52 | +20 | -18 |
| 16 | Brazil | 167 | 2.1% | -22 | -40 | +2 | -32 |
| 17 | Saudi Arabia | 110 | 1.4% | +3 | -8 | +6 | +7 |
| 18 | South Korea | 107 | 1.4% | +13 | +16 | -23 | -12 |
| 19 | Israel | 93 | 1.2% | +13 | +12 | +22 | +23 |
| 20 | Mexico | 84 | 1.1% | +24 | -14 | +16 | +10 |
| 21 | Spain | 82 | 1.1% | +11 | +7 | +11 | +3 |
| 22 | Germany | 79 | 1.0% | +7 | 0 | +10 | +7 |
| 23 | British Virgin Is. | 68 | 0.9% | +4 | +21 | +12 | +22 |
| 24 | Australia | 67 | 0.9% | +14 | +4 | +10 | +13 |
| 25 | Kuwait | 67 | 0.9% | +4 | +13 | +4 | +10 |
| All others | 1,028 | 13.2% | +159 | +86 | +32 | +67 | |
| Total | 7,783 | 100.0% | +490 | +428 | +174 | +247 |
SourcesUS Treasury TIC: holdings and net U.S. sales by location. Long-term only: Treasury bills are excluded. Treasury's major holders table, with bills, has China at $618 billion, down from $696 billion a year earlier. Belgium includes Euroclear custody. All others includes international organisations, so rows add to Treasury's total. Amar Harolikar · Decision Sciences & Applied AI12 of 15tigzig.com
Slide 13
TIGZIGUS · MACRO ANALYSIS27 SEPTEMBER 2026
Who holds US company bonds, and what they did
Top 25 locations by holdings of US company bonds at the end of July 2026. Share is of all foreign holdings. Net buying in $ billion; a minus sign is net selling.
| # | Location | Holdings $ billion | Share | Net 2024 | Net 2025 | Net Jan to Jul 2026 | Net trailing 12m |
|---|---|---|---|---|---|---|---|
| 1 | Luxembourg | 811 | 15.4% | +30 | +53 | +18 | +36 |
| 2 | Belgium | 704 | 13.4% | -24 | -21 | +4 | 0 |
| 3 | Cayman Islands | 548 | 10.4% | +23 | +24 | +13 | +14 |
| 4 | UK | 545 | 10.3% | +59 | +72 | +33 | +64 |
| 5 | Ireland | 341 | 6.5% | +38 | +43 | +29 | +52 |
| 6 | Japan | 313 | 5.9% | +13 | +13 | +8 | +12 |
| 7 | Canada | 271 | 5.1% | +8 | +21 | +32 | +46 |
| 8 | Bermuda | 225 | 4.3% | +17 | +14 | +12 | +21 |
| 9 | Taiwan | 201 | 3.8% | +13 | +11 | +2 | +9 |
| 10 | Switzerland | 143 | 2.7% | +12 | +26 | +9 | +17 |
| 11 | Germany | 134 | 2.5% | +1 | +11 | +11 | +17 |
| 12 | Singapore | 111 | 2.1% | +14 | +12 | +16 | +26 |
| 13 | Norway | 107 | 2.0% | +8 | +15 | +16 | +21 |
| 14 | Hong Kong | 95 | 1.8% | +16 | +18 | +7 | +12 |
| 15 | Netherlands | 89 | 1.7% | +6 | +6 | +9 | +10 |
| 16 | France | 83 | 1.6% | +5 | +10 | +14 | +20 |
| 17 | Kuwait | 55 | 1.0% | +7 | +16 | +4 | +10 |
| 18 | South Korea | 53 | 1.0% | +1 | +3 | +5 | +6 |
| 19 | Australia | 51 | 1.0% | +8 | +4 | +5 | +8 |
| 20 | British Virgin Is. | 42 | 0.8% | +6 | +5 | +4 | +7 |
| 21 | Italy | 25 | 0.5% | +5 | +1 | +1 | +1 |
| 22 | Saint Kitts and Nevis | 24 | 0.4% | +1 | +1 | 0 | +1 |
| 23 | Israel | 21 | 0.4% | +4 | +3 | +3 | +4 |
| 24 | Barbados | 21 | 0.4% | 0 | +1 | +1 | +2 |
| 25 | Denmark | 20 | 0.4% | +1 | -1 | 0 | -2 |
| All others | 239 | 4.5% | +31 | +32 | +25 | +39 | |
| Total | 5,273 | 100.0% | +305 | +392 | +282 | +452 |
SourcesUS Treasury TIC: holdings and net U.S. sales by location. Corporate and other bonds, including state and local debt and asset-backed bonds. All others includes international organisations, so rows add to Treasury's total. Amar Harolikar · Decision Sciences & Applied AI13 of 15tigzig.com
Slide 14
TIGZIGUS · MACRO ANALYSIS27 SEPTEMBER 2026
Who holds US agency bonds, and what they did
Top 25 locations by holdings of US agency bonds at the end of July 2026. Share is of all foreign holdings. Net buying in $ billion; a minus sign is net selling.
| # | Location | Holdings $ billion | Share | Net 2024 | Net 2025 | Net Jan to Jul 2026 | Net trailing 12m |
|---|---|---|---|---|---|---|---|
| 1 | Japan | 269 | 18.9% | +3 | +8 | -10 | +5 |
| 2 | Taiwan | 181 | 12.7% | +2 | +10 | +9 | +16 |
| 3 | Canada | 162 | 11.4% | +12 | -19 | -16 | -23 |
| 4 | China (mainland) | 141 | 9.9% | -43 | -64 | -8 | -36 |
| 5 | Luxembourg | 119 | 8.4% | +18 | +34 | +27 | +48 |
| 6 | Cayman Islands | 79 | 5.6% | +10 | +33 | +14 | +18 |
| 7 | UK | 68 | 4.7% | +35 | -9 | +12 | -7 |
| 8 | Ireland | 49 | 3.4% | +5 | +8 | +11 | +23 |
| 9 | France | 49 | 3.4% | +1 | +16 | +4 | +10 |
| 10 | Singapore | 40 | 2.8% | +9 | +26 | +9 | +29 |
| 11 | British Virgin Is. | 38 | 2.7% | +2 | +5 | 0 | +4 |
| 12 | South Korea | 33 | 2.3% | +1 | 0 | -1 | 0 |
| 13 | Bermuda | 32 | 2.3% | +7 | +10 | +1 | +6 |
| 14 | Hong Kong | 20 | 1.4% | +2 | +6 | +10 | +16 |
| 15 | Malaysia | 19 | 1.4% | +1 | 0 | 0 | 0 |
| 16 | Belgium | 11 | 0.8% | +1 | 0 | 0 | 0 |
| 17 | Spain | 10 | 0.7% | +2 | +3 | +1 | +2 |
| 18 | Thailand | 10 | 0.7% | 0 | 0 | 0 | 0 |
| 19 | Indonesia | 8 | 0.6% | 0 | +1 | 0 | +1 |
| 20 | Australia | 7 | 0.5% | -1 | -2 | +1 | +2 |
| 21 | Netherlands | 7 | 0.5% | +3 | -7 | -3 | -8 |
| 22 | Mexico | 7 | 0.5% | 0 | -2 | +1 | +1 |
| 23 | Switzerland | 6 | 0.4% | 0 | -2 | 0 | -1 |
| 24 | Israel | 5 | 0.4% | +1 | +1 | +1 | +1 |
| 25 | Kuwait | 5 | 0.3% | +1 | 0 | 0 | 0 |
| All others | 49 | 3.4% | +11 | +2 | +4 | +6 | |
| Total | 1,423 | 100.0% | +83 | +56 | +68 | +114 |
SourcesUS Treasury TIC: holdings and net U.S. sales by location. Agency covers Ginnie Mae, Fannie Mae, Freddie Mac, the Federal Home Loan Banks and other US agencies, per the TIC glossary. All others includes international organisations, so rows add to Treasury's total. Amar Harolikar · Decision Sciences & Applied AI14 of 15tigzig.com
Slide 15
TIGZIGUS · MACRO ANALYSIS27 SEPTEMBER 2026
About this data
Primary data
| File | What it holds | Used for |
|---|---|---|
| slt_table1.txt Treasury TIC | Monthly foreign holdings, net buying and price changes of long-term US securities, by country and type, plus official and private splits for the total | Everything from February 2023, all holdings, all tables |
| s1_globl.txt Treasury TIC | The older monthly report of gross purchases and sales by country, from 1977 | Stock buying before February 2023 |
| S&P 500 Yahoo Finance | Monthly closing level | The S&P line on page 3 |
Timing
July data came out on 16 September, about seven weeks after the month. August is due on 16 October.
What it measures
Long-term US securities held outside the US: stocks and fund shares, Treasuries, agency and company bonds. Long-term means an original maturity over one year, so Treasury bills are excluded.
Country means where the security is held
TIC records the country of the holder or custodian it can see, often not the final owner. The Cayman Islands, Ireland and Singapore are fund and custody hubs.
Two series joined in February 2023
Before February 2023 stock buying comes from the older report, which records the country of the foreign counterparty to each trade. It also missed repayments on asset-backed bonds, so bond charts use the current report only.
Portfolio holdings only
Stakes of 10 per cent or more in a company count as direct investment and are not in these figures. Monthly numbers are revised when the annual survey comes in.
Other sources
Treasury yields: FRED DGS10 and DGS2, and the Treasury par yield curve. Federal Reserve statement of 16 September. Treasury's major holders table (SLT Table 5). News: Reuters, CNBC, The Globe and Mail, and Amundi via RankiaPro, as cited on each page.
Amar Harolikar · Decision Sciences & Applied AI15 of 15tigzig.com
Working on something similar? How I work covers the rates, the availability and what I take on.