Six Months of Foreign Selling in Oil and Gas, Financials, Autos and FMCG. The Last Two Bounces Did Not Hold
Published: November 8, 2026
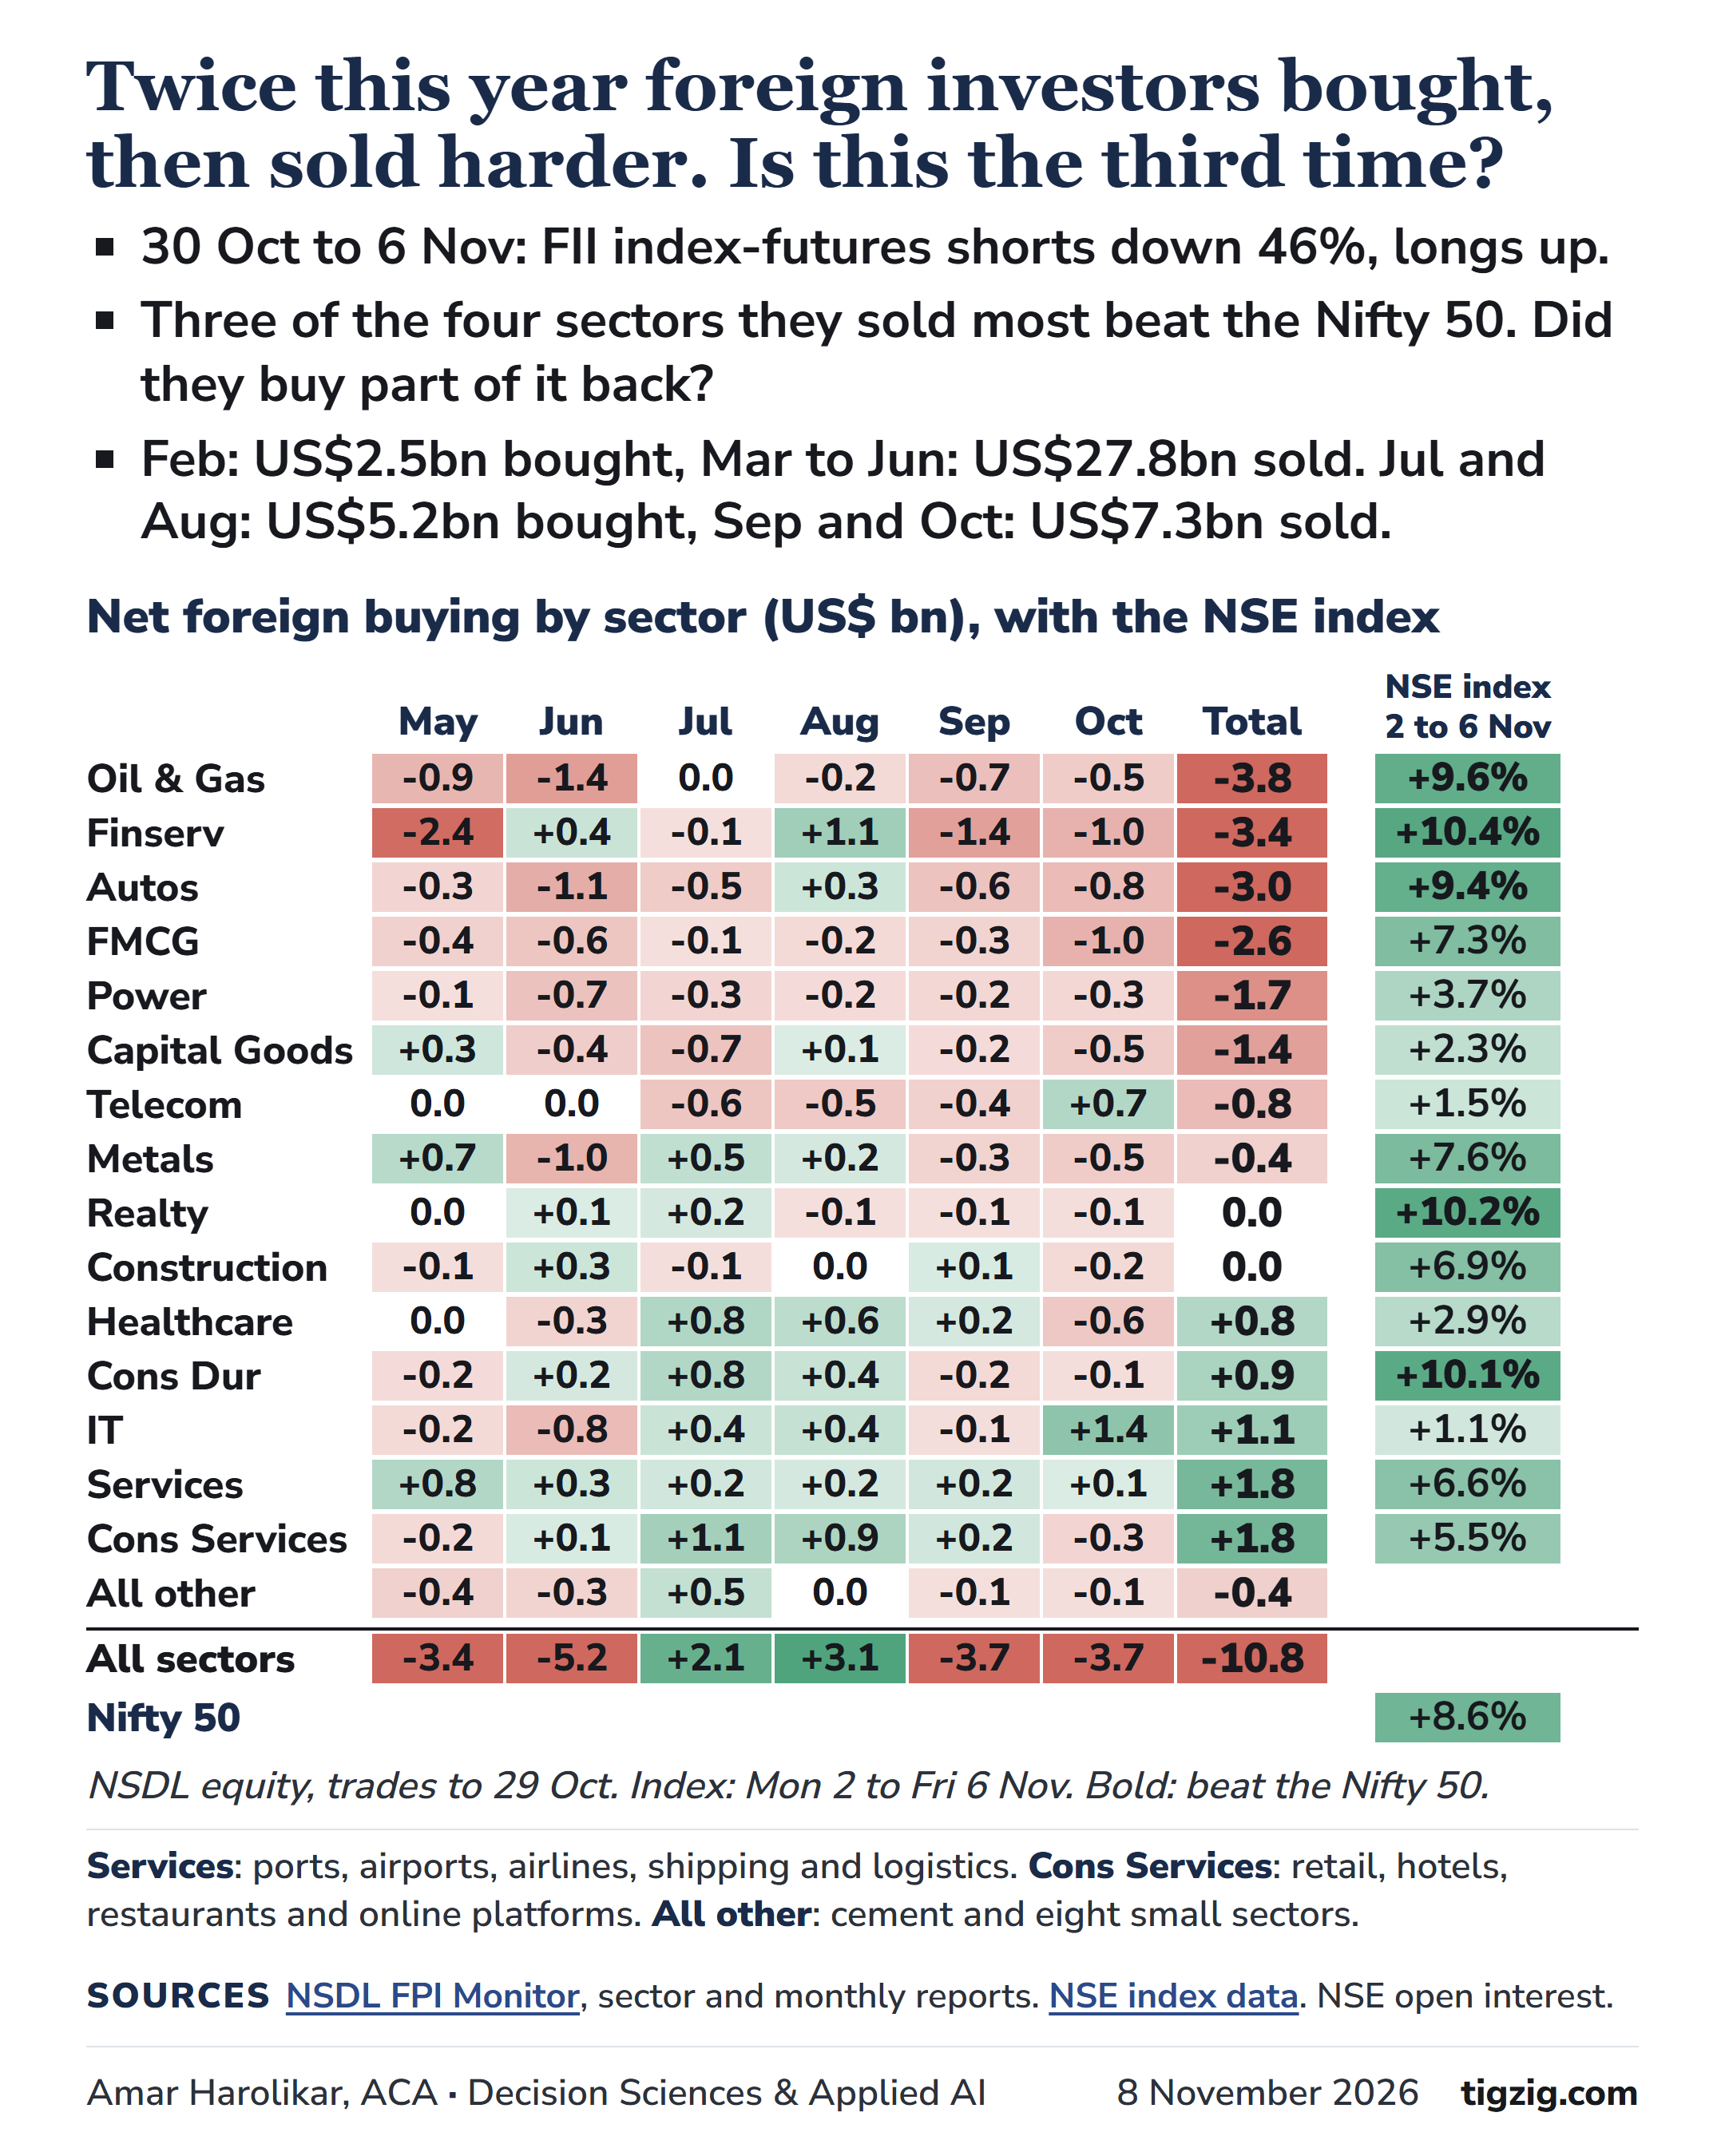
Keeping aside Sunday's Muhurat session, the last two bounces did not hold. Foreign investors bought US$2.5bn in Feb and then sold US$27.8bn from Mar to Jun. They bought US$5.2bn in Jul and Aug and then sold US$7.3bn in Sep and Oct.
What they sold and bought.
In the last six months foreign investors sold oil and gas, financials, autos, FMCG, power and capital goods. From May to October they bought services, consumer services, consumer durables, IT and healthcare.
The five sessions.
Oil and gas, financials and autos rose more than the Nifty 50 from Mon 2 to Fri 6 Nov. FMCG did not. In the same sessions the index-futures shorts of foreign institutions fell by 46%. These moves happened together, and the data goes no further than that. NSDL shows about US$4.1bn of net foreign equity buying for trades from 30 Oct to 5 Nov, but it has not published which sectors the money went into. They may have bought back part of what they sold, or it may be the start of a longer buy. Who knows.
The Muhurat session on Sun 8 Nov is not in these numbers. The Nifty 50 fell 0.18% on turnover of about a tenth of Friday's. The next regular session is Mon 9 Nov, and NSE is shut on Tue 10 Nov.
Will they sell again?
NSDL's next sector report covers trades to about 12 Nov and is not out yet, so where the recent buying went is not in the data. It comes out 5 to 9 days after the fortnight ends, so about 20 to 24 Nov.
Earlier analysis.
Foreign portfolio money leaving Indian stocks, 19 Oct. Net sellers in 15 of 23 sector groups since Oct 2024.
tigzig.com/post/fpi-foreign-money-leaving-india-oct2026
Data notes
▸ Six months, May to Oct, net foreign selling in US$: oil and gas 3.8bn (every month, July only slightly), financials 3.4bn (mostly May), autos 3.0bn, FMCG 2.6bn, power 1.7bn (every month), capital goods 1.4bn. All sectors together: 10.8bn out, with buying only in Jul and Aug. Services is the only sector bought in every month, 1.8bn. IT's 1.1bn is mostly October.
▸ NSDL sector figures are equity, include primary-market buying such as IPOs, and cover trades to 29 Oct. NSE cash figures are exchange trades only. All other is construction materials (cement, -0.4bn) and eight small sectors.
▸ Index moves are NSE's all-index closes for 30 Oct and 6 Nov, each row against its matching Nifty sector index.
▸ NSE provisional cash, 2 to 6 Nov: foreign institutions bought Rs 45,960 crore and domestic institutions sold Rs 24,197 crore.
▸ FII index-futures shorts at the closes of 30 Oct, 2, 3, 4, 5 and 6 Nov: 275,190; 264,390; 235,905; 220,818; 189,475; 149,072. Longs: 34,437; 31,191; 33,148; 34,839; 52,037; 48,656. They are still net short, by about 100,400 contracts.
▸ Bounce figures are NSDL's monthly equity report.
Working on something similar? How I work covers the rates, the availability and what I take on.