India Data Centres: Engineering, Construction and Power. Forecasts of 5.6 to 12 GW by 2030 Against 1.8 GW Today, and the Companies Building It
Published: November 7, 2026
The work is being done by people in hard hats and yellow vests, out in sun and rain, with everything from hammers to the most advanced machines: engineering, construction and power. The names run from Reliance, Adani and L&T down through a whole range of listed and unlisted companies to MSMEs.
EPC, engineering, procurement and construction, is a large landscape: power, transformers, electrical equipment, cooling, racks, cabling, electronics, fit-out, base building and all the supporting services, from logistics to transport.
Forecasts vary a lot and not every announcement will happen. Five published forecasts run from 5.6 to 12 GW by around 2030 against about 1.8 GW today, so even the lowest is more than three times that. One lower view, an expert cited in an Axis Capital report, is 2.8 to 3.6 GW.
The build has been going on for years and capacity is already being commissioned. It will not be smooth: a power sanction takes around 18 months, backup generators are booked about two years ahead, specialist engineers are short, and power, water, acquiring sites, policy and local support are real issues. My sense is that they get worked out, with some costs going up.
India has a decent cost advantage. Mumbai costs $6.83 a watt to build, the second lowest of 62 markets in the Turner & Townsend index, against $9.67 in Bangkok, $10.06 in Kuala Lumpur, $11.80 in Northern Virginia and $12.95 in London. That is for a typical 60 MW air-cooled build, excluding the site, utility works and IT equipment.
Deals, jobs, water and all 42 company tables are in the deck.
Related analysis
▸ Part one, 24 May. AI data centres for the world, built by Adani, Reliance, Airtel and L&T, and what India brings to it.
tigzig.com/post/india-next-tech-wave-ai-data-centers-may2026
▸ India red flags, 31 May. GDP downgrades, IT layoffs, foreign selling and the oil shock, with the data centre build as the one bright spot.
tigzig.com/post/india-economy-red-flag-may2026
▸ A bust likely before AI pays off, 1 Nov. OpenAI cuts its funding target, AI stocks fall hard, and power and data-centre permits limit the build.
tigzig.com/post/ai-selloff-red-flags-piling-up-nov2026
▸ The biggest tech build meets the bond rout, 28 Sep. Goldman expects the five hyperscalers to spend $3.4 trillion on AI over three years as yields hit their highest since 2007.
tigzig.com/post/ai-hyperscalers-debt-bond-rout-sep2026
▸ A correction in AI valuations looks more likely, 31 Aug. The case now comes from the ECB, the Financial Stability Board chair and a bond investor.
tigzig.com/post/ai-valuation-correction-aug2026
More analysis at tigzig.com/analysis
A few caveats
Today's installed capacity is counted differently: Cushman & Wakefield has 1.8 GW at hyperscale cloud and colocation sites in IT megawatts, Axis Capital has 1.3 to 1.4 GW across all types, and the government has 1.57 GW. The gaps are unexplained, and Axis is lower even though it counts more types.
The Axis figures are an expert's estimate cited in its report, as reported by ANI. I have not seen the report itself.
Forecasts differ in basis and date: Jefferies' 10 GW is over five years, Crisil's 7.5 GW is by March 2030. Share prices run from 31 Dec 2025 to 6 Nov 2026 and move daily. Goldman's table is priced at 11 Sep 2026 and many of these shares had already risen by then. The window here is my own and is not tied to the report date. Goldman's growth, capex and cash flow figures are consensus estimates for calendar 2027 as of 11 Sep. The 1 GW water lines are my scaling of the 100 MW cases. Turner & Townsend lists Mumbai as the only Indian city.
This is my analysis of public sources, for information only. Not investment advice.
India's AI data centres, part two
Browse the slides or download the PDF
Full Deck Content (Text Format)
Text below was extracted from the source deck. Chart visuals stay in the PDF and as slide images above the post.
Slide 1
India’s AI data centres, part two
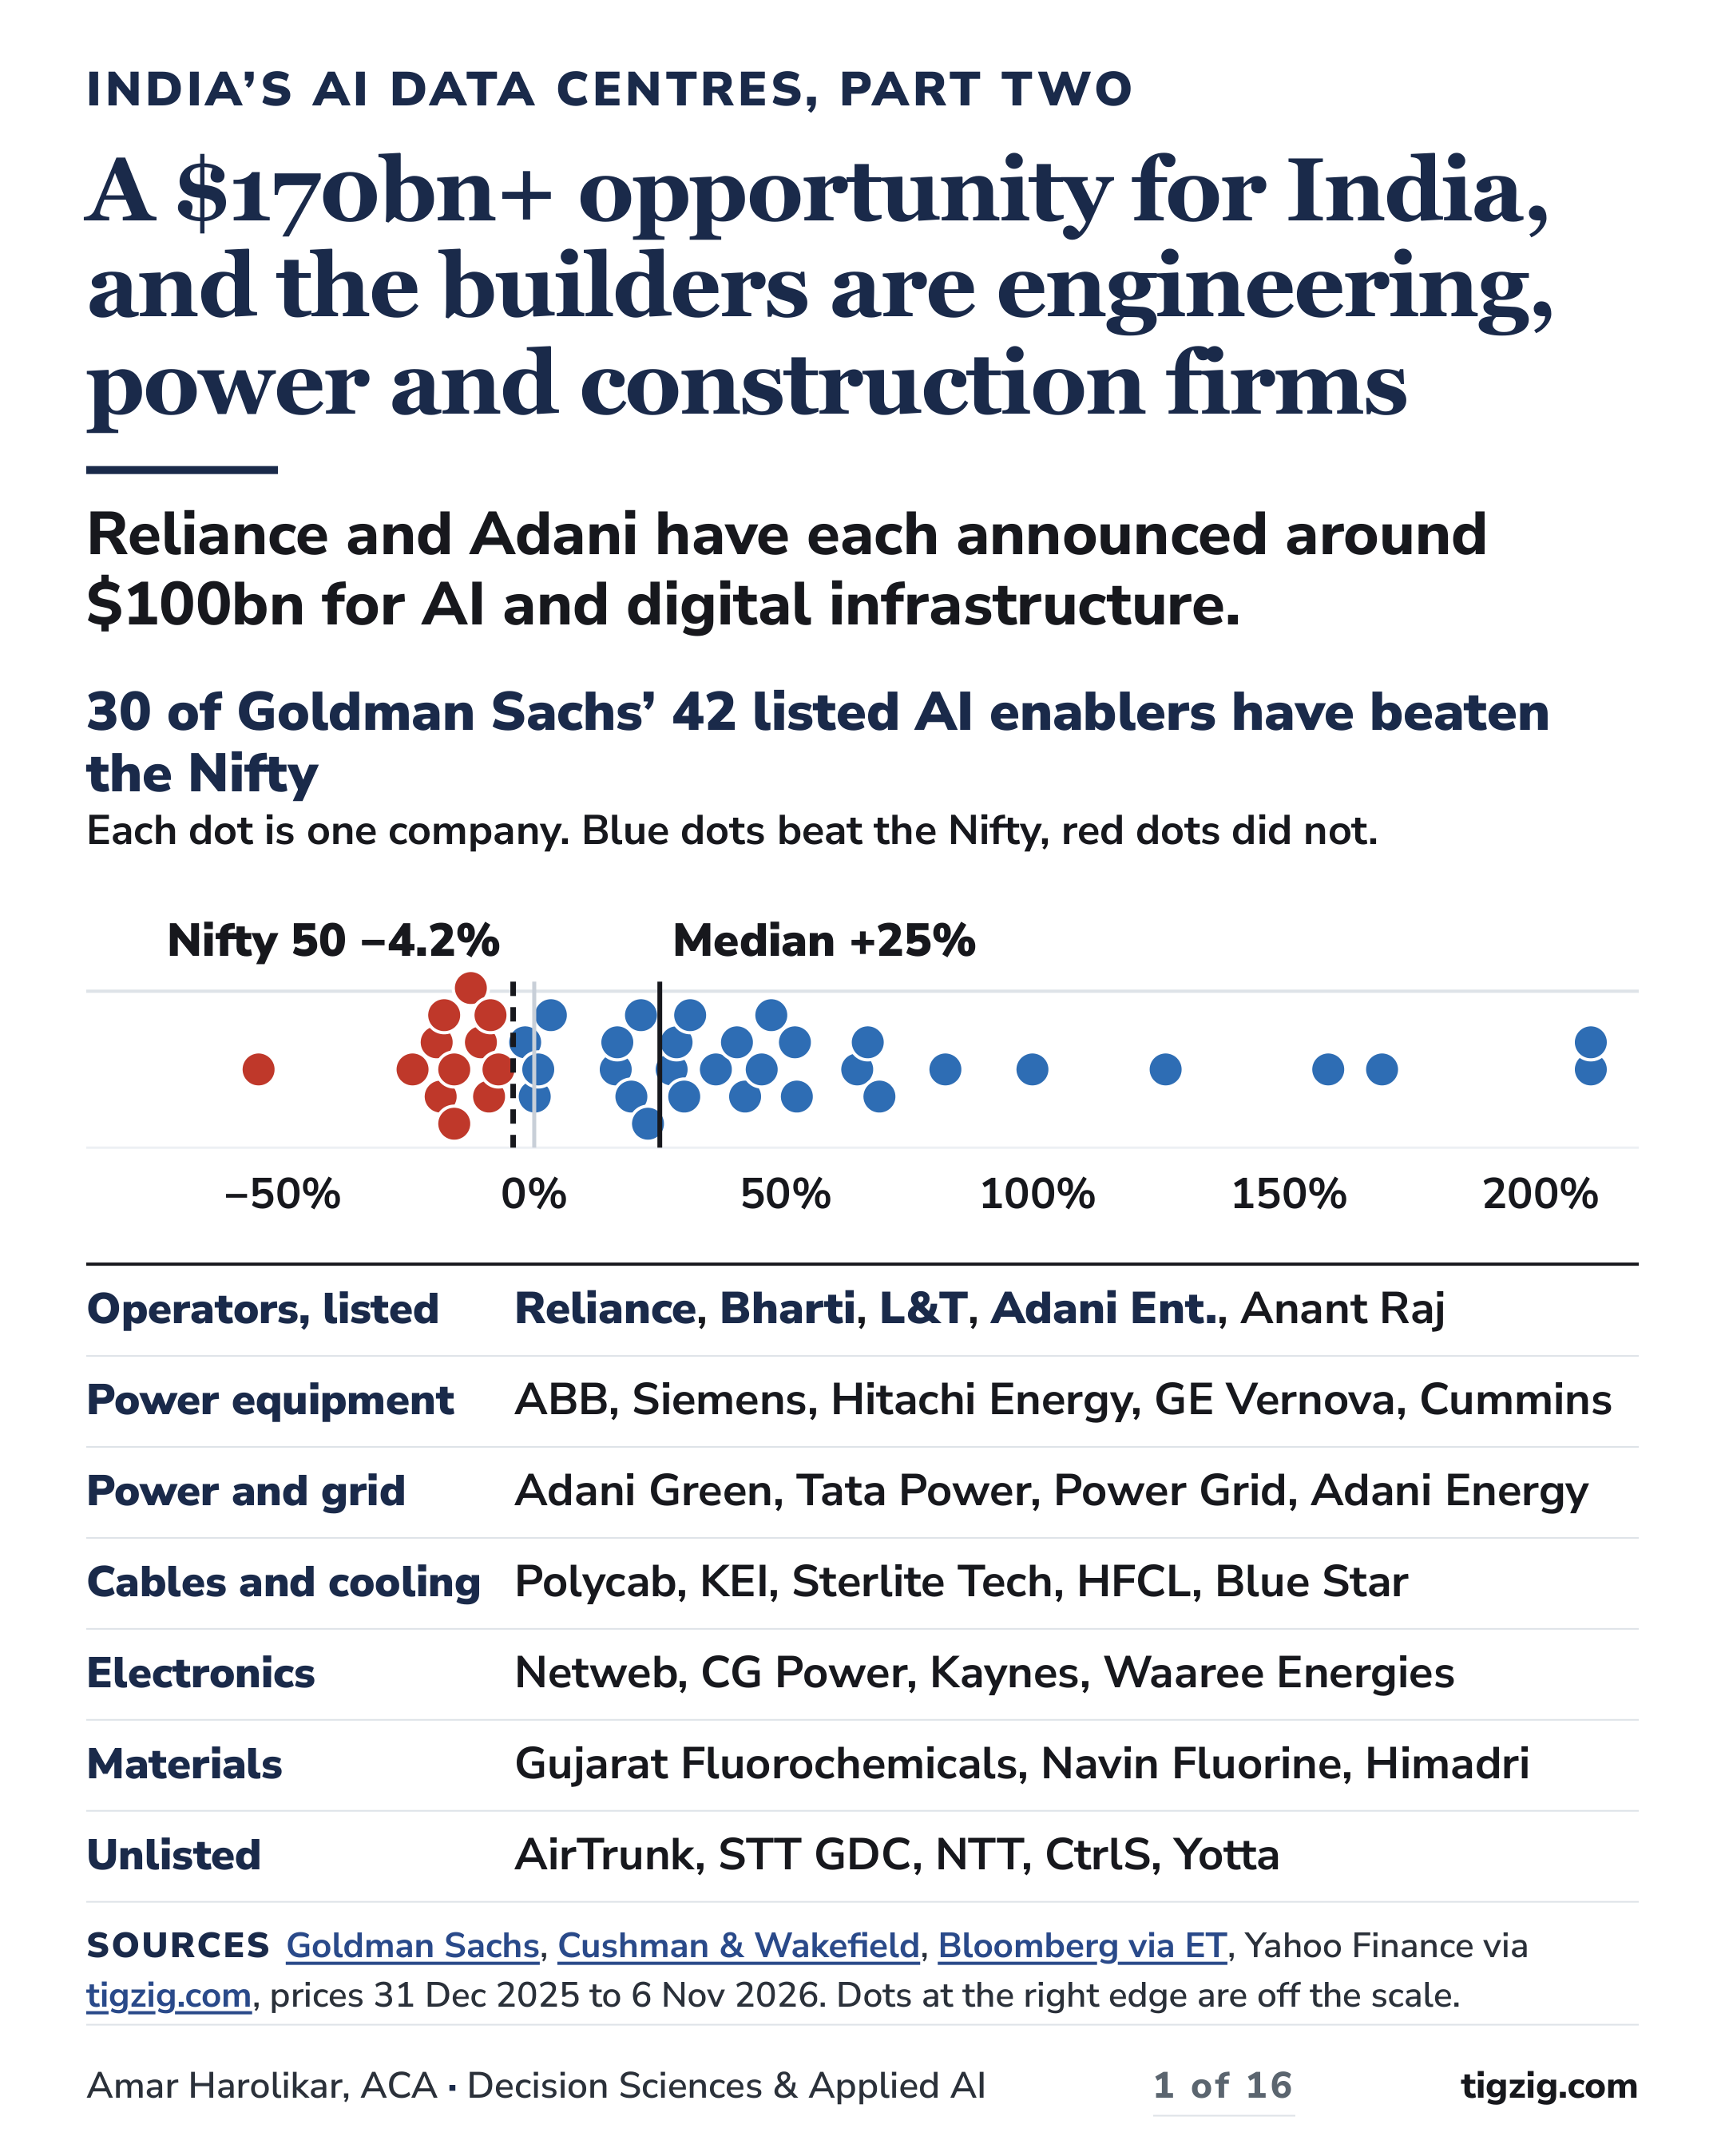
A $170bn+ opportunity for India, and the builders are engineering, power and construction firms
Reliance and Adani have each announced around $100bn for AI and digital infrastructure.
30 of Goldman Sachs’ 42 listed AI enablers have beaten the Nifty Each dot is one company. Blue dots beat the Nifty, red dots did not. Nifty 50 −4.2% Median +25% −50% 0% 50% 100% 150% 200%
Operators, listed****Reliance, Bharti, L&T, Adani Ent., Anant Raj Power equipmentABB, Siemens, Hitachi Energy, GE Vernova, Cummins Power and gridAdani Green, Tata Power, Power Grid, Adani Energy Cables and coolingPolycab, KEI, Sterlite Tech, HFCL, Blue Star ElectronicsNetweb, CG Power, Kaynes, Waaree Energies MaterialsGujarat Fluorochemicals, Navin Fluorine, Himadri UnlistedAirTrunk, STT GDC, NTT, CtrlS, Yotta
SourcesGoldman Sachs, Cushman & Wakefield, Bloomberg via ET, Yahoo Finance via tigzig.com, prices 31 Dec 2025 to 6 Nov 2026. Dots at the right edge are off the scale. Amar Harolikar, ACA · Decision Sciences & Applied AI1 of 16tigzig.com
Slide 2
Forecasts for 2030 run from 5.6 to 12 GW
The lowest of these five is more than three times today’s 1.8 GW. A lower view is on the next page.
India data centre capacity, gigawatts Wood Mackenzie published 27 Jul 2026 12 Jefferies over five years, 10 Sep 2026 about 10 Government Bloomberg via ET, 3 Nov 2026 nearly 8 Cushman & Wakefield Oct 2026: 5.6 if built, 8 AI case 5.6 to 8 Crisil Ratings by March 2030, 3 Nov 2026 7.5 Today C&W count, H1 2026 1.8 0 3 6 9 12
Part 1, May 2026 India’s next tech wave. AI data centers for the world
Estimates of today’s capacity vary, from 1.3 to 1.8 GW across the sources on page 6.
SourcesWood Mackenzie, Jefferies via TOI, Bloomberg via ET, Cushman & Wakefield, Crisil. Amar Harolikar · Decision Sciences & Applied AI2 of 16tigzig.com
Slide 3
A cautious view: 2.8 to 3.6 GW by 2030
From an expert cited in an Axis Capital report.
India data centre capacity, gigawatts Conservative operating by 2030 about 2.8 Planned, realistic by mid-2030 3.4 to 3.6 Announced targets, called aggressive 6 to 8 If all is built by 2035 7 to 8 0 2 4 6 8
Installed today, 1.3 to 1.4 GW, by type (Axis Capital) Colocation 60 to 65% Hyperscaler, captive or leased 25 to 30% Enterprise 8 to 10% Edge 2 to 3%
Counts of today’s capacity differ, and the gap is unexplained. Axis counts 1.3 to 1.4 GW across all four types. Cushman & Wakefield counts 1.8 GW at hyperscale cloud and colocation sites. The government says 1.57 GW.
Momentum900 MW to 1.2 GW was awarded in six to seven months, and an award is not operating capacity. 7 to 8 GW by 2035 if all announced is built.
Build rateCBRE counts about 0.3 GW added in 2026. Reaching 5.6 GW by end-2030 from 1.8 GW takes about 0.85 GW a year (our sums).
SourcesAxis Capital report via ANI, ET, Cushman & Wakefield. Amar Harolikar · Decision Sciences & Applied AI3 of 16tigzig.com
Slide 4
Announced: $170bn+ Estimated build spending to 2030: $32bn to $57bn
At ₹94.5 to the dollar: $170bn is about ₹16 lakh crore, $32bn about ₹3 lakh crore, $57bn about ₹5.4 lakh crore.
Announced investment, US$ billion The $200bn is the minister’s figure for the whole value chain: the site, construction, IT equipment, network and power CBRE since 2021, to H1 2026 173 Commerce minister potential over 7 to 8 years about 200
Estimated build spending to 2030, US$ billion C&W: construction cost only. AI scenario: 15% of early-stage projects also get built. Crisil: investment by FY2030, at ₹94.5 to the dollar, 6 Nov 2026 Crisil Ratings four years, over ₹3 lakh crore about 32 Cushman & Wakefield if today’s pipeline is built, 5.6 GW 32.7 Cushman & Wakefield AI scenario, 8 GW 56.9
Hyperscalers took more than 80% of new demand in H1 2026, and pre-leased capacity doubled to 1.15 GW.
SourcesCBRE via ET, Cushman & Wakefield and Invest India, Bloomberg via ET, Crisil via ET, Cushman & Wakefield H1 2026. Rupee: Yahoo via tigzig.com. Amar Harolikar · Decision Sciences & Applied AI4 of 16tigzig.com
Slide 5
Reliance and Adani have each announced about $100bn. Global names: $13bn to $30bn each
Announced plans, US$ billion, over each company’s own period. Not all of it is data centres.
At ₹94.5 to the dollar: $100bn is about ₹9.4 lakh crore, $30bn ₹2.8 lakh crore, $13bn ₹1.2 lakh crore.
Reliance up to 110, over 7 years Adani about 100, to 2035 AirTrunk 30, by 2030 Microsoft 17.5, 2026 to 2029 Google 15, Vizag, from 2028 Amazon 13 more, 2026 to 2030
Meta from Reliance, Jun 2026 168 MW at Jamnagar in the first phase, with an option to scale
OpenAI at TCS, Feb 2026 100 MW to start at TCS’s HyperVault business
Together AI with L&T, Aug 2026 10,000 Nvidia B300 chips at Chennai, an order of ₹10,000 to 15,000 crore
TCS HyperVault Hyderabad, 5 Sep 2026 264 acres for up to 1 GW, up to ₹70,000 crore with partners
SourcesBloomberg via ET, AirTrunk, Microsoft, Business Standard, ET, Amazon, Meta, Reuters, Reuters via BS, TCS. Reliance and Adani amounts include other AI and digital infrastructure. Amar Harolikar · Decision Sciences & Applied AI5 of 16tigzig.com
Slide 6
Mumbai has half of today’s capacity. Hyderabad’s pipeline is nearly five times what it operates now
IT megawatts (MW) at hyperscale cloud and colocation sites. Operating: H1 2026. Pipeline: assumed built by 2030. The bars add up to 1,789 MW operating and 3,860 MW pipeline.
Operating, MW Pipeline, assumed built by 2030, MW
Mumbai 890 1,726 Hyderabad 151 710 Chennai 214 368 Delhi NCR 183 387 Pune 133 258 Bengaluru 162 100 Kolkata 22 84 Rest of India 34 227
Current capacity estimates. CBRE: 2 GW by year-end, less about 200 MW due in H2, is about 1.8 GW at mid-year. Government: 1.57 GW in August. Axis Capital: 1.3 to 1.4 GW.
SourcesCushman & Wakefield India Data Centre H1 2026 Update, CBRE via ET, Bloomberg via ET. Amar Harolikar · Decision Sciences & Applied AI6 of 16tigzig.com
Slide 7
Building in Mumbai costs $6.83 a watt. Northern Virginia costs $11.80
Mumbai is the second cheapest of 62 markets in the Turner & Townsend index, 15 shown. US$ per watt, typical 60 MW air-cooled build, excluding the site, utility works and IT equipment.
Tokyo 18.28 Singapore 15.39 Silicon Valley, US 15.01 Chicago, US 13.28 London 12.95 Frankfurt 12.49 Jakarta 11.96 Northern Virginia, US 11.80 Dallas, US 10.51 Kuala Lumpur 10.06 Bangkok 9.67 UAE 9.20 Ho Chi Minh City 8.32 Mumbai 6.83 Shanghai 5.79
Where the India build cost goes Cushman & Wakefield, excluding the site Electrical systems 28% Interior fit-out 14% Mechanical systems 14% Base building 12% Racks and cabling 11% Cooling systems 10% Professional fees 8% Fire, security, furniture 3%
SourcesTurner & Townsend Data Centre Construction Cost Index 2026 (62 markets), Cushman & Wakefield Cost Guide 2026, C&W and Invest India. Amar Harolikar · Decision Sciences & Applied AI7 of 16tigzig.com
Slide 8
What could slow it down: power, equipment and sites
Power connectionA power sanction takes around 18 months (Axis Capital, via ANI). Grid connections in Europe’s main hubs are stretching to 7 to 10 years (C&W).
Navi MumbaiData centres want 4,000 to 5,000 MW and 1,500 to 2,000 MW is sanctioned. The 765-kV substation they need could take three to five years, and its site request is unanswered after 18 months (Business India).
Grid warningThe Central Electricity Authority has told Maharashtra, Andhra Pradesh, Telangana and Tamil Nadu to plan for the surge (ThePrint).
Equipment and buildersRolling out even a first phase typically takes at least 32 to 36 months. Backup generators from leading global suppliers are booked about two years ahead. Contractors and manpower are short (Axis Capital, via ANI).
Sites and local consentFarmers at Google’s and Microsoft’s sites say they are pressured to give up farmland (Rest of World). Activists want a state moratorium on new data centres in Andhra Pradesh, and three petitions are before the Green Tribunal (ET). Google says it will use air cooling and fund grid upgrades (Business Standard).
SourcesAxis Capital via ANI, ET, Business India, ThePrint, Cushman & Wakefield, Rest of World, ET, Business Standard. Amar Harolikar · Decision Sciences & Applied AI8 of 16tigzig.com
Slide 9
What could slow it down: talent and early-stage projects
TalentCooling, high-voltage electrical and commissioning engineers are the hardest to find (CBRE India). Malaysia, Thailand, Indonesia and China hire the same skills, and people prefer those markets (Colt Data Centre Services). ET reports a minister’s estimate of nearly 1 lakh engineering jobs, and TeamLease Digital’s estimate of more than 4 lakh with the wider ecosystem by 2030.
Announced and builtOf the money announced for future capacity, 24% is for projects under construction or planned and 76% is early stage (Cushman & Wakefield). Crisil adds that more than 95% of the capacity under construction is already contracted.
India data centre capacity by stage, GW Cushman & Wakefield, H1 2026. Early stage: announced, with or without a site Operating 1.8 Under construction 0.5 Planned 3.4 Early stage 15
SourcesCushman & Wakefield, Crisil via ET, ET Datacenters, ET. Amar Harolikar · Decision Sciences & Applied AI9 of 16tigzig.com
Slide 10
Power and water set the limits. Policy is catching up
Electricity used by data centres Share of India’s electricity. FY2030 is a projection (C&W, Invest India) 0.8% FY2025 2.6% FY2030
Water a day, million litres One scale. Percent is of Bengaluru’s supply. Mumbai supply, ORF (2023) 3,950 Bengaluru supply, Down To Earth 2,000 20 MW Deloitte via DTE 1.4, 0.07% 100 MW IEA via CEEW 2, 0.1% 100 MW, high ORF 7, 0.35% 1 GW, low scaled up, our sums 20, 1% 1 GW, high scaled up, our sums 70, 3.5% IEA: International Energy Agency. ORF: Observer Research Foundation. Water-saving cooling is slow to spread: cost, few vendors, upkeep (CEEW).
Power need in three citiesAbout three quarters of upcoming capacity is in Visakhapatnam, Mumbai and Hyderabad. By FY2030 it could equal 80%, 60% and 20% of their current peak power demand (Crisil).
Policy catching upA tax holiday to 2047 was announced for foreign cloud firms. A national policy is in the works, and NITI Aayog has asked states to assess power and water.
SourcesCushman & Wakefield, Down To Earth, CEEW, ORF, ORF Mumbai, Crisil via ET, PIB, ET, ET. Amar Harolikar · Decision Sciences & Applied AI10 of 16tigzig.com
Slide 11
The biggest companies have the lowest expected growth and the smallest gains
Each bubble is one company. Bubble size is the market cap.
Beat the Nifty Did not
−50% 0% 50% 100% 0% 25% 50% 75% 100% 125% 150% Expected earnings growth, calendar 2027 (Goldman) Share price change this year Nifty 50 −4.2% Reliance Bharti L&T Power Grid Adani Energy ABB Adani Ent. Adani Green
Off the scale, on the top edge: Sterlite Tech +598%, HFCL +211%, Diamond Power +168%, Sansera +158%.
SourcesYahoo Finance via tigzig.com APIs: share price change 31 Dec 2025 to 6 Nov 2026, price only, and market cap at 6 Nov. Growth: Goldman Sachs AI Enablers table (FactSet, I/B/E/S consensus, 11 Sep 2026). Amar Harolikar · Decision Sciences & Applied AI11 of 16tigzig.com
Slide 12
Power equipment and transmission
Blue tick: beat the Nifty (−4.2%). Red cross: did not. Goldman’s table (FactSet, I/B/E/S consensus), calendar 2027: earnings growth, capex / sales, FCF / sales (cash left after capex). Capex / OCF is our calculation, NM where operating cash flow would exceed sales. PriceChangeMkt cap ₹ K crGrowth CY27ECapex / salesFCF / salesCapex / OCF Power equipment10 of 12 beat the Nifty ABB India +31%144+33%2%11%0.2x Cummins India −9%112+21%2%14%0.1x Siemens +16%127+9%2%7%0.2x Hitachi Energy +52%124+42%9%6%0.6x GE Vernova T&D +28%103+33%5%12%0.3x APAR +69%59.1+17%3%3%0.5x Kirloskar Oil +30%23.0+34%10%3%0.8x Schneider +47%25.4+43%3%6%0.3x TD Power +64%18.5+31%2%9%0.2x MTAR Tech +126%16.8+93%18%−3%1.2x Diamond Power +168%22.2+90%0%−2%NM Waaree Renew. −24%7.7+6%9%2%0.8x Power transmission2 of 3 beat the Nifty Power Grid −2%242+8%80%14%0.9x Adani Energy +42%178+19%44%−18%1.7x KEC Intl −55%8.9+30%1%3%0.2x
SourcesPrices: Yahoo Finance via tigzig.com APIs, 31 Dec 2025 to 6 Nov 2026, price change only. Market cap: Yahoo, 6 Nov 2026. Growth, capex, FCF and the 42 names: Goldman Sachs AI Enablers table (FactSet, I/B/E/S consensus, 11 Sep 2026). Amar Harolikar · Decision Sciences & Applied AI12 of 16tigzig.com
Slide 13
Generation, materials, electronics
Blue tick: beat the Nifty (−4.2%). Red cross: did not. Goldman’s table (FactSet, I/B/E/S consensus), calendar 2027: earnings growth, capex / sales, FCF / sales (cash left after capex). Capex / OCF is our calculation, NM where operating cash flow would exceed sales. PriceChangeMkt cap ₹ K crGrowth CY27ECapex / salesFCF / salesCapex / OCF Power generation3 of 5 beat the Nifty Adani Green +40%235+70%235%−109%NM Tata Power −7%113+12%32%−5%1.2x NTPC Green −13%69.6+106%613%−250%NM ACME Solar +66%27.9+86%487%−197%NM Clean Max +45%14.8+159%242%−96%NM Chemicals and materials3 of 3 beat the Nifty Gujarat Fluoro +27%51.3+33%30%−10%1.5x Navin Fluorine +52%46.2+20%17%9%0.7x Himadri +16%28.7+14%15%−5%1.5x Semiconductors and electronics4 of 6 beat the Nifty Netweb Tech +21%22.4+31%1%3%0.2x CG Power +19%122+31%8%3%0.7x Waaree Energies −18%70.1+9%27%−6%1.3x Sansera +158%27.0+30%13%1%0.9x Kaynes Tech −19%21.7+47%26%−8%1.4x Paras Defence +82%10.0+34%NMNMNM
SourcesPrices: Yahoo Finance via tigzig.com APIs, 31 Dec 2025 to 6 Nov 2026, price change only. Market cap: Yahoo, 6 Nov 2026. Growth, capex, FCF and the 42 names: Goldman Sachs AI Enablers table (FactSet, I/B/E/S consensus, 11 Sep 2026). Clean Max: since listing, 2 Mar 2026. Capex / OCF is NM where Goldman’s figures imply cash flow above sales (Yahoo FY2026 for those four: operating cash flow 62% to 91% of sales). Amar Harolikar · Decision Sciences & Applied AI13 of 16tigzig.com
Slide 14
Data centre hardware and operators
Blue tick: beat the Nifty (−4.2%). Red cross: did not. Goldman’s table (FactSet, I/B/E/S consensus), calendar 2027: earnings growth, capex / sales, FCF / sales (cash left after capex). Capex / OCF is our calculation, NM where operating cash flow would exceed sales. PriceChangeMkt cap ₹ K crGrowth CY27ECapex / salesFCF / salesCapex / OCF Data centre hardware5 of 7 beat the Nifty Polycab +3%119+18%4%5%0.4x KEI −11%38.1+22%5%1%0.8x Sterlite Tech +598%37.0+78%11%6%0.6x HFCL +211%32.2+50%10%2%0.8x Blue Star −9%32.4+27%2%3%0.4x Craftsman Auto +36%27.4+46%13%0%1.0x Syrma SGS +99%28.1+38%6%−1%1.2x Operators and developers3 of 6 beat the Nifty Reliance −16%1,786+11%11%5%0.7x Bharti Airtel +0%1,315+29%22%27%0.4x L&T +1%567+20%2%4%0.3x Adani Ent. +23%372+68%30%−12%1.7x Anant Raj −19%16.0+35%68%−13%1.2x Brigade −16%18.2+22%22%−1%1.0x
SourcesPrices: Yahoo Finance via tigzig.com APIs, 31 Dec 2025 to 6 Nov 2026, price change only. Market cap: Yahoo, 6 Nov 2026. Growth, capex, FCF and the 42 names: Goldman Sachs AI Enablers table (FactSet, I/B/E/S consensus, 11 Sep 2026). Amar Harolikar · Decision Sciences & Applied AI14 of 16tigzig.com
Slide 15
Are these the only 42?
Goldman Sachs picked 42 listed companies as AI enablers. They are not the only ones.
Goldman on its own screenA company needed $1bn of market value and $3m of trading a day to qualify. Goldman says the screen can leave out smaller companies.
What the build reaches (our reading)
Engineering and ancillary industries, as parts and components are for a car maker
Large, medium and small firms
Listed and unlisted
Areas it touches
Electrical
Mechanical
Cooling
Racks and cabling
Base building and interiors
Professional fees
Power
Renewables
Utilities
Fibre
Water treatment
Equipment servicing
Construction materials
Security
Logistics
Local services
SourcesMoneycontrol on Goldman Sachs, Cushman & Wakefield, ET. Amar Harolikar · Decision Sciences & Applied AI15 of 16tigzig.com
Slide 16
Sources
Companies
Goldman Sachs AI Enablers, Business Today Goldman, Business Standard Goldman, Moneycontrol Goldman, Economic Times Nomura and CLSA via ET
Capacity, investment and cost
Cushman & Wakefield and Invest India, Growth Story Cushman & Wakefield, Construction Cost Guide 2026 Turner & Townsend, Cost Index 2026 Cushman & Wakefield, H1 2026 Update CBRE via ET, 2 GW by end-2026 Wood Mackenzie, 12 GW Crisil Ratings via Business Standard Crisil via ET, investment Jefferies via Times of India CEEW study, Feb 2026
Deals
Bloomberg via ET, Adani and Reliance Microsoft Amazon AirTrunk Meta TCS HyperVault Reuters, OpenAI and Tata Reuters via Business Standard, L&T Business Standard, Google Vizag
Jobs, power, water, policy
Axis Capital report via ANI, ET Business India, Navi Mumbai ThePrint, CEA warning Rest of World, farmers ET, jobs and TeamLease ET Datacenters, talent shortage ET Datacenters, capacity and talent ORF, The Cloud Runs on Water Down To Earth, thirsty data centres ORF, Mumbai water stress ET, Google Vizag backlash PIB, tax holiday to 2047 ET, national policy in works ET, NITI Aayog framework
Not investment advice. This is my analysis of public sources, for information only. Care has been taken, but errors are possible. Use of AI. Parts of this work were prepared with AI under my direction. I reviewed, edited and approved every page. The analysis, conclusions and judgment are mine.
Amar Harolikar · Decision Sciences & Applied AI16 of 16tigzig.com
Working on something similar? How I work covers the rates, the availability and what I take on.