The Biggest Tech Build Meets the Bond Rout of 2026
Published: September 28, 2026
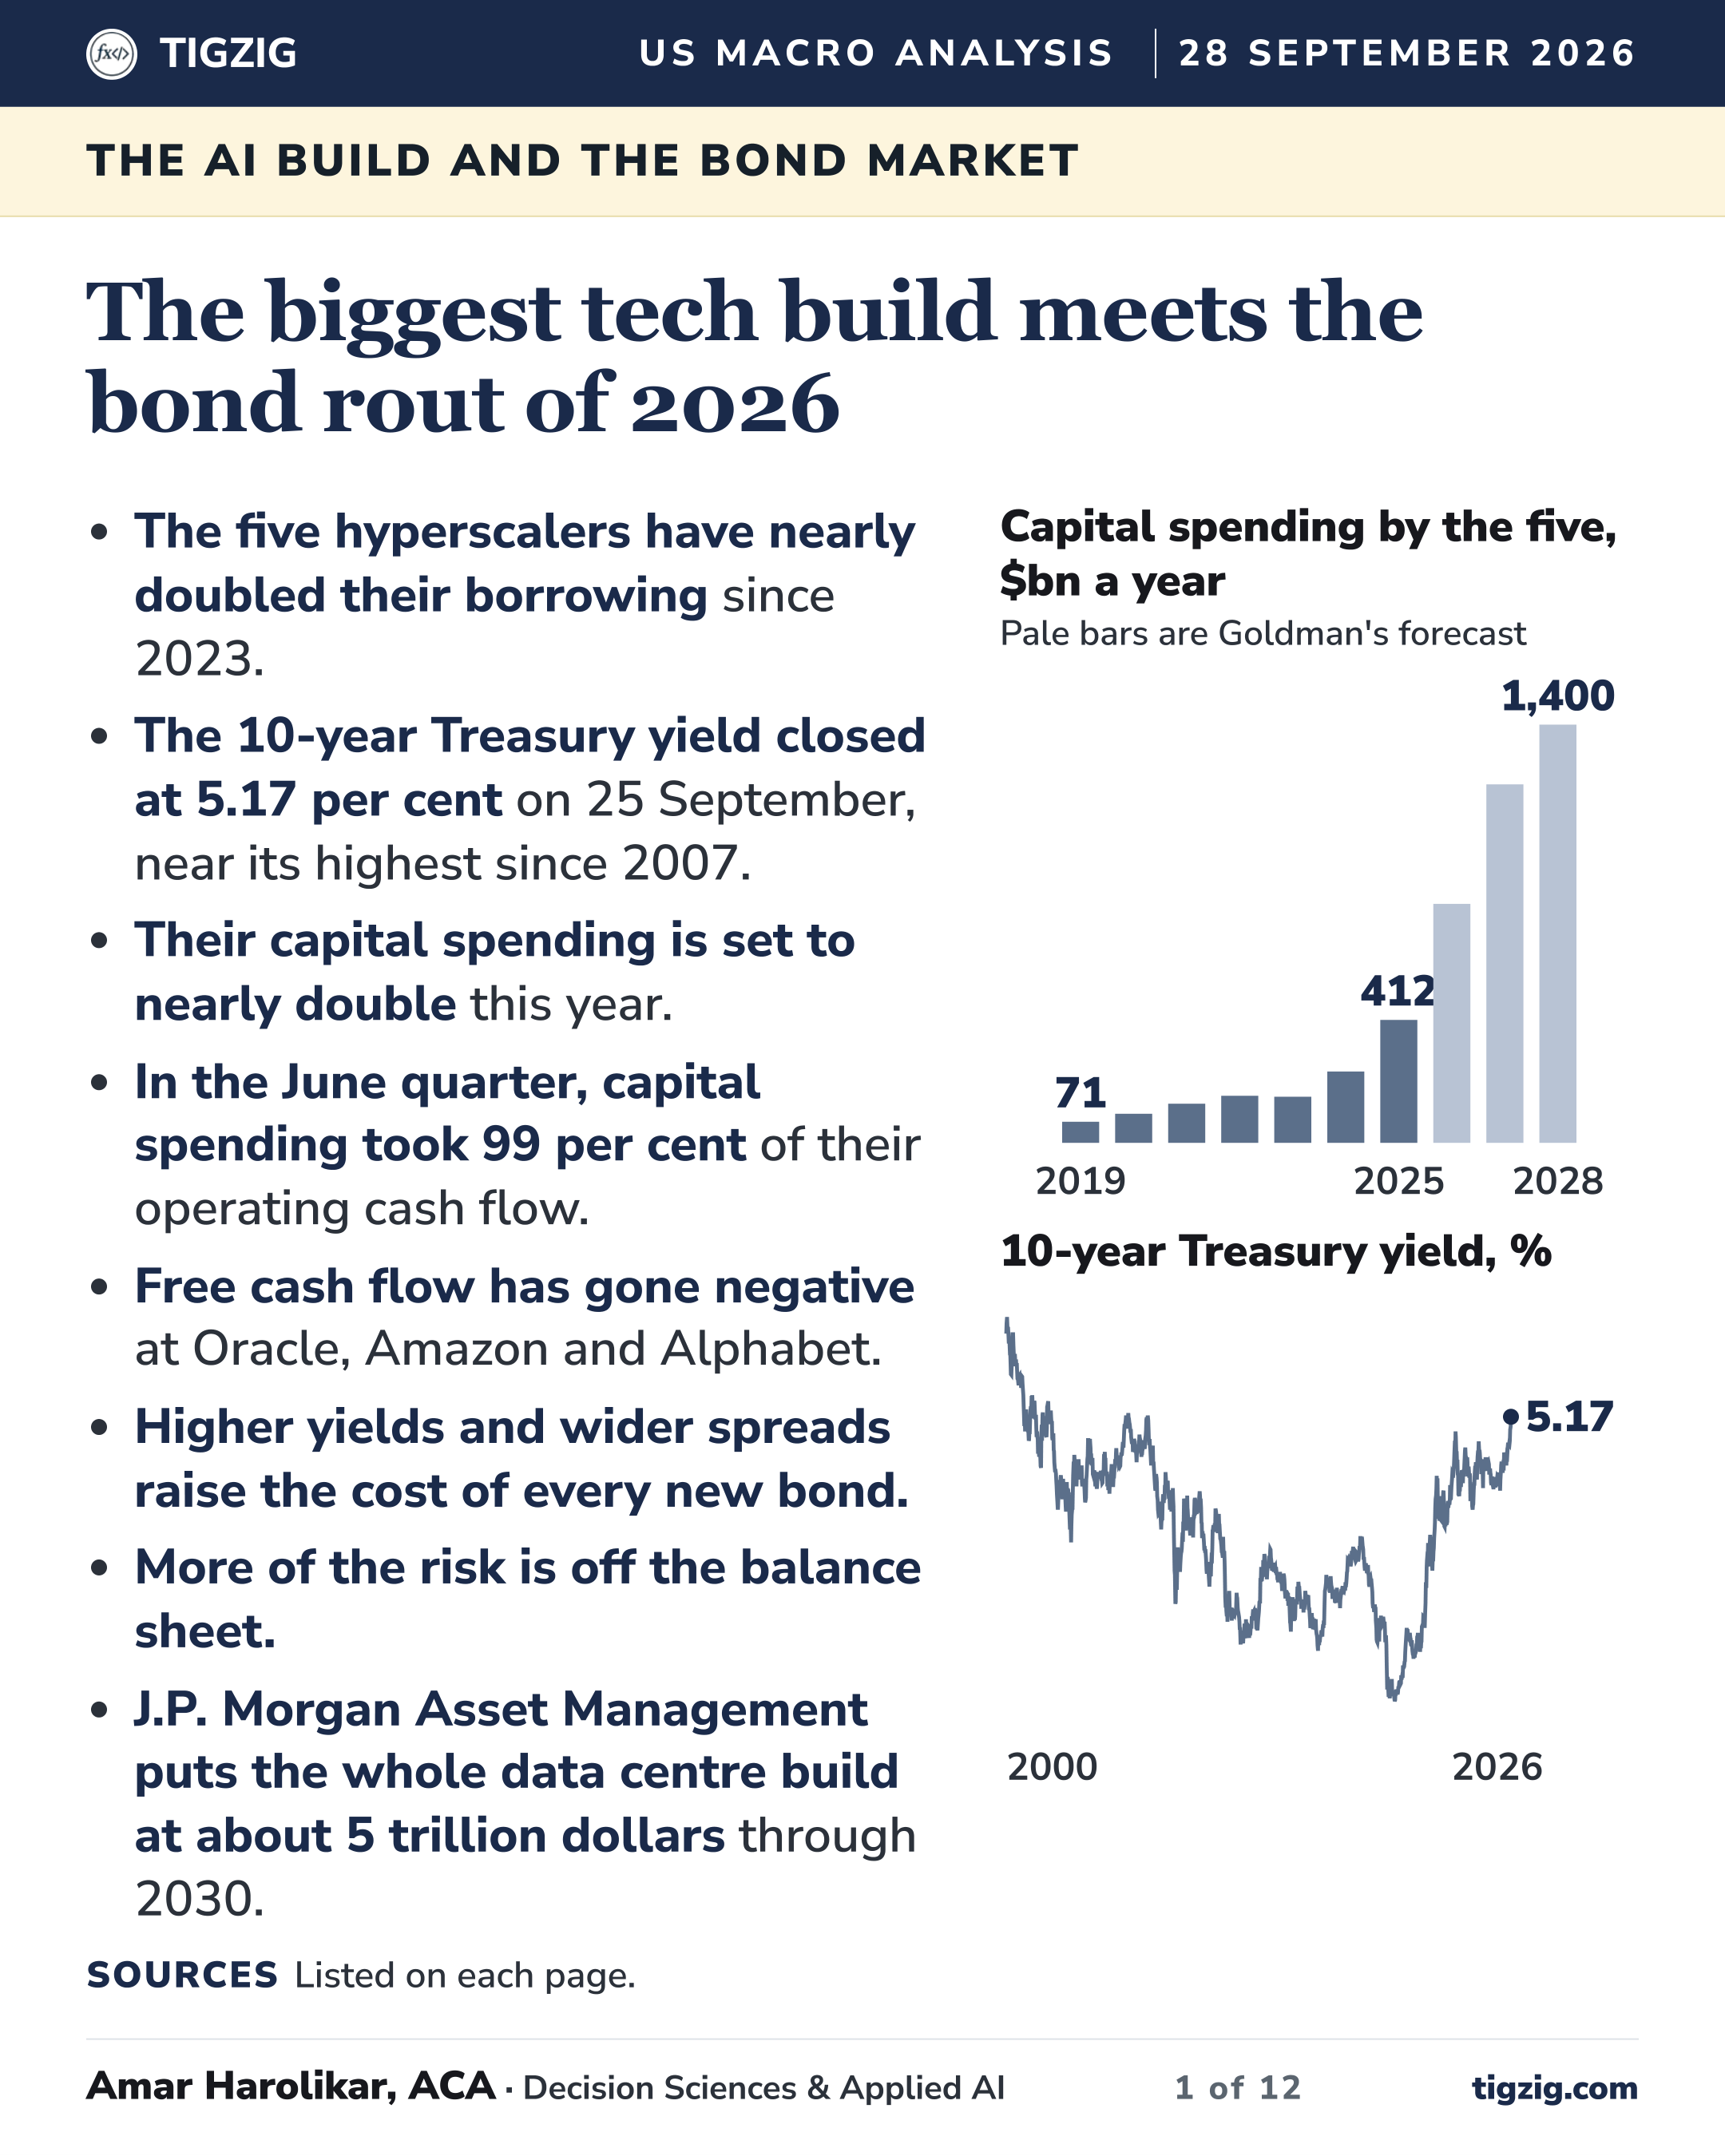
Goldman expects the five hyperscalers to spend $3.4 trillion on AI in the next three years, nearly 3x the previous seven years. That spending now meets the 2026 bond rout, with yields at their highest since 2007.
Free cash flow has gone negative at three of the five
Alphabet: negative in Q2'26, the first time since Google listed in 2004.
Oracle: negative six quarters in a row.
Amazon: negative in both quarters of 2026.
Where the strain shows up
Oracle is under the most strain. S&P cut it to BBB-, one notch above junk. Customers paying in advance are funding part of its build, and a source told Reuters its Jupiter data centre faces a one-year delay.
In the June quarter, capital spending took 99% of the operating cash flow of the five hyperscalers.
The borrowing of the five has already nearly doubled since 2023, to $483 billion of bonds and loans. J.P. Morgan Asset Management expects them to sell about $279 billion of bonds this year alone, against $17 billion in 2024.
Every new bond now prices off higher yields, and investors already charge AI issuers a wider spread than other high-grade companies.
Then there is the off-balance-sheet risk: $1.1 trillion of leases that start later, and guarantees on data centres.
And then there is the wider build, which J.P. Morgan Asset Management puts at about $5 trillion through 2030.
This is one pressure point among several. Credit is showing strain at banks, credit unions and households, the job market is weaker under its headline numbers, and the Iran war and oil prices add to it, with valuations still stretched. I have looked at each of these in earlier notes.
Some quick notes
Capital spending on pages 3 and 4 is as the companies report it, worldwide, measured against US GDP, the same basis Apollo uses. Pages 7 and 8 add finance lease repayments.
Debt is bonds, loans and commercial paper, with leases left out. The latest figures are for June 2026, and for Oracle August 2026, since its quarters end a month early.
The 99% is the June quarter. Over the last four quarters, capital spending took about 83% of operating cash flow.
The five held about $570 billion in cash and short-term investments in June, part of it borrowed or raised and not yet spent. Oracle has far more debt than cash.
On the wider spreads, fund managers told Reuters on 22 September that they reflect the flood of new bonds, and that they are not worried about default.
The $5 trillion is J.P. Morgan Asset Management's estimate for the whole data centre build. The $4.1 trillion of AI-related debt is from JPMorgan research, as reported by CNBC.
Earlier notes on the other pressure points
Bond market rout, 25 September. The 10-year closed above 5% for the first time since 2007, and almost all of the rise is the real yield. tigzig.com/post/bond-market-rout-sep2026
US jobs, 24 September. Payroll growth has slowed to 0.4% a year, hiring is near its lowest on record and hourly pay has trailed prices for five months in a row. tigzig.com/post/us-jobs-calm-before-storm-sep2026
Diesel above $6, 26 September. Up 74% on a year, with the cost moving into freight rates, airfares and heating oil. tigzig.com/post/diesel-above-six-dollars-sep2026
Credit unions, 19 September. Charge-offs at 0.76%, above Q3 2007, with consumer loans doing most of the loss. tigzig.com/post/credit-union-q2-2026-losses-delinquency-sep2026
US banks and non-banks, 30 August. $2.8 trillion committed to non-bank lenders at the end of Q2, $1.7 trillion drawn. tigzig.com/post/us-banks-nonbank-lending-q2-2026
AI valuations, 31 August. The ECB and the chair of the Financial Stability Board both argue a correction is more likely. tigzig.com/post/ai-valuation-correction-aug2026
The biggest tech build meets the bond rout of 2026
Browse the slides or download the PDF
Full Deck Content (Text Format)
Text below was extracted from the source deck. Chart visuals stay in the PDF and as slide images above the post.
Slide 1
TIGZIGUS Macro Analysis 28 September 2026
The AI build and the bond market The biggest tech build meets the bond rout of 2026
The five hyperscalers have nearly doubled their borrowing since 2023.
The 10-year Treasury yield closed at 5.17 per cent on 25 September, near its highest since 2007.
Their capital spending is set to nearly double this year.
In the June quarter, capital spending took 99 per cent of their operating cash flow.
Free cash flow has gone negative at Oracle, Amazon and Alphabet.
Higher yields and wider spreads raise the cost of every new bond.
More of the risk is off the balance sheet.
J.P. Morgan Asset Management puts the whole data centre build at about 5 trillion dollars through 2030.
Capital spending by the five, $bn a year Pale bars are Goldman's forecast 71 2019 412 2025 1,400 2028 10-year Treasury yield, % 5.17 2000 2026
SourcesListed on each page.
Amar Harolikar, ACA · Decision Sciences & Applied AI1 of 12tigzig.com
Slide 2
TIGZIGThe bond market
The bond market
The bond market rout has taken the 10-year Treasury yield to its highest since 2007
10-year Treasury yield per cent, weekly, 2000 to 25 September 2026 0% 2% 4% 6% 5.17 2000 2008 2016 2024
2-year Treasury yield per cent, weekly, same period 0% 2% 4% 6% 4.81 2000 2008 2016 2024
This year. The 10-year has risen about 1 point since January, from 4.18 to 5.17 per cent. The 2-year rose from 3.47 to 4.81. The Fed raised rates by a quarter point on 16 September. How it reaches the five. Higher yields raise the cost of every new bond they sell and every bond they refinance, and of any floating-rate loans. Wider spreads come on top.
Sources and methodsFRED DGS10 and DGS2 via TREMOR to 23 September, US Treasury par yield curve for 24 and 25 September. Dashed line at 5 per cent. Fed, 16 Sep. Background: Bond Markets Are Sounding an Alarm, 6 Sep and The bond market rout of 2026, 25 Sep
Amar Harolikar · Decision Sciences & Applied AI2 of 12tigzig.com
Slide 3
TIGZIGThe size of the build
The size of the build
The five now spend a larger share of US GDP than the fibre boom did at its peak
Capital spending by the five per cent of US GDP Fibre boom peak Our calculation Consensus, via Apollo 1.2 2000 0.33 2019 0.45 2020 0.55 2021 0.61 2022 0.55 2023 0.82 2024 1.34 2025 2.05 H1 26 about 3 2027-29
The fibre boom. The late 1990s telecom build peaked at 1.2 per cent of GDP in 2000, then collapsed into a recession. Earlier booms. Goldman puts the railway, electricity and car booms at 2 to 3 per cent at their peaks. Close to Apollo. Our 2025 figure is 1.34 per cent, Apollo's 1.4. For 2019 ours is 0.33, Apollo's 0.3.
Sources and methodsApollo, 6 Aug 2026. Business Insider, 11 Jun. SEC filings of Microsoft, Amazon, Alphabet, Meta and Oracle. BEA GDP via FRED. Method: the five's worldwide capital expenditure over US nominal GDP, the basis Apollo uses, calendar years. H1 2026 is half a year of spending over half a year of GDP
Amar Harolikar · Decision Sciences & Applied AI3 of 12tigzig.com
Slide 4
TIGZIGThe size of the build
The size of the build
The five spent 412 billion last year. Goldman expects 800 billion this year.
More of it now has to be borrowed, at higher yields and wider spreads. That makes the plan dearer and harder to fund. Capital spending by the five $bn a year From their filings Goldman Sachs forecast 71 2019 97 2020 131 2021 158 2022 154 2023 239 2024 412 2025 330 H1 26 800 2026 1,200 2027 1,400 2028
From their filings. The five spent 71 billion dollars in 2019 and 412 billion in 2025. This year. 330 billion in the first half. Goldman's 800 billion needs 470 billion in the second. Next. Goldman expects 1.2 trillion in 2027 and 1.4 trillion in 2028.
Sources and methodsSEC filings of Microsoft, Amazon, Alphabet, Meta and Oracle. Goldman Sachs, 23 Sep. Method: capital expenditure as filed, by calendar year. H1 is January to June, and Oracle's quarters end a month early
Amar Harolikar · Decision Sciences & Applied AI4 of 12tigzig.com
Slide 5
TIGZIGThe debt
The debt
The five have nearly doubled their borrowing since 2023
Their new bonds now price off Treasury yields near or above 5 per cent.
Their bonds and loans rose from 259 billion dollars in Q3 2023 to 483 billion.
J.P. Morgan Asset Management expects them to sell about 279 billion dollars of bonds this year, up from 17 billion in 2024. It says their free cash flow no longer covers the build.
They held about 570 billion dollars in cash and short-term investments in June (Oracle August), part of it borrowed or raised and not yet spent. Oracle has far more debt than cash.
Bonds and loans on the balance sheet $bn Q3 2023 Latest quarter: June 2026, Oracle August 2026 89 125 Oracle 68 133 Amazon 13 100 Alphabet 18 84 Meta 72 40 Microsoft
Sources and methodsSEC filings of Microsoft, Amazon, Alphabet, Meta and Oracle. J.P. Morgan Asset Management, 5 Aug. Method: bonds, loans and commercial paper at carrying amount, current and non-current; leases excluded. Latest is Jun 2026, Oracle Aug 2026. Microsoft's 2023 figure includes 25.8 billion of commercial paper
Amar Harolikar · Decision Sciences & Applied AI5 of 12tigzig.com
Slide 6
TIGZIGThe price of borrowing
The price of borrowing
Investors now charge the AI builders more than other high-grade companies
Bond spreads basis points, September 2026 AI-related issuers, Goldman data 115 US high grade, ICE BofA 78
Credit insurance, five-year basis points: Amazon, Google, Microsoft, Oracle Four hyperscalers, average about 100 Five big US banks about 40
Cover ratio orders per dollar on sale, hyperscaler deals, Apollo Hyperscaler bonds, February nearly 5x Hyperscaler bonds, July below 2x
Apollo says their credit rests on one assumption: operating cash flow tripling, from 600 billion dollars in 2025 to 2 trillion in 2030. That is the consensus forecast. If it falls short, Apollo sees wider spreads, less capital spending and slower US growth. The other reading. Fund managers told Reuters the wider spread reflects the flood of new bonds. They are not worried about default.
Sources and methodsSpread and credit insurance readings from 16 to 22 Sep, before yields jumped on 23 and 24 Sep; cover ratios are Feb and Jul. Reuters, 22 Sep. Apollo, 16 Sep, Apollo, 15 Jul and Apollo, 21 Sep. Apollo via CNBC, 16 Sep. Our check from filings puts the five's 2025 operating cash flow at 603 billion
Amar Harolikar · Decision Sciences & Applied AI6 of 12tigzig.com
Slide 7
TIGZIGThe cash flow
The cash flow
Capital spending took 99 per cent of their operating cash flow in the June quarter
Interest is paid out of this cash flow, so higher rates will shrink it, most of all at Oracle relative to its size. Operating cash flow $bn a quarter 0 $100bn $200bn 110 Q3 23 Q3 24 Q3 25 186 Q2 26
Capital spending $bn a quarter, plus finance lease repayments 0 $100bn $200bn 40 Q3 23 Q3 24 Q3 25 184 Q2 26
Free cash flow $bn a quarter 0 $50bn $100bn 70 Q3 23 Q3 24 Q3 25 2.2 Q2 26
Share of cash flow spent per cent of operating cash flow 0 50% 100% 36% 99% Q3 23 Q3 24 Q2 26
Sources and methodsSEC filings of Microsoft, Amazon, Alphabet, Meta and Oracle. Method: free cash flow is operating cash flow less capital expenditure and finance lease principal, by calendar quarter. Oracle's quarters end a month early
Amar Harolikar · Decision Sciences & Applied AI7 of 12tigzig.com
Slide 8
TIGZIGThe cash flow
The cash flow, company by company
Free cash flow is turning negative
Higher interest costs will add to the pressure, most of all at Oracle relative to its cash flow.
Oracle: negative six quarters in a row.
Amazon: negative in both quarters this year.
Alphabet: negative for the first time since Google listed in 2004.
Oracle * 5.7 0.1 -5.4 Q3 23 Q3 26
Amazon 7.7 -8.4 -9.2 Q3 23 Q2 26
Alphabet 22.6 18.8 -6.2 Q3 23 Q2 26
Microsoft 20.4 19.9 18.7 Q3 23 Q2 26
Neither Microsoft nor Meta has had a negative quarter since Q3 2023. Meta's June quarter, 0.8 billion, was its lowest.
Meta 13.6 10.3 0.8 Q3 23 Q2 26
Sources and methodsSEC filings of Microsoft, Amazon, Alphabet, Meta and Oracle. Method: free cash flow is operating cash flow less capital expenditure and finance lease principal. Charts are $bn a quarter, all on one scale. * Oracle's quarters end a month early, so its last bar is the quarter to 31 August 2026
Amar Harolikar · Decision Sciences & Applied AI8 of 12tigzig.com
Slide 9
TIGZIGOracle
Oracle
Oracle is under the most credit strain of the five
Free cash flow Minus 5.4 billion dollars in the quarter to 31 August, the sixth negative quarter in a row.
Capital spending 28.5 billion in that quarter. In June it guided to 90 to 95 billion for the year to May 2027.
Paid in advance At least 11.4 billion of its operating cash flow in the quarter was customers paying ahead. It also sold about 20 billion dollars of new shares.
Credit rating BBB- at S&P, one notch above junk, after a July downgrade.
The Jupiter loans Banks quoted the 18 billion dollars of project loans on the New Mexico campus Oracle leases at 89 to 91 cents on the dollar.
The delay It sent the developer a force majeure notice to delay payment if Jupiter misses its 2028 start, Bloomberg reported. A person familiar with the deal told Reuters it faces a one-year delay. Oracle says it is on schedule.
Its shares Down about 30 per cent this year, 7 per cent in the week of the notice.
Sources and methodsOracle 10-Q, Aug 2026. Morningstar, Jun. Reuters citing the FT, 18 Sep. Bloomberg via CNBC, 24 Sep. Reuters, 24 Sep. CNBC, 27 Sep
Amar Harolikar · Decision Sciences & Applied AI9 of 12tigzig.com
Slide 10
TIGZIGOff the balance sheet
Off the balance sheet
The five have signed 1.1 trillion dollars of leases that start later, and two of them have given guarantees on data centres
Leases signed that start later $bn, total payments over the lease terms Microsoft 329 Oracle 288 Meta 279 Amazon 137 Alphabet 85
Guarantees on data centres $bn, the most they could pay Alphabet, data centres 43.8 Meta, Hyperion 28.0 Meta, El Paso, planned 13.0 Nvidia, OpenAI, from 2028 105.0
Tenant guarantees. If a tenant stops paying rent, Alphabet pays. Its backstops rose from 16.9 to 43.8 billion dollars in six months. Nvidia backs OpenAI's Ohio campus the same way, phased in from 2028. A resale value guarantee. If Meta leaves its Hyperion campus and it is valued below a set amount, Meta pays the gap. None of it is debt yet. It is not in the borrowing on page 5.
Sources and methodsCompany filings: Microsoft 10-K, Jun 2026; Amazon 10-Q, Jun 2026; Meta 10-Q, Jun 2026; Alphabet; Oracle 10-Q, Aug 2026; Nvidia 10-Q. Nvidia, in grey, is not one of the five. The bar for Meta leaves out about 68 billion dollars of leases signed in July
Amar Harolikar · Decision Sciences & Applied AI10 of 12tigzig.com
Slide 11
TIGZIGBeyond the five
Beyond the five
J.P. Morgan Asset Management says the whole data centre build could cost about 5 trillion dollars through 2030. The five are one part of it
How big J.P. Morgan Asset Management: about 5 trillion dollars through 2030, about 2 trillion of it from investment-grade credit markets. A separate JPMorgan estimate puts all AI-related borrowing through 2030 at 4.1 trillion, CNBC reported.
Weaker borrowers pay more SoftBank sold 11.1 billion dollars of junk bonds in September at up to 9.75 per cent. Of some 50 neoclouds, lenders want about 20, one lender said.
Opposition is broad 71 per cent of Americans oppose an AI data centre in their area, Gallup found. On 21 September Texas halted state permits for data centres until a grid audit is done.
Borrowers keep going "If you have a deal with Anthropic, will 50 basis points really stop you?" Bernie Margulies of American Compute told CNBC.
Sources and methodsJ.P. Morgan Asset Management, 5 Aug. CNBC, 27 Sep. Gallup, May. Texas governor, 21 Sep
Amar Harolikar · Decision Sciences & Applied AI11 of 12tigzig.com
Slide 12
TIGZIGEarlier
Earlier
Bonds, rates and flows 28 Sep 2026Foreign buying of US stocks hit a record 25 Sep 2026The bond market rout of 2026 14 Sep 2026The Fed and its September rate decision 6 Sep 2026Bond markets are sounding an alarm The AI build and valuations 31 Aug 2026A correction in AI valuations looks more likely 16 Jul 2026Three warnings on the AI valuation boom 30 Jun 2026The BIS red-flagged the AI boom 17 May 2026S&P at 7,400. Irrational exuberance Jobs 24 Sep 2026The US job market looks fine on the headline numbers 11 Jun 2026US unemployment is 4.3%. The data underneath Credit 30 Aug 2026US banks, 2.8 trillion committed to non-banks 28 May 2026Private credit. A market for lemons
More at tigzig.com/analysis
Amar Harolikar · Decision Sciences & Applied AI12 of 12tigzig.com
Working on something similar? How I work covers the rates, the availability and what I take on.