QREP in Excel: 81 Risk and Return Metrics Inside Your Sheet Through Claude in Excel.
Published: June 29, 2026
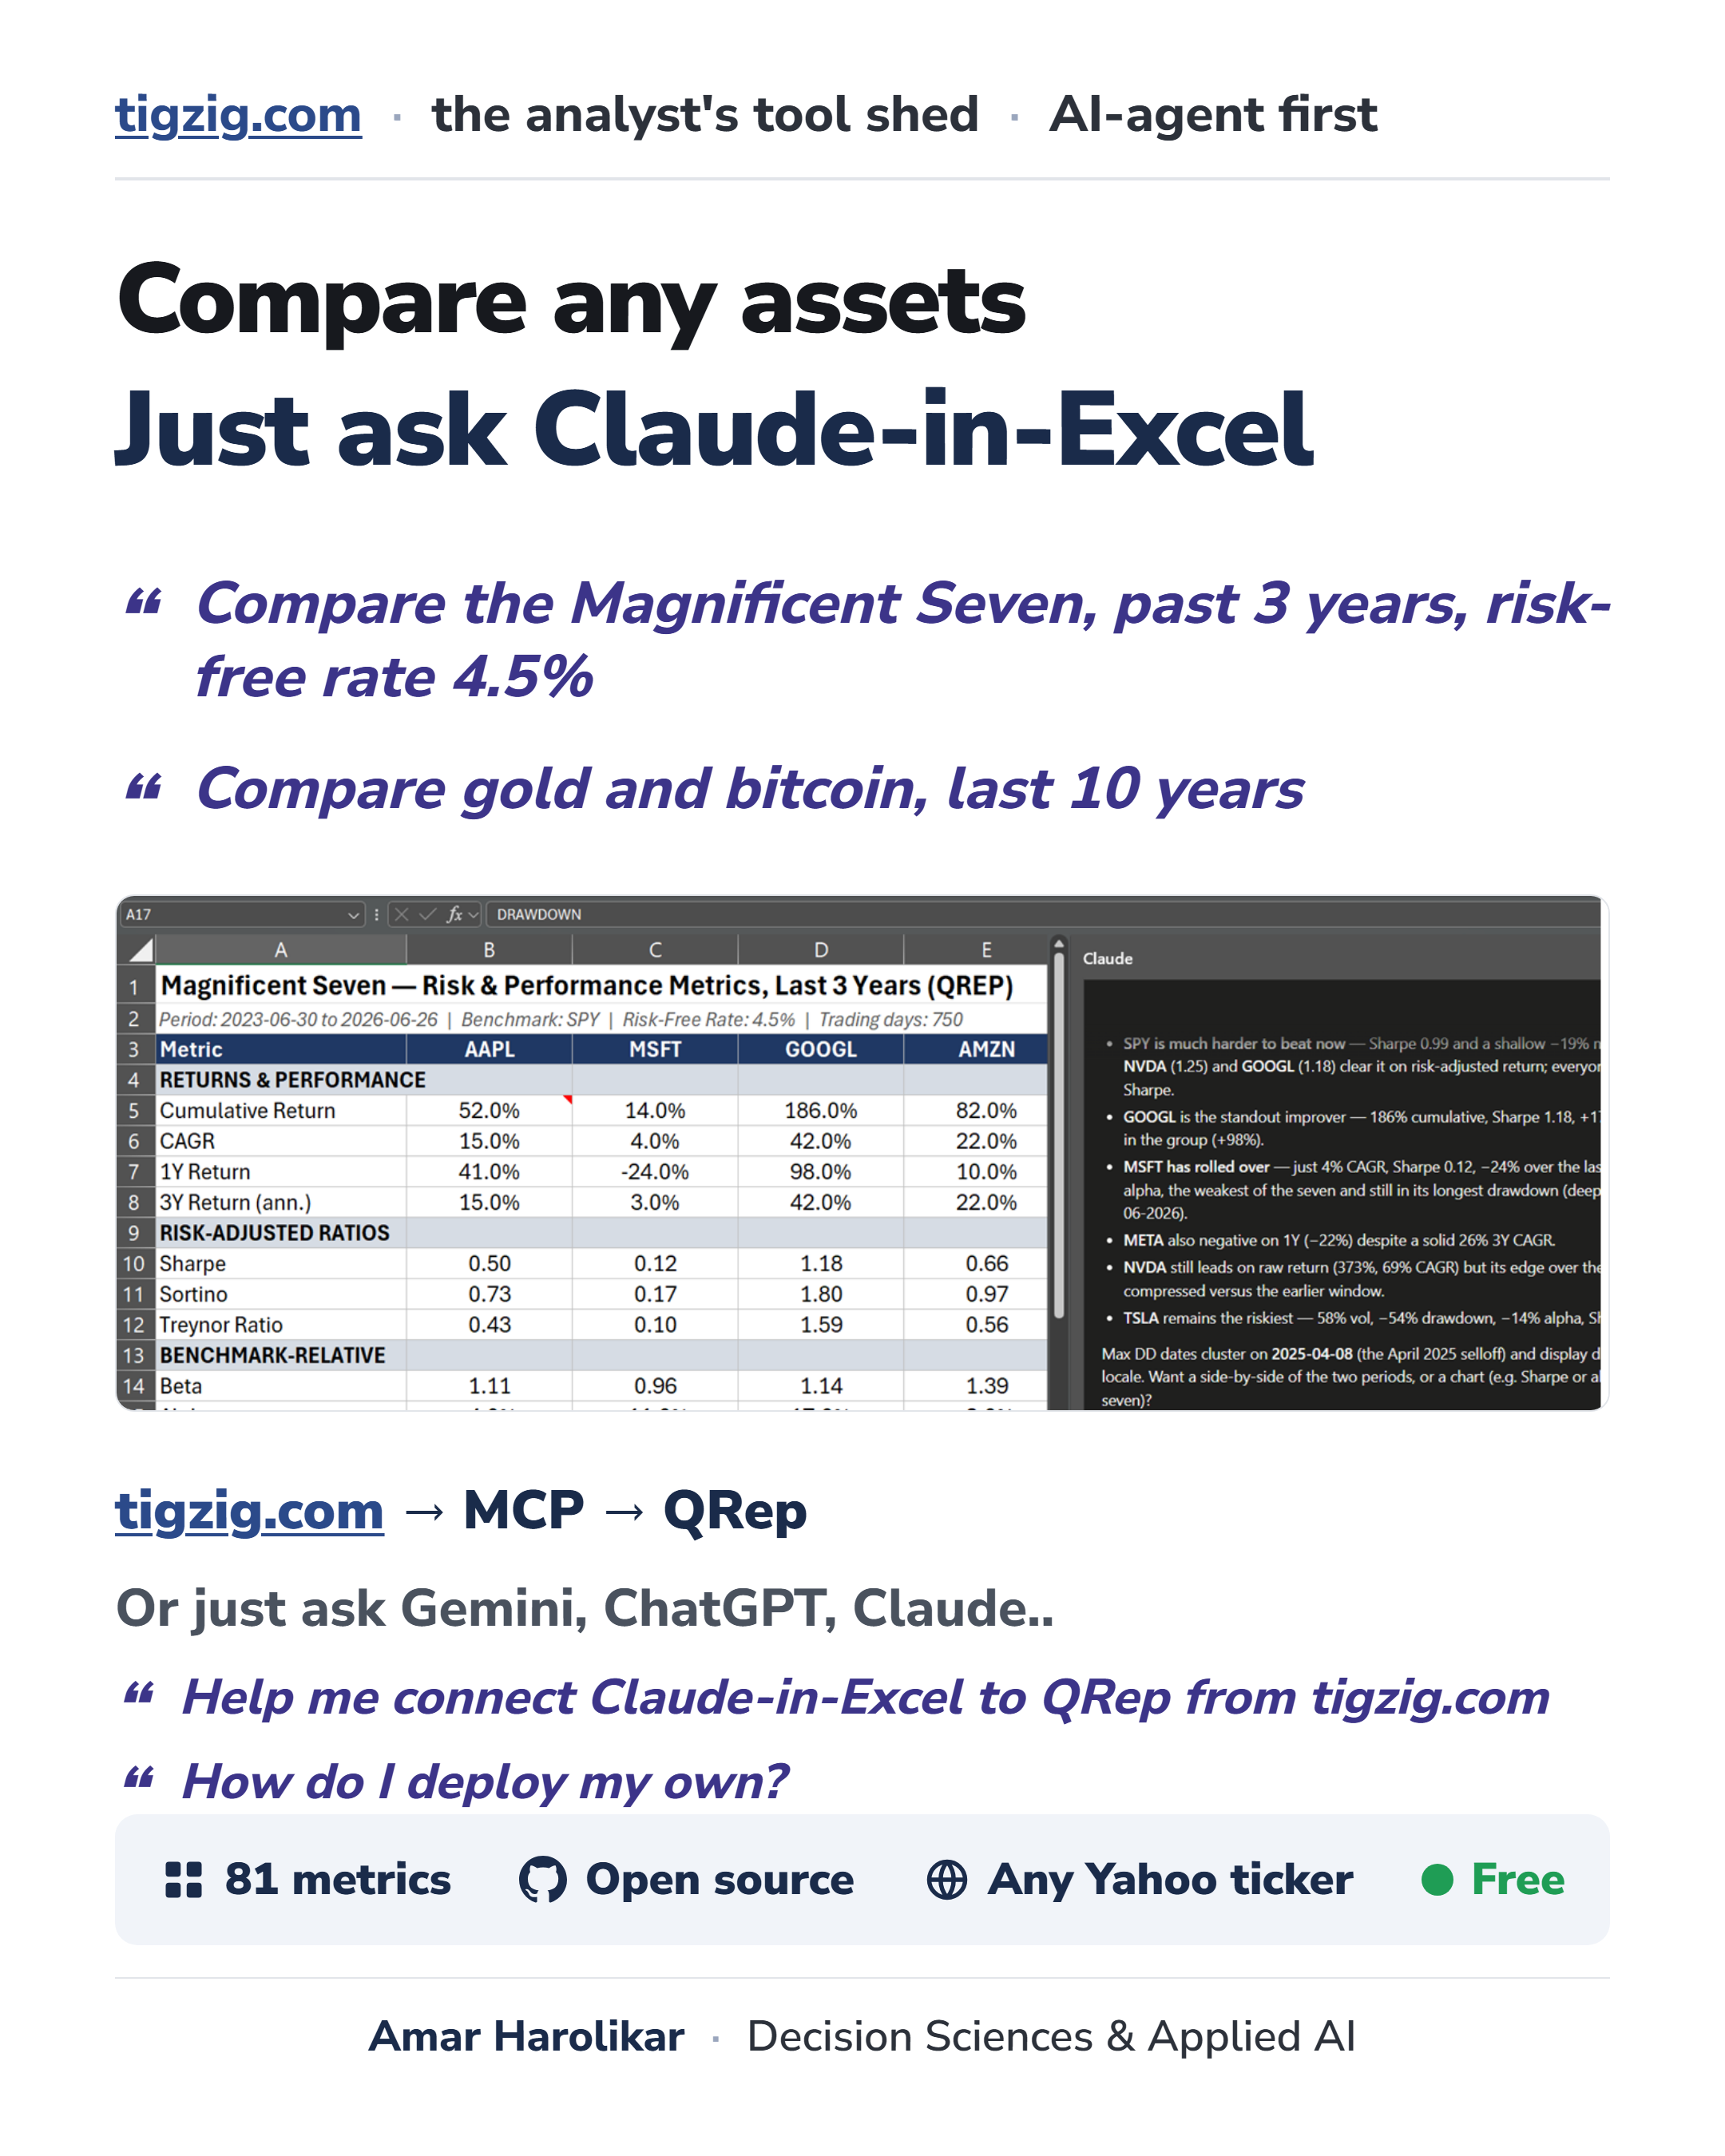
Asset Returns, drawdowns, Sharpe, Sortino, alpha, beta, volatility.. QREP does it inside Excel. Straight into your sheet through Claude in Excel. 81 risk and return metrics.
Just ask Claude in Excel e.g. "Compare gold and bitcoin, last 10 years." or "compare Mag 7 past 10 years"... or any other stock, commodity, crypto etc that's there on Yahoo Finance.
Change symbols, time period, run your cuts the way you want ... have it format it the way you like, or push it into a deck.. or just do it directly in PowerPoint ....works the same way.
How to get it:
For you: the QRep MCP guide is here -> Tigzig.com ⇒ MCP ⇒ QREP
For your AI: just ask Gemini, ChatGPT or Claude etc "help me connect Claude in Excel to QRep from tigzig.com" and it will walk you through it.
Wary of connecting to someone else's MCP server? Fair.. that is the right instinct. The code is open source, a single Python file. Just ask your AI "help me deploy the QREP MCP server from tigzig.com" .. it knows where to go and what to do.
It is free to use. Powered by Ran Aroussi's QuantStats.
A few practical tips
A few practical tips if you start using this... also useful for any other analysis that you are doing with various avatars of Claude - Excel, PowerPoint, Cowork.
- The same connector works in PowerPoint too. So you can pull the numbers and have Claude build a formatted deck right there, and keep iterating on it as you go.
- Often it is easier to run your iterations in Excel first, get the numbers the way you want, then have Claude in Excel hand it over to Claude in PowerPoint for the deck. They can talk to each other. One catch.. the Claude window has to stay open and active, otherwise the connector does not respond.
- If you want really fine-tuned deck formatting, Claude in PowerPoint gets heavy and slow. For that I just go to Claude Cowork, have it build the output in HTML with whatever fonts and sizing I want.. a full research-report look or a plain one.. then convert it to PDF. Check my Claude Cowork Guide here tigzig.com/post/working-with-claude-cowork-claude-code-jun2026 .. or even easier - just have Cowork walk you through it ...
A few guides
- Claude Cowork Guide: tigzig.com/post/working-with-claude-cowork-claude-code-jun2026
- Claude in Excel & PowerPoint, 26 working tips: tigzig.com/post/claude-in-excel-powerpoint-working-tips
- Claude, the universal agent: tigzig.com/post/claude-the-universal-agent