FY 2025-26 BRSR Data Is Live on VIGIL: ESG Disclosures for 663 of the 750 Nifty Total Market Companies
Published: October 2, 2026
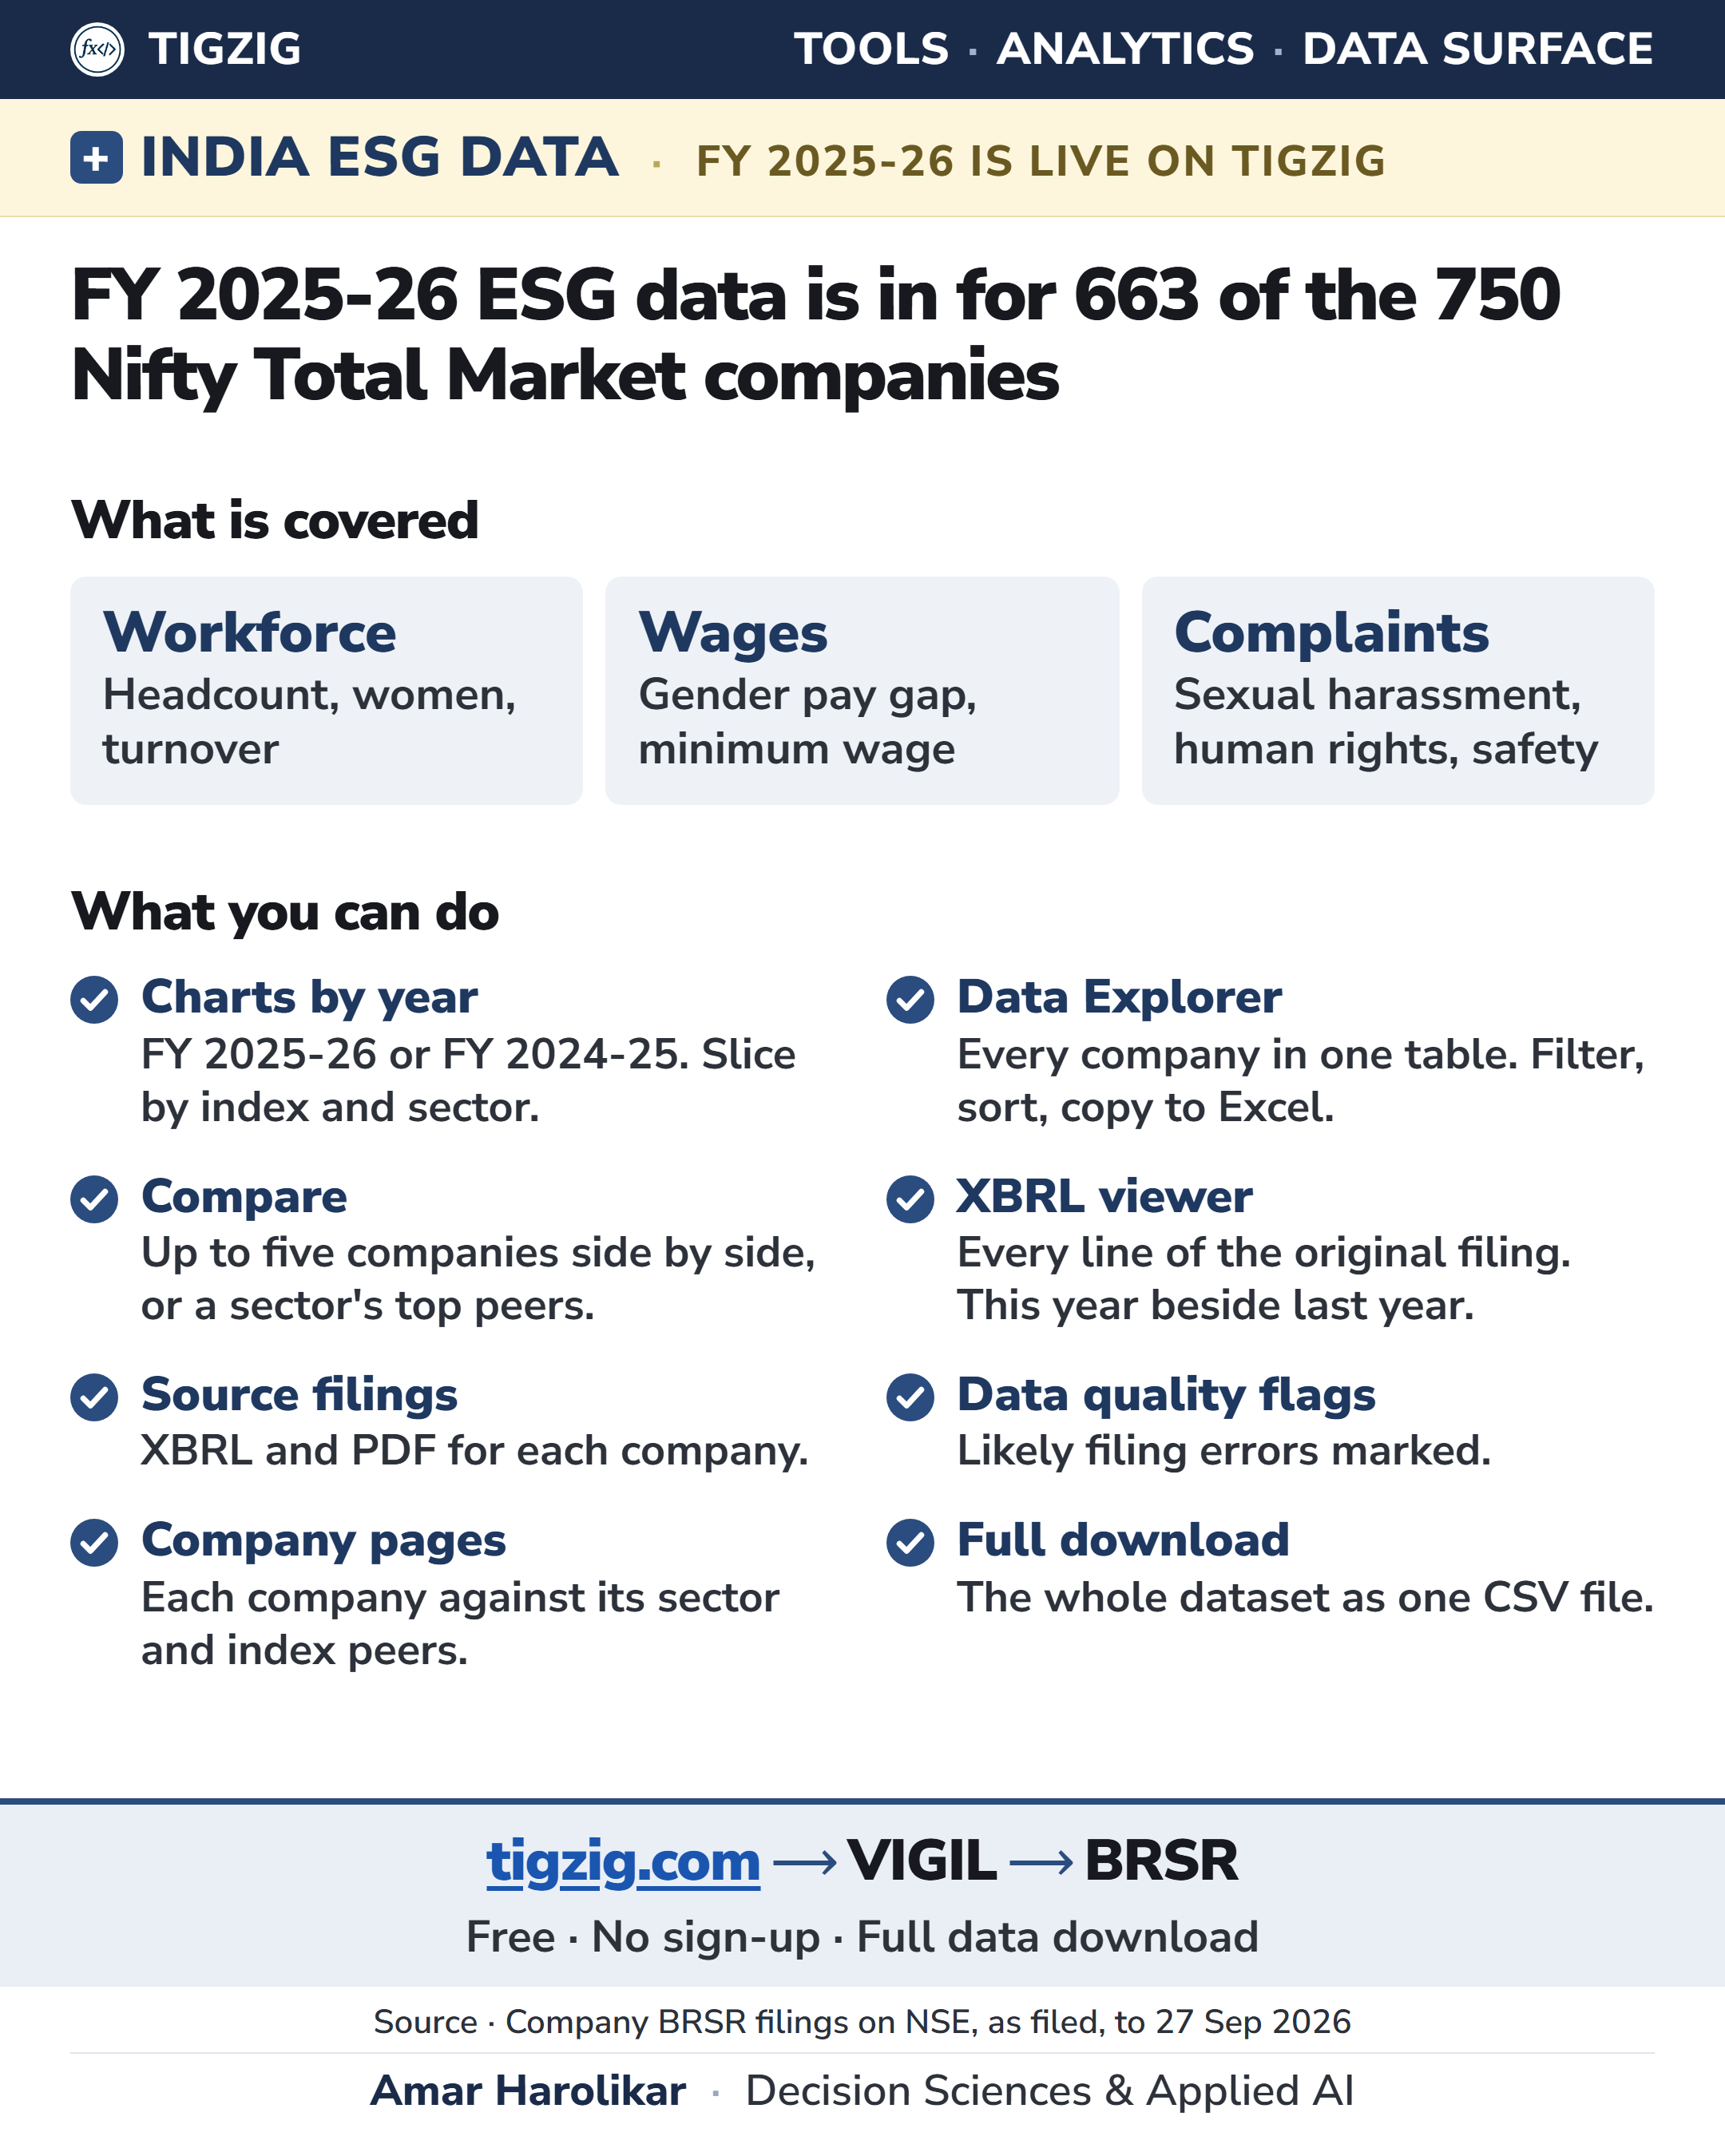
Releasing the FY 2025-26 BRSR data on VIGIL. ESG disclosures for 663 of the 750 Nifty Total Market companies.
BRSR is the annual sustainability report SEBI requires from the top 1,000 listed companies. This release covers the workforce, pay and complaints sections.
What we cover on VIGIL
Workforce: headcount split by permanent and contract, employees and workers, women and men, the share of women up to the board and key management, plus turnover and parental leave
Pay: median pay of women and men for employees, workers, key managers and the board, plus minimum wage compliance and wages by town class
Complaints: sexual harassment under the POSH Act and seven other complaint types, with how many were resolved
Questions you can take to it
How many women are on the board, in key management and on the shop floor, and how does a company compare with its sector?
Which companies pay a large share of their workforce at the minimum wage?
Where is the gap between women's and men's pay widest?
How did a company's numbers move between FY 2024-25 and FY 2025-26?
How to use it
Charts by index and sector, a Data Explorer table that copies straight into Excel, a side by side compare of up to five companies, an XBRL viewer with every line of the filing, links to each company's XBRL and PDF, and the full dataset as one CSV.
Tool, data-download and docs at https://www.tigzig.com/vigil ➜ BRSR
How the year views work, and how the data is checked
Few quick points
Each year view reads one report per company. CY is that year and PY is the previous-year column printed in the same report. So a company's PY in the FY 2025-26 view can differ from its CY in the FY 2024-25 view, when it changed last year's figures in the new report.
Companies with a December year-end are placed in the year that holds their year-end, so a calendar 2025 report is in the FY 2025-26 view. A few companies have not filed FY 2025-26 yet and stay in the FY 2024-25 view.
Values are shown as filed. Where a figure looks wrong, such as wages filed in the wrong unit, it is flagged on the chart and listed in the Data Quality tab with the reason, and it is kept out of the medians where it would distort them.
How it is built and checked
Methodology tab: the XBRL tags behind all the charts, the definitions and how each figure is calculated
Data Quality tab ➜ Consistency Checks: the checks run on every filing, year by year
Data Quality tab ➜ PDF Validation: XBRL figures checked against the printed PDF report for the Nifty 100
Working on something similar? How I work covers the rates, the availability and what I take on.