May 2026's Record US Retail Sales Number Is Hiding the Pain. Real Spending Hasn't Grown in Five Years. The Consumer Is Squeezed.
Published: June 18, 2026
The May'26 record US retail sales numbers are hiding the pain of the US consumer being squeezed...long before the Iran war started.
Strip out inflation and real retail spending has not grown in five years (that breakdown is in the carousel). The consumer is stretched and dipping into savings ... with rising defaults on card and other loans.
And as if that was not enough, the job market has been softening since 2024.. unemployment at 4.3%, underemployment 8.1%, long-term joblessness near a three-year high.
Cheaper oil is real relief on the price side. But it does not refill a drained savings account, or put the long-term unemployed back to work. The pressure was here before the war, and it outlasts the relief.
Spending side in the carousel. The jobs story is its own piece on tigzig.com.
US Consumer Squeeze - 6-Slide Deck
Browse the slides or download the PDF
Full Deck Content (Text Format)
Text below is extracted from the source HTML the PDF was rendered from. The 6 slide images above are the visual.
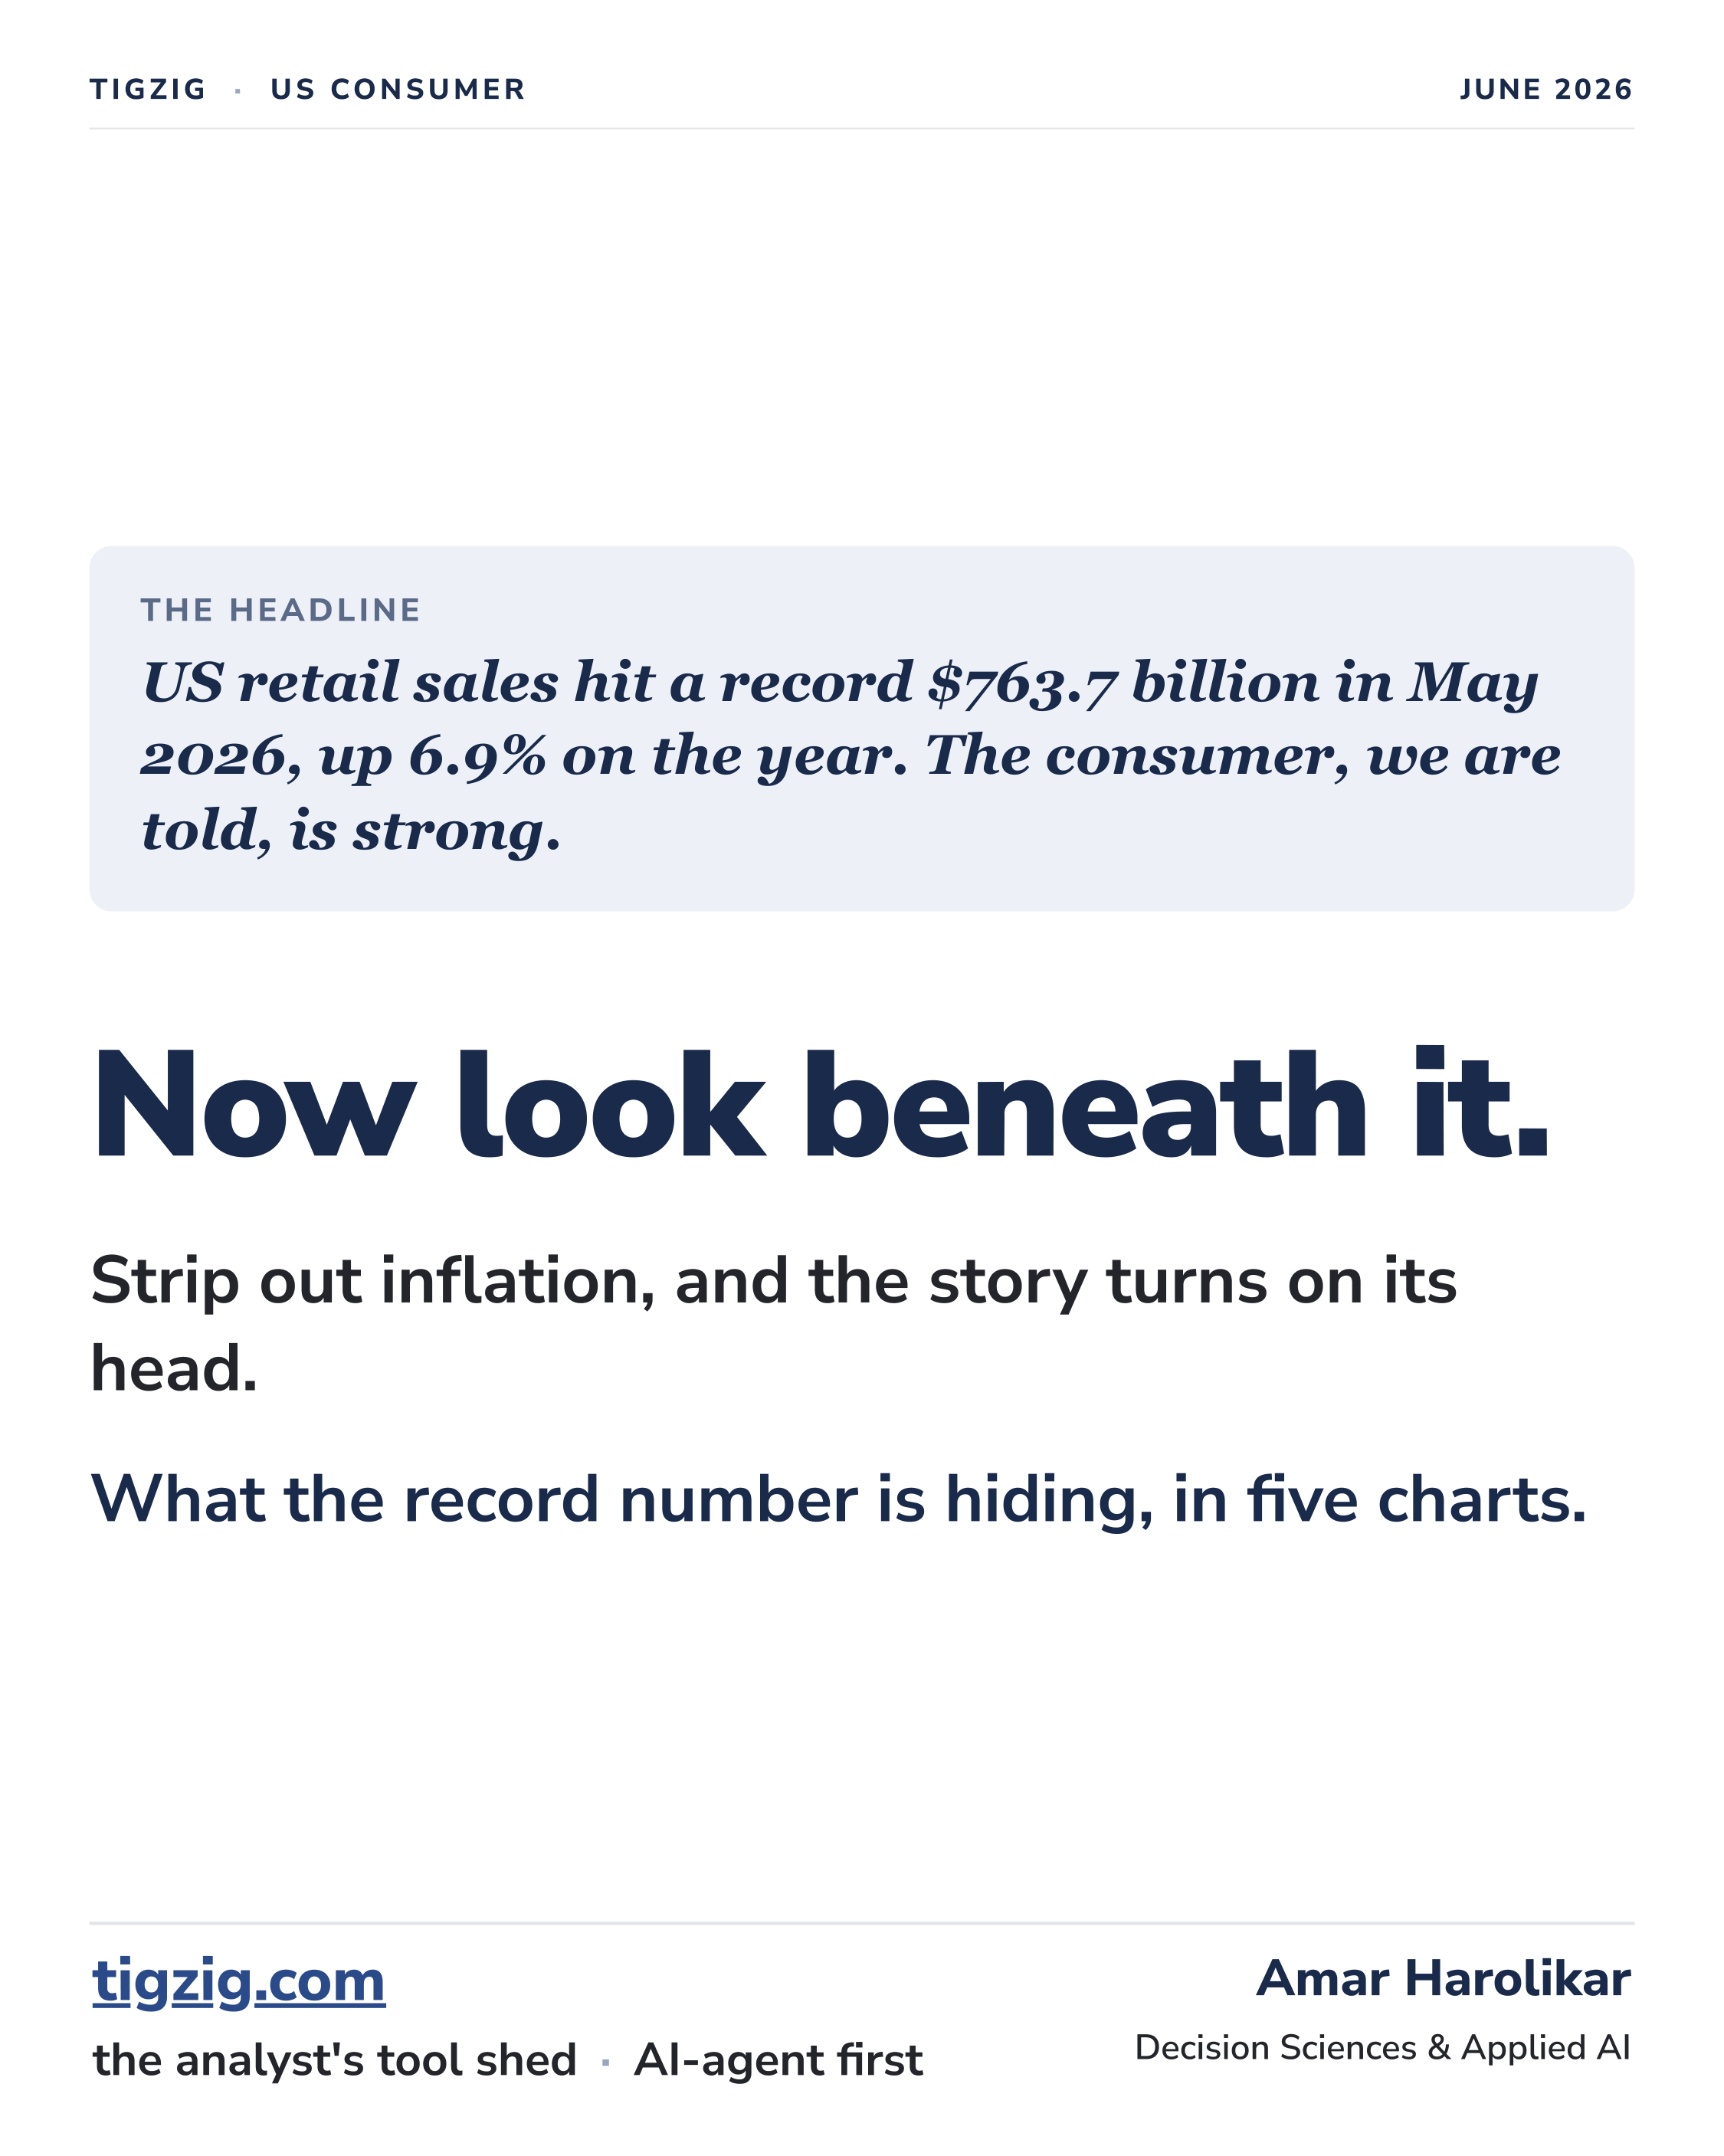
Slide 1 - Now look beneath it.
The headline US retail sales hit a record $763.7 billion in May 2026, up 6.9% on the year. The consumer, we are told, is strong.
Now look beneath it. Strip out inflation, and the story turns on its head. What the record number is hiding, in five charts.
Slide 2 - Spending more, buying the same
Adjusted for inflation, real goods spending has not grown in five years. The record is price, not volume.
Five years on, the cart has not grown. Of the $763.7bn rung up in May 2026, only $605.9bn is real 2021 goods. The other $157.8bn is pure inflation.
Chart: nominal vs real retail sales since 2021.
Slide 3 - Holding the line by stretching
Even flat real spending has to be funded. Households are doing it by saving less and borrowing against the house.
The saving rate is back to its pre-2008 lows, and home-equity borrowing has turned up 40% since 2021. The buffer is thin and the house is back in play.
Charts: personal saving rate (%) and home-equity (HELOC) balances ($ billion).
Slide 4 - The strain is starting to show
A consumer leaning on a thinning buffer eventually shows it, in how they feel and in what they cannot pay.
Sentiment has collapsed to 44.8, near the lowest on record. And 90+ day delinquencies are back to 3.4% of all consumer debt, past the 2007 mark.
Charts: consumer sentiment (University of Michigan) and 90+ day delinquency on all consumer debt (%).
Slide 5 - The consumer is squeezed, not broken.
The "record retail sales" headline is nominal. Real goods spending has not grown in five years, and per person it has fallen. And yet real GDP still grows about 2%, on services, AI investment and government.
This is a squeeze on the household goods budget, not an economy-wide downturn. The proof is the balance sheet: a thinning savings buffer, home-equity borrowing turning up, delinquencies back past 2007.
More dollars at the till, the same goods in the cart, paid for with less saving and more borrowing. A stretched consumer, holding on.
Slide 6 - Sources & method
Every series in this note is live on tigzig.com -> Tremor: retail sales (nominal & real), the personal saving rate, NY Fed home-equity balances and 90+ day delinquency, and consumer sentiment.
One place for all of it. Tremor carries 330+ macro and credit indicators in a single dashboard, so you are not hunting across a dozen sites. Pull any series by API, in Excel, or by pointing an AI agent at it.
Agent-first portal. Point Claude Cowork, Claude Code, or any AI agent at tigzig.com: it finds the series, pulls it, charts it and analyzes it for you.
"Real" retail definition
Real retail is nominal Advance Retail & Food Services Sales (Census, RSAFS) deflated by headline CPI (CPIAUCSL), published by FRED as RRSFS. Deflating by CPI, not PPI, is the honest test of volume versus price.
Sources
Retail & real retail (Census / FRED) · saving rate (BEA) · HELOC & delinquency (NY Fed Household Debt & Credit) · consumer sentiment (University of Michigan). Pulled June 2026, routed via Tremor.