India ESG (BRSR) Data Update: The Nifty Total Market List Follows NSE's Rebalance, With 699 of 750 Companies Now in the Data
Published: November 3, 2026
The Nifty Total Market list in my BRSR tool now follows NSE's September rebalance. I pulled the BRSR XBRL filings for 56 companies in the current index that were missing, so 699 of the 750 index companies now have data, 690 of them with a FY 2025-26 filing. The other 51 are not in the data yet. Some may be on BSE, which I have not pulled.
Renamed tickers
Five companies changed their NSE ticker after they filed, such as LTIM to LTM and ICICIPRULI to ICICILIFE. Every year now shows under the current ticker, and the CSV also shows the ticker the latest report was filed under.
Data quality
BRSR XBRL filings have more data quality issues than most regulatory filings I work with.
My validation combines automated checks, outlier detection and AI scans. For the Nifty 100 I also compare the filings with their PDF reports. For FY 2025-26 the tool lists 906 issues on 280 companies, and for FY 2024-25 792 on 251. The counts cover only what the tool checks for now: revenue, workforce and wages.
About two thirds of the issues are wages filed in lakhs or as monthly figures. Many others are wrong conversions, such as revenue in crores where the form asks for rupees. The rest include impossible values and numbers that differ from the PDF.
The tool has a Data Quality tab with its own charts, and every issue is listed against its company. Where an error is obvious I correct it (76 revenue values for FY 2025-26) or leave the value out of the charts (138 issues). The rest stay as filed, each flagged with a note.
Two sexual harassment counts
BRSR asks for sexual harassment complaints twice. The POSH Act count covers women only and says how many were upheld. The broad count is part of the complaints table for employees and workers, women or men, with complaints pending at the start and end of the year. So an upheld rate works only for the first, and a resolution rate only for the second.
For you - live tool
Interactive dashboards on the workforce, wages and complaints data, by year. Pick a sector such as IT or an index such as the Nifty 50, and the charts show that group alone. Compare companies side by side, say Reliance against LTM. Use the Explorer for finer cuts and take the CSV. Open any filing in the XBRL viewer with this year beside last year.
tigzig.com ➜ Vigil ➜ BRSR
For your AI agent
"Go to tigzig.com and get the India ESG (BRSR) company data and help me analyze it. Pull the methodology and data quality notes also."
Tigzig Agent Data Surface (all data - for you and your agents)
Downloads: tigzig.com/downloads
API / MCPs: tigzig.com/apis
A few quick points on the data
Machine-readable. Each BRSR filing is an XBRL file built on SEBI's taxonomy. The Explorer links each company's XBRL file and, where NSE has one, the PDF, so you can hand the raw file to your AI and go into any section, including the principles the tool does not cover yet.
Two headcounts. Section A gives the headline headcount. Several Principle 3 and 5 tables use their own, sometimes smaller, total as the base for a percentage, such as staff eligible for performance reviews.
Last year's figures. Each year view reads one filing per company, and last year is the prior-year column in that filing. Companies sometimes restate, so it can differ from last year's own filing.
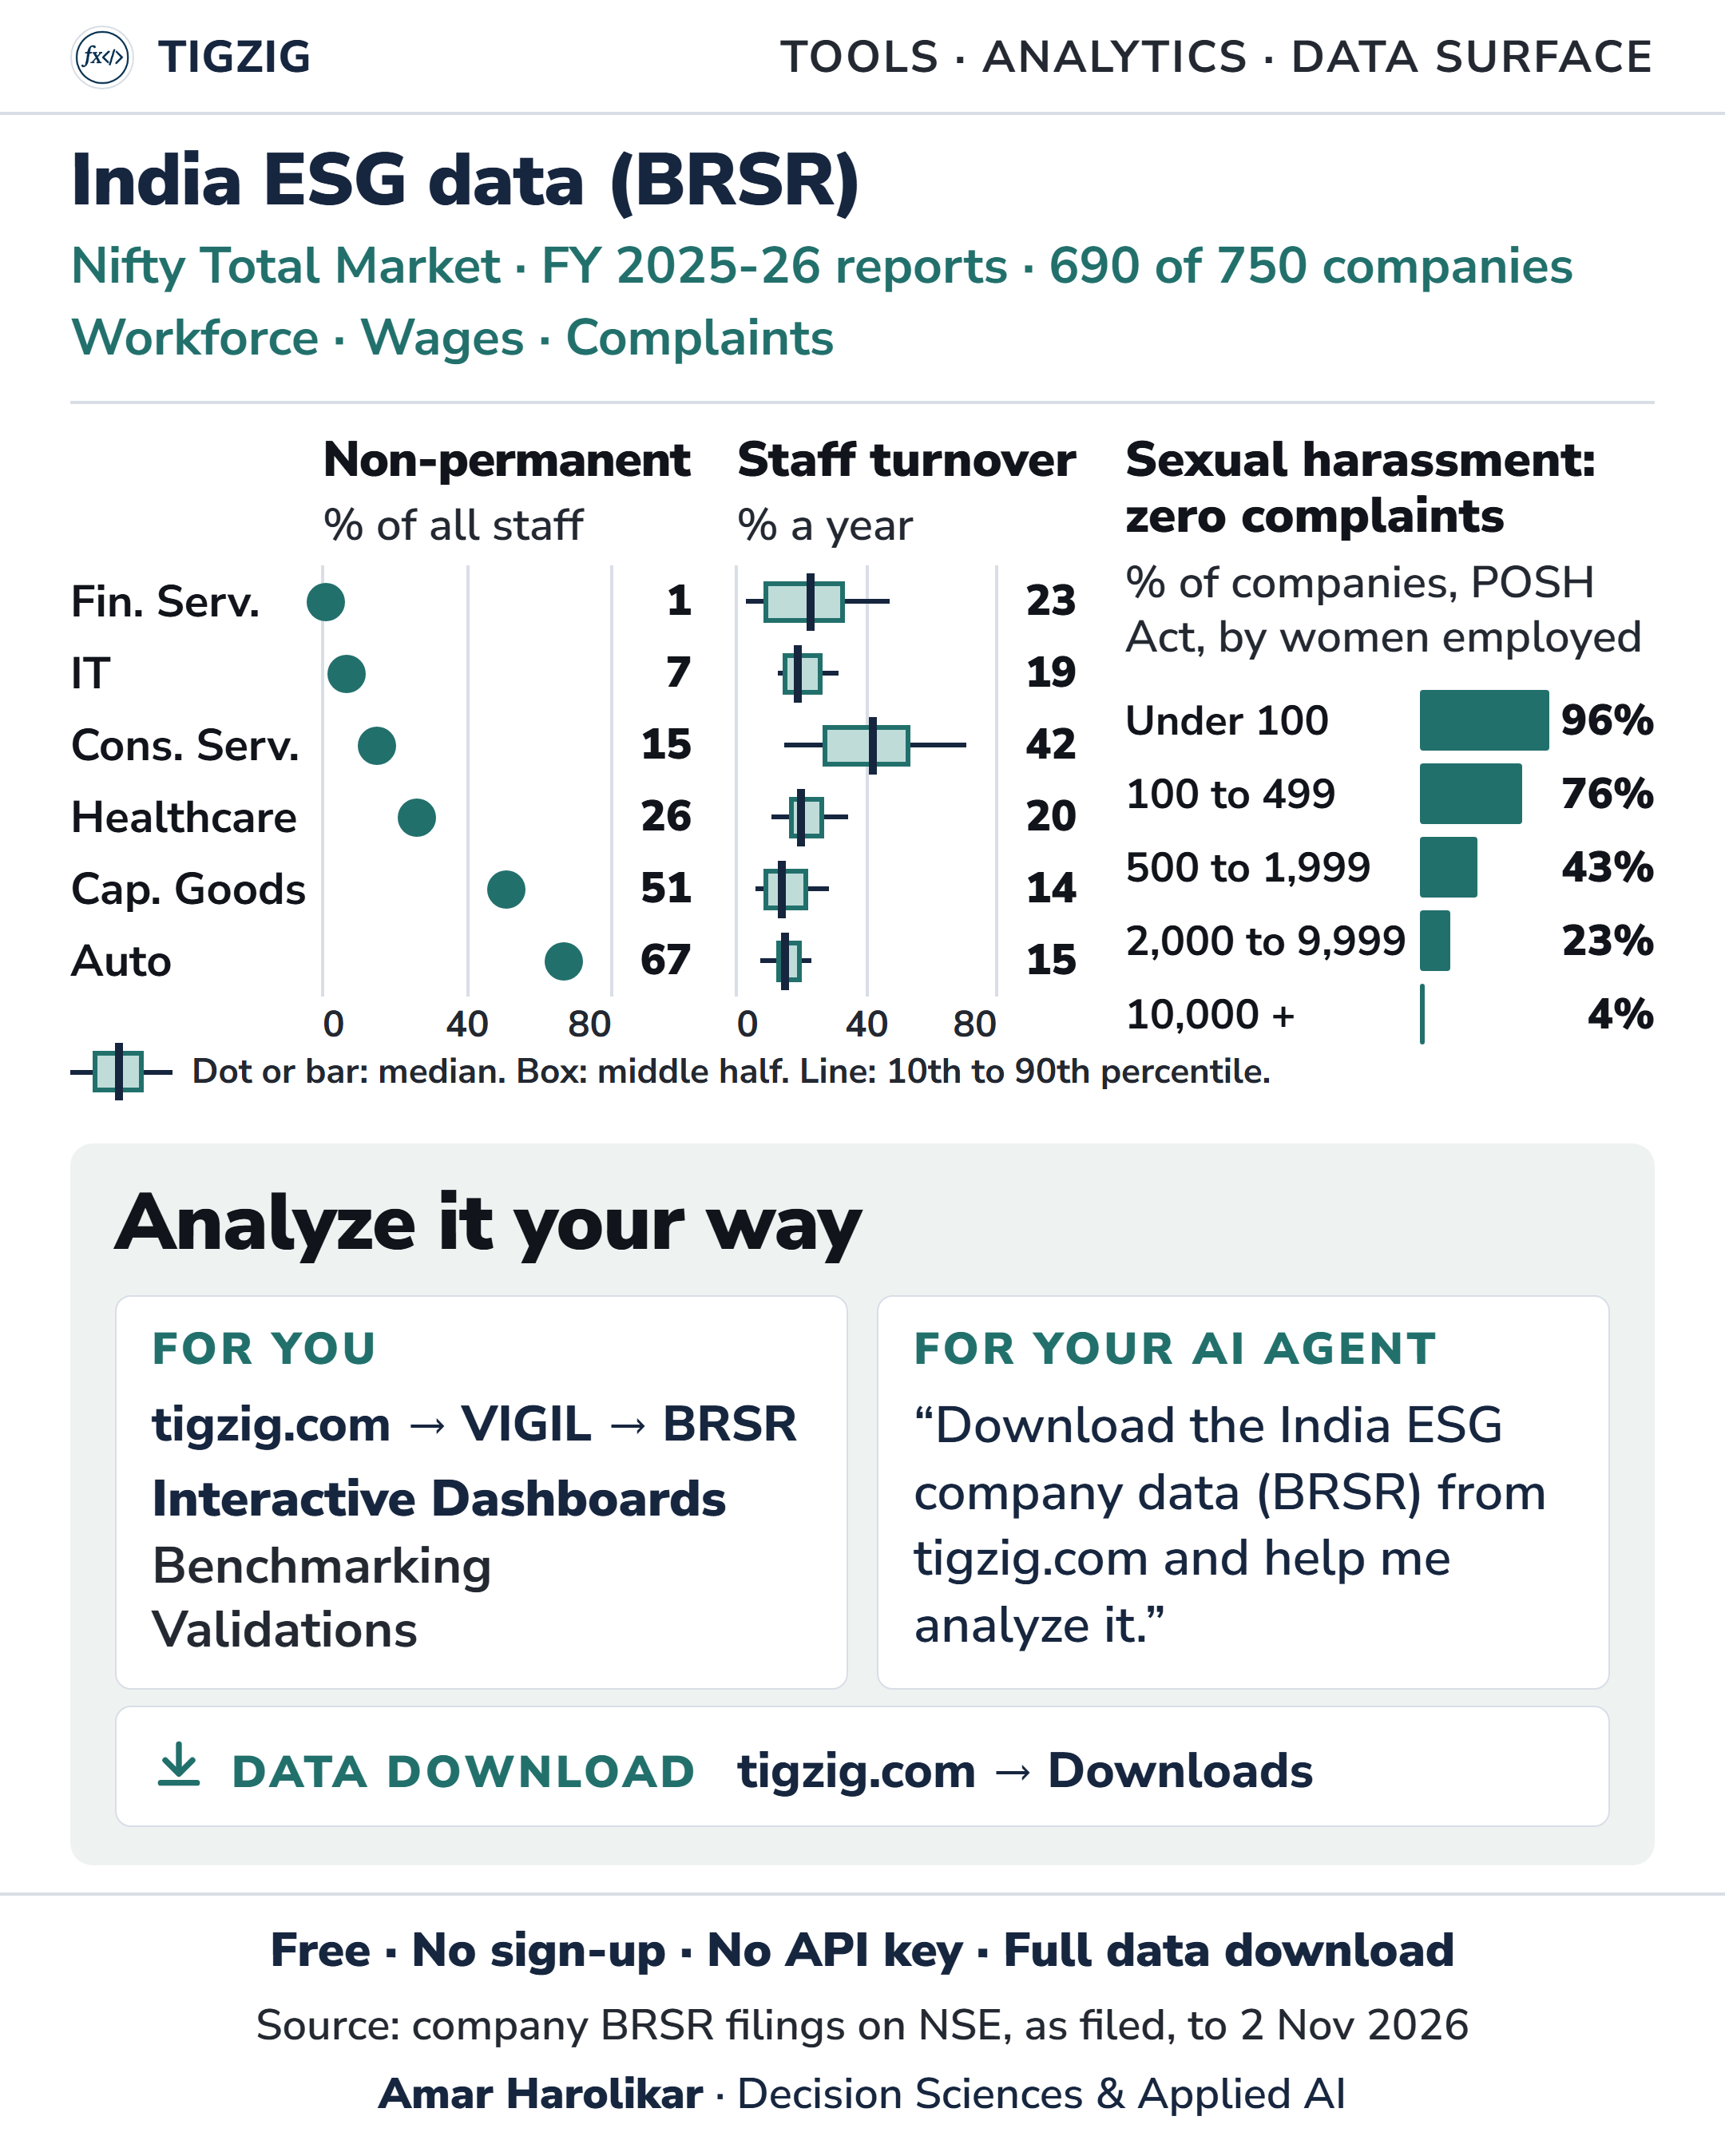
Sector charts. Six sectors, 403 of the 690 companies, each counted once. Non-permanent shows the median company. Turnover adds a box for the middle half and a line for the 10th to 90th percentile. Non-permanent is SEBI's other-than-permanent employees and workers as a share of all staff (Contract in the tool). Turnover is for permanent employees, and 2 rates filed above 100% are left out. The Explorer filters by sector for the rest.
Complaints chart. 688 of the 690, as 2 did not file the field (the tool shows those as 0).
Working on something similar? How I work covers the rates, the availability and what I take on.