Fewer Young Workers in the Jobs Most Exposed to AI: US Payroll Data via Stanford, and Yale's Counterpoint
Published: October 12, 2026
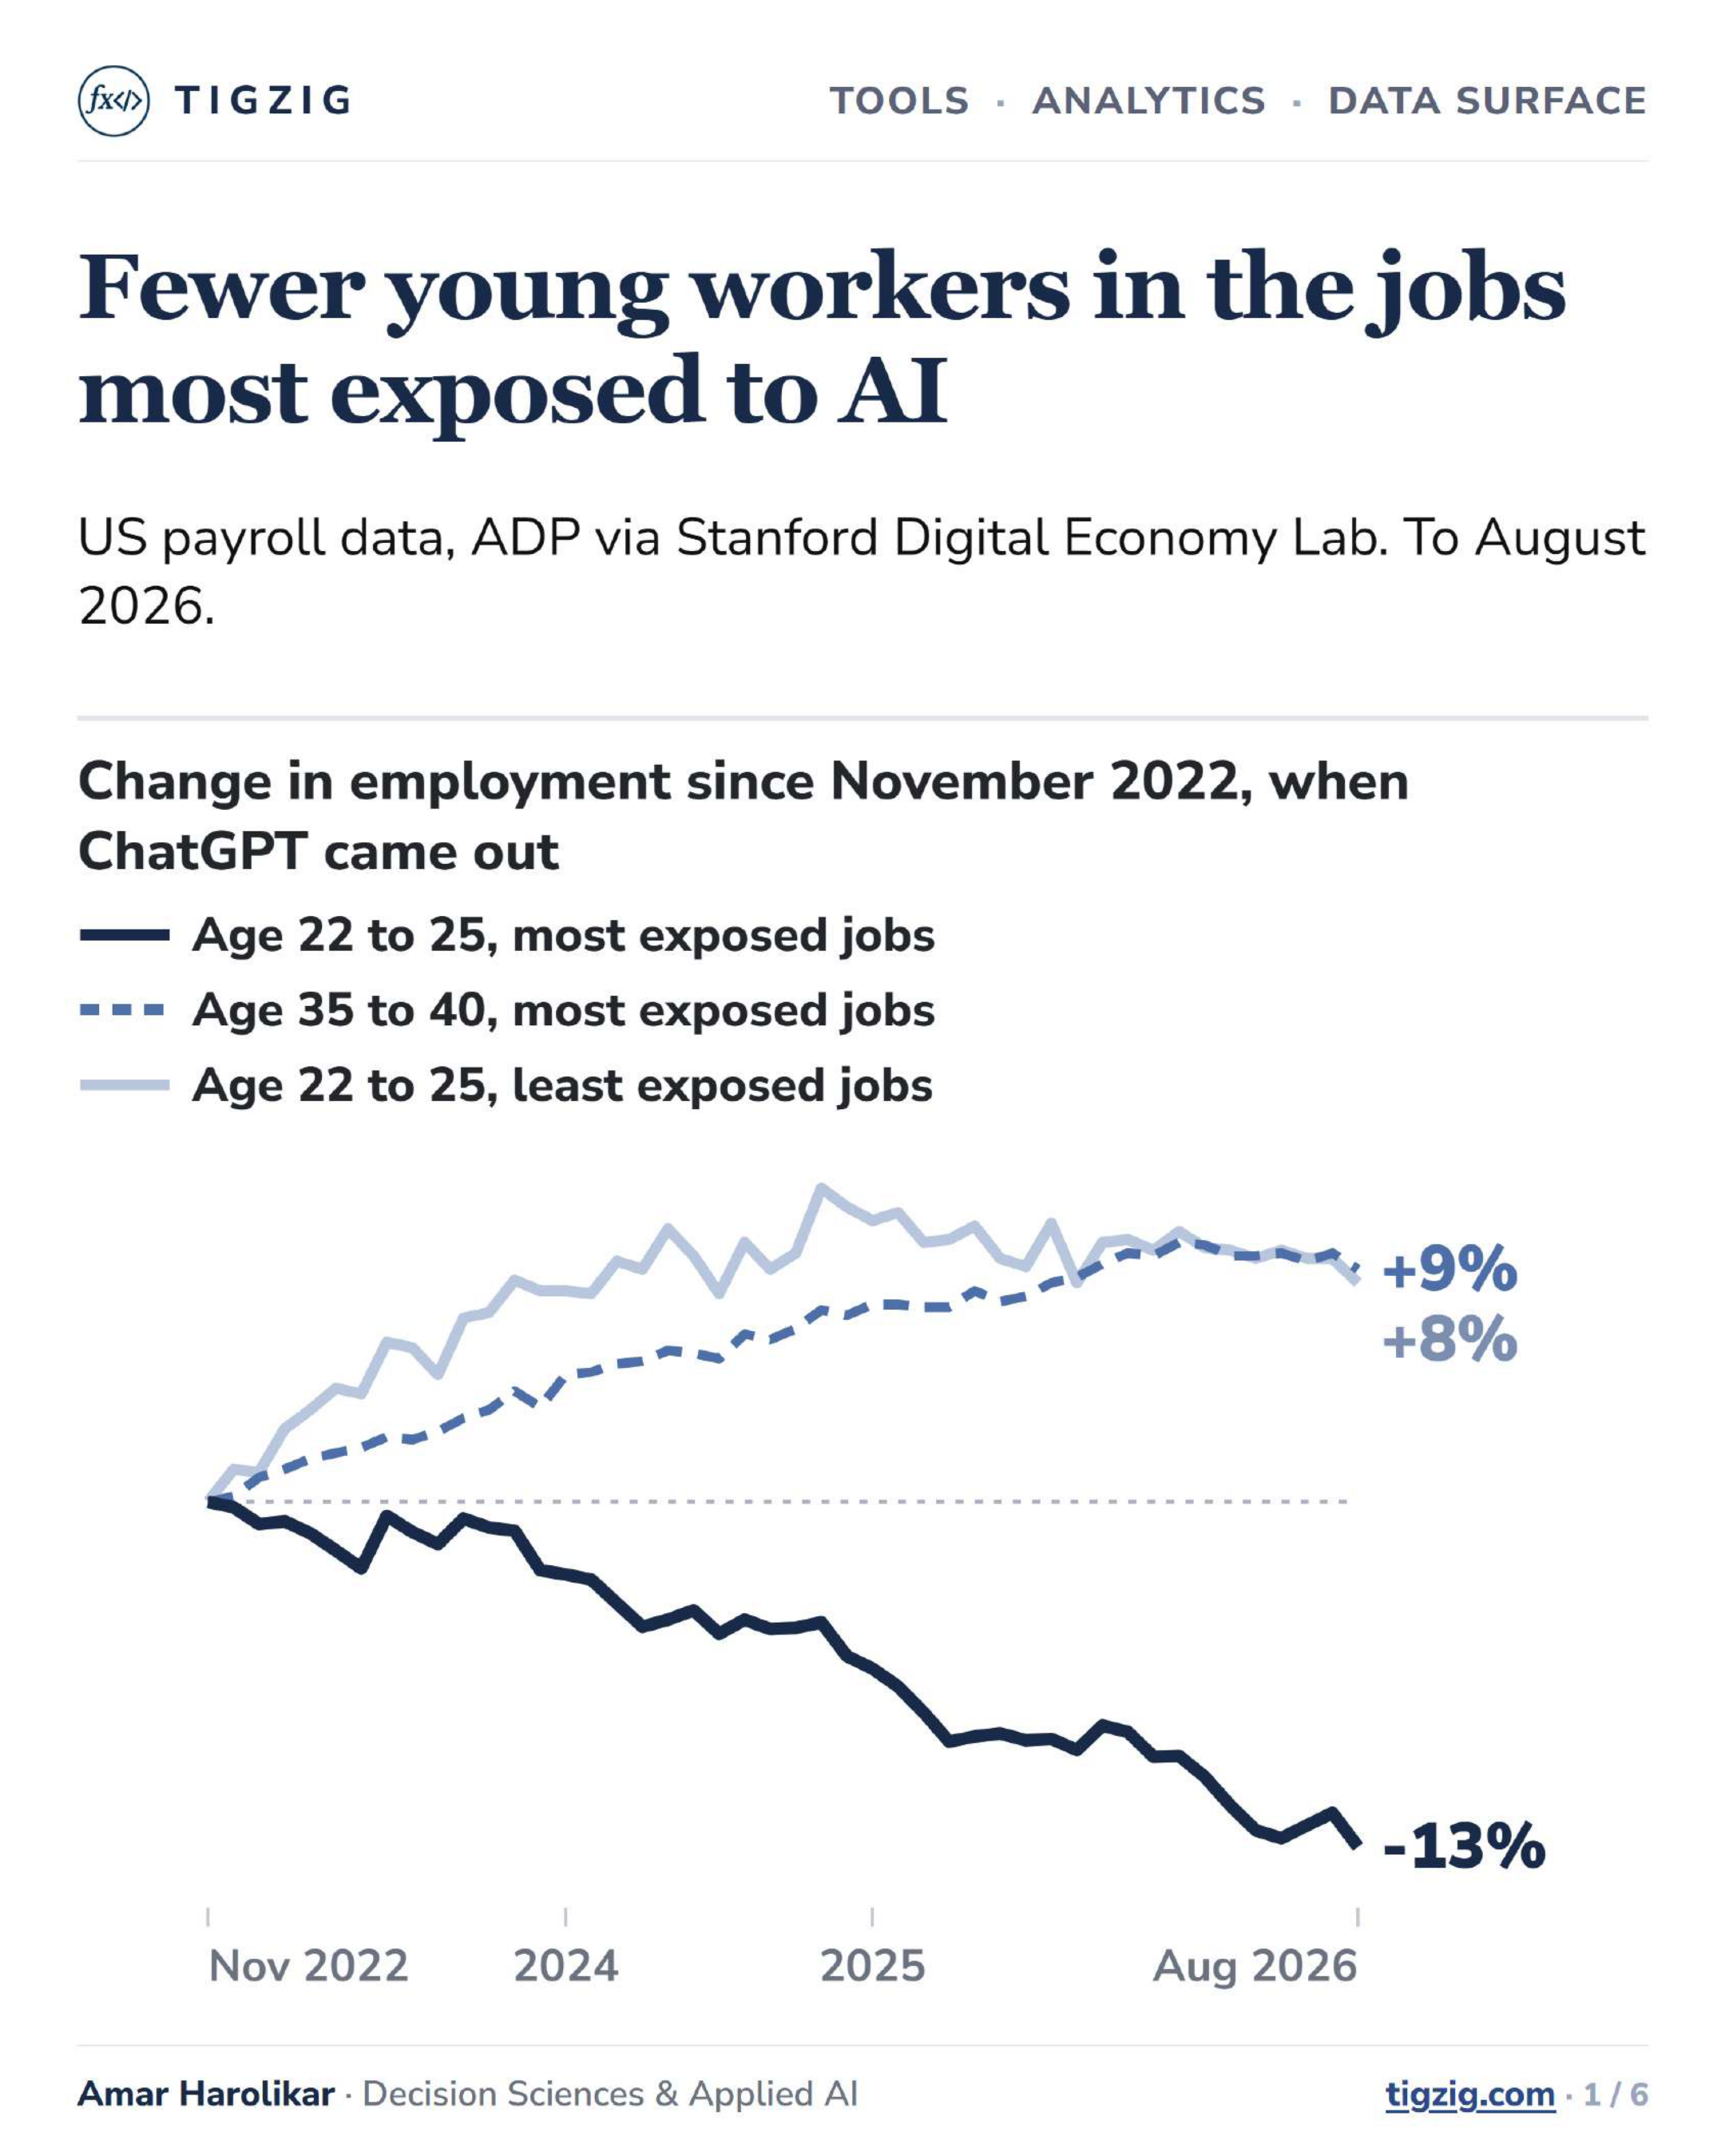
In US payroll data, employment of 22 to 25 year olds in jobs where AI most often does the task is down about 11% since November 2022, while workers aged 41 to 49 are up in every group of jobs.
This is similar to what I see with the smaller businesses I work with in India: fewer interns and freshers, fewer backfills, more work done in-house by existing teams with tools like Claude Code and Antigravity, and smaller dev teams. They tell me the productivity gain easily covers the subscription cost, even though it is paid in dollars.
The US numbers come from ADP payroll records for millions of workers, analysed by Stanford's Digital Economy Lab.
Stanford has put the data on an interactive dashboard, updated monthly, with far more cuts than the few I show here: every age group by AI exposure, single jobs, men and women, and whether AI does the task or helps the worker. You can go through the cuts and download the data yourself from Stanford's Canaries Dashboard: digitaleconomy.stanford.edu/project/indicators/canaries-dashboard
On the other side, Yale's Budget Lab report looks at the whole US labour market and finds no clear sign of AI so far. More on how Yale and Stanford differ in the deck below.
How Yale and Stanford differ
Yale's Budget Lab tracks the whole US labour market with the monthly Current Population Survey, a household survey the Census Bureau runs for the Bureau of Labor Statistics.
With data to August 2026 it reports three things: the mix of occupations is not yet changing in ways that clearly line up with AI, measures of AI use show no link to changes in employment or unemployment, and a comparison of AI-exposed and unexposed workers using a statistical method called synthetic difference-in-differences does not yet show a clear AI footprint.
Stanford's own paper also finds no economy-wide displacement. Its finding is about young workers in exposed jobs, in a fixed set of ADP client firms that has more large firms and more manufacturing than the US as a whole. The authors say the data shows a pattern and does not prove AI caused it.
Quick links
Stanford paper, Canaries in the Coal Mine?, Brynjolfsson, Chandar and Chen, revised August 2026: digitaleconomy.stanford.edu/publication/canaries-in-the-coal-mine-six-facts-about-the-recent-employment-effects-of-artificial-intelligence
Yale Budget Lab, Tracking the Impact of AI on the Labor Market, updated September 2026: budgetlab.yale.edu/research/tracking-impact-ai-labor-market
My earlier analysis of the US job market, September 2026 update: tigzig.com/post/us-jobs-september-2026-update-oct2026
Other analysis at: tigzig.com/analysis
Fewer Young Workers in the Jobs Most Exposed to AI
Browse the slides or download the PDF
Full Deck Content (Text Format)
Text below was extracted from the source deck. Chart visuals stay in the PDF and as slide images above the post.
Slide 1
TIGZIG
TOOLS · ANALYTICS · DATA SURFACE
Fewer young workers in the jobs most exposed to AI
US payroll data, ADP via Stanford Digital Economy Lab. To August 2026.
Change in employment since November 2022, when ChatGPT came out
Age 22 to 25, most exposed jobs Age 35 to 40, most exposed jobs Age 22 to 25, least exposed jobs
Nov 2022 2024 2025 Aug 2026 +9% +8% -13%
Amar Harolikar · Decision Sciences & Applied AItigzig.com · 1 / 6
Slide 2
It is the youngest
The fall is largest for the youngest workers, and smaller for those aged 26 to 30
Change in employment, Nov 2022 to Aug 2026, by age
Most exposed jobsLeast exposed jobs
22 to 25 -13% +8% 26 to 30 -4% +5% 31 to 34 +2% +6% 35 to 40 +9% +14% 41 to 49 +9% +8% 50 and over +5% +6%
Young workers in these jobs are not leaving or being let go more often, but fewer of them are being hired, according to Stanford's paper.
Stanford Digital Economy Lab, ADP payroll data, Sep 2026 release, data to Aug 2026. Most / least exposed = top / bottom fifth of jobs by AI exposure. Method and sources on the last page.
Amar Harolikar · Decision Sciences & Applied AItigzig.com · 2 / 6
Slide 3
Where it shows
Software developers and customer service: young workers down, older workers up
Change in employment, Nov 2022 to Aug 2026
Age 22 to 25Age 35 to 40
Software devs -19% +12% Customer service -18% +13% Stock clerks +7% +13% Home health aides +23% +16%
Most exposed to AI Software developers and customer service. Young workers down by about a fifth.
Little exposed to AI Stock clerks and home health aides. Young workers up too.
Stanford Digital Economy Lab, ADP payroll data, Sep 2026 release, data to Aug 2026. Method and sources on the last page.
Amar Harolikar · Decision Sciences & Applied AItigzig.com · 3 / 6
Slide 4
Does AI do the task, or help?
Young workers fall where AI most often does the task, and also where it most often helps. Workers aged 41 to 49 gain in every group.
Change in employment, Nov 2022 to Aug 2026, by age
Jobs with no recorded Claude use Jobs where AI most often does the task Jobs where AI most often helps the worker
22 to 25 +5% -11% -10% 31 to 34 +3% 0% 0% 41 to 49 +6% +9% +12%
Testing them together, Stanford ties the young-worker fall to AI doing the task, and AI helping to gains for workers over 40. The young-worker result for the helping group changes between releases of Anthropic's data.
Stanford Digital Economy Lab, ADP payroll data, Sep 2026 release, data to Aug 2026. Most often does the task / helps = top fifth of jobs by the share of their Claude use of that kind. Method and sources on the last page.
Amar Harolikar · Decision Sciences & Applied AItigzig.com · 4 / 6
Slide 5
Read with care
What the data can and cannot show
It shows a pattern. The authors say it does not prove AI caused the fall.
It is not the whole US. The sample has more manufacturing, wholesale and large firms, and less retail and food service. Few firms under 10 staff.
It follows the same firms for five years, so only firms that survived are counted. Stanford finds this sample grows faster than the US as a whole. Young workers who moved to firms outside the sample are not counted, so some of the fall may be people moving rather than losing work.
In Census survey data for 2022 to 2024, the gap between young workers in the most and least exposed jobs is about a sixth of the ADP gap and not clearly different from zero. Stanford notes Census weighting changes may explain part of this. The two agree mainly for professional, finance and information jobs. The gap also shrinks once the share of graduates is allowed for, and some of it began before ChatGPT.
Across the whole US labour market, Yale's Budget Lab finds no clear sign of AI so far
Yale uses the monthly Current Population Survey, a household survey, with data to August 2026. It finds the mix of occupations is not yet changing in ways that line up with AI, measures of AI use show no link to changes in employment or unemployment, and a statistical comparison of AI-exposed and unexposed workers does not yet show a clear AI footprint.
Amar Harolikar · Decision Sciences & Applied AItigzig.com · 5 / 6
Slide 6
Notes and sources
This piece shows a few cuts. The interactive dashboard has far more: every age group by AI exposure, four single jobs, men and women, AI doing the task or helping, with the data to download. Updated monthly; each release revises past months.
Does AI do the task, or help?
Jobs are ranked by the share of their Claude use where AI does the task, or helps the person, from the Anthropic Economic Index. Examples: accountants (does the task), chief executives (helps). For young workers, the result for the helping group changes between releases of Anthropic's data.
Sources
Stanford Canaries dashboard, Sep 2026 release, data to Aug 2026. All charts in this piece. Canaries in the Coal Mine? Brynjolfsson, Chandar and Chen, revised 12 Aug 2026 (PDF). AI exposure of jobs: Eloundou and others (2024). Claude use: Anthropic Economic Index (Handa and others, 2025, and later releases). Tracking the Impact of AI on the Labor Market. Yale Budget Lab, updated 15 Sep 2026.
Amar Harolikar · Decision Sciences & Applied AItigzig.com · 6 / 6
Working on something similar? How I work covers the rates, the availability and what I take on.