Is Copper Another Bubble After Silver and Gold? ING: The Move Towards $15,000 a Tonne "Had Run Ahead of Current Fundamentals"
Published: November 9, 2026
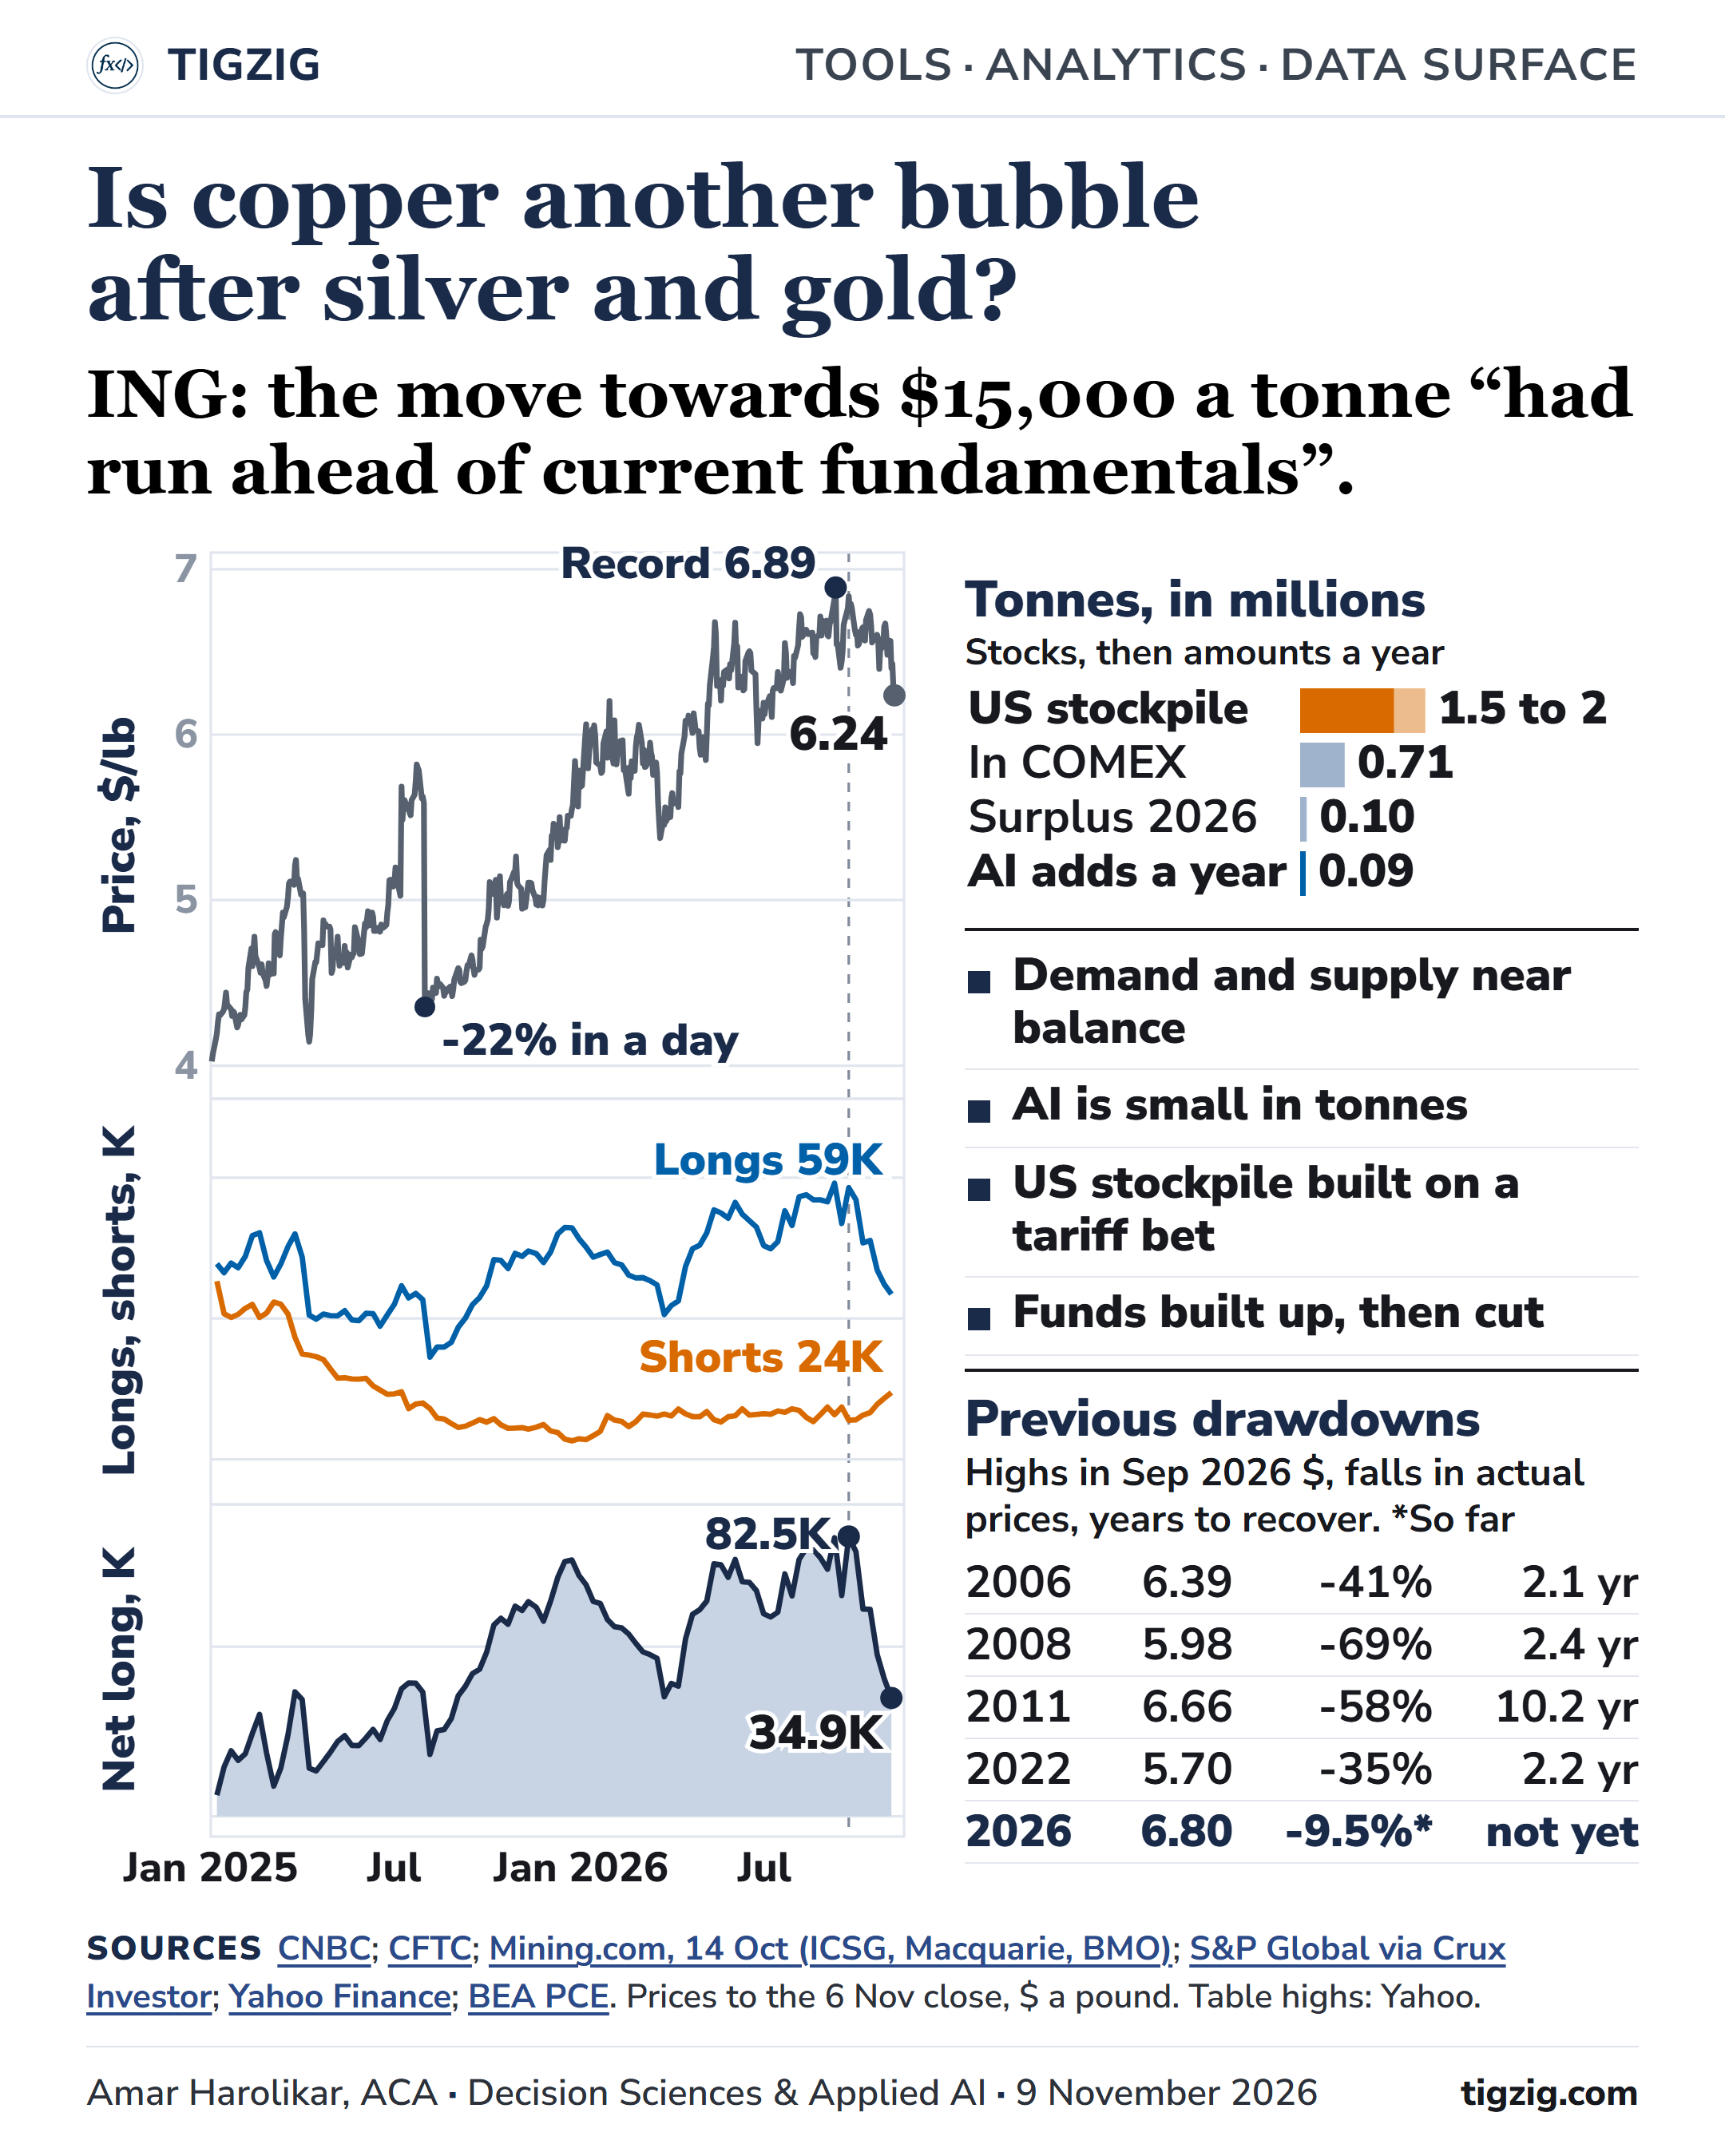
Copper's price looks disconnected from the fundamentals and may be another bubble, after silver's 55% fall and gold's 25% fall. A US stockpile built on a tariff bet, and mine outages, are behind part of the rise. The basic balance of supply and demand does not explain the rest.
Near balance in tonnes
ICSG sees a 2026 surplus of 104,000 tonnes and 368,000 in 2027. Macquarie sees surpluses averaging over 700,000 a year to 2030, and says prices "have disconnected from the fundamentals". BMO and BMI see deficits from 2027. ING wrote on 10 Sep that the move towards $15,000 a tonne "had run ahead of current fundamentals".
AI is small in tonnes.
S&P Global puts data-centre use at 1.1 million tonnes in 2025, which I calculate as 4% of world demand. On S&P's path it grows by about 0.09 million tonnes a year, against about 0.9 million for all demand.
The stockpile is the larger number.
Traders pulled metal into US warehouses ahead of a possible duty on refined copper. BMO puts the hoard near 2 million tonnes, about a year of US use. The World Bank says the rally partly reflects mining disruptions, and that the US inflow tightened supply elsewhere and lifted London. BMO reads it differently: $14,500 to $15,000 a tonne is "fundamentally supported", because the metal moved from hidden to visible stocks. Macquarie rates a decision against the duty least likely, but says it would most likely collapse the CME price and take LME with it. The duty could start on 1 Jan 2027 at the earliest.
The tariff markup is almost gone.
COMEX is the US price and LME is London's. COMEX traded $2,964 a tonne above LME on 25 Jul 2025, 30% higher. On 6 Nov the two were about level. Since January 2025 COMEX is up 55% and LME is up 56%, so the rise is in the global price. Of the $1,435 fall from the 9 Sep record, $1,024 is London and $411 is the US premium, about 70/30.
Funds built up, then cut.
From the end of 2024 to the 22 Sep peak, funds' net long rose by about 87,000 contracts, about 1 million tonnes of exposure, mostly from shorts closing. At the 22 Sep peak that net long was higher than in 96% of the weeks since 2010. Since then it has fallen 58% to 35,000 contracts, the 2025 average.
Against past peaks.
In today's dollars the record is within 3% of the 2011 peak and within 7% of 2006, on either price index. It is above 2008. The 2006 peak fell 41% and was regained only on the day of the 2008 peak. That peak fell 69% and took 2.4 years to recover. The 2011 peak fell 58% and took 10.2 years. Falls and recovery times use actual prices.
My earlier analysis of the potential bubbles in silver, gold and AI valuations:
▸ Silver, 6 Nov
tigzig.com/post/silver-56-percent-below-peak-hedge-funds-etfs-nov2026
▸ Gold held $4,000 three times, 30 Oct
tigzig.com/post/gold-4000-third-test-oct2026
▸ A bust likely before AI pays off, 1 Nov
tigzig.com/post/ai-selloff-red-flags-piling-up-nov2026
Sources and links
Mining.com, 14 Oct: ICSG, Macquarie, BMO, stocks
mining.com/copper-price-forecasts-lifted-for-2026-but-tariff-collapse-still-on-the-table
ING Think, 10 Sep: prices ahead of fundamentals
think.ing.com/articles/tariff-uncertainty-tests-coppers-record-rally
World Bank Commodity Markets Outlook, Oct 2026
S&P Global via Crux Investor: data-centre copper
cruxinvestor.com/posts/127-data-center-copper-demand-growth-by-2040-raises-need-for-new-mines
Bloomberg Linea, 4 Nov: spread after the midterms
CFTC positions
cftc.gov/MarketReports/CommitmentsofTraders/index.htm
The other side
▸ Copper is cheap against gold: 652 pounds of copper per ounce of gold, against a median of 477 since 2011.
▸ Outside the US, visible stocks are down 168,000 tonnes this year (Mining.com, 14 Oct).
▸ BMO calls $14,500 to $15,000 a tonne fundamentally supported. Copper closed at $13,751.
▸ Fund net long is back at its 2025 average, the 74th percentile since 2010.
Data notes
▸ Prices are 6 Nov closes. COMEX is the most-active contract, LME the three-month contract. Close times differ, so a day can be off by $100.
▸ COMEX minus LME: +$2,964 on 25 Jul 2025, +$405 at the 9 Sep record, -$7 on 6 Nov.
▸ Refined copper was exempted late on 30 Jul 2025. COMEX fell 22% next day, LME 1.1%.
▸ Funds are CFTC managed money in COMEX copper. The 87,000 contracts run from -4,319 on 31 Dec 2024 to 82,522.
▸ On PCE the record is 2% above 2011 and 6% above 2006. On CPI it is 3% below 2011 and level with 2006.
▸ The 4%, 0.09 and 0.9 million tonnes are my arithmetic from S&P's figures. The US stockpile is an estimate.
Analysis of public sources, for information only. Not investment advice.
Working on something similar? How I work covers the rates, the availability and what I take on.