Could This Time Be Different? Past Drawdowns, AI Valuations and Cracks Across Markets and the Economy
Published: October 24, 2026
Could this time be different? Could be, depends on your read. To me, it's like the dot-com bust and 2008 happening at the same time: a revolutionary technology in a potential valuation bubble + global macros showing cracks.
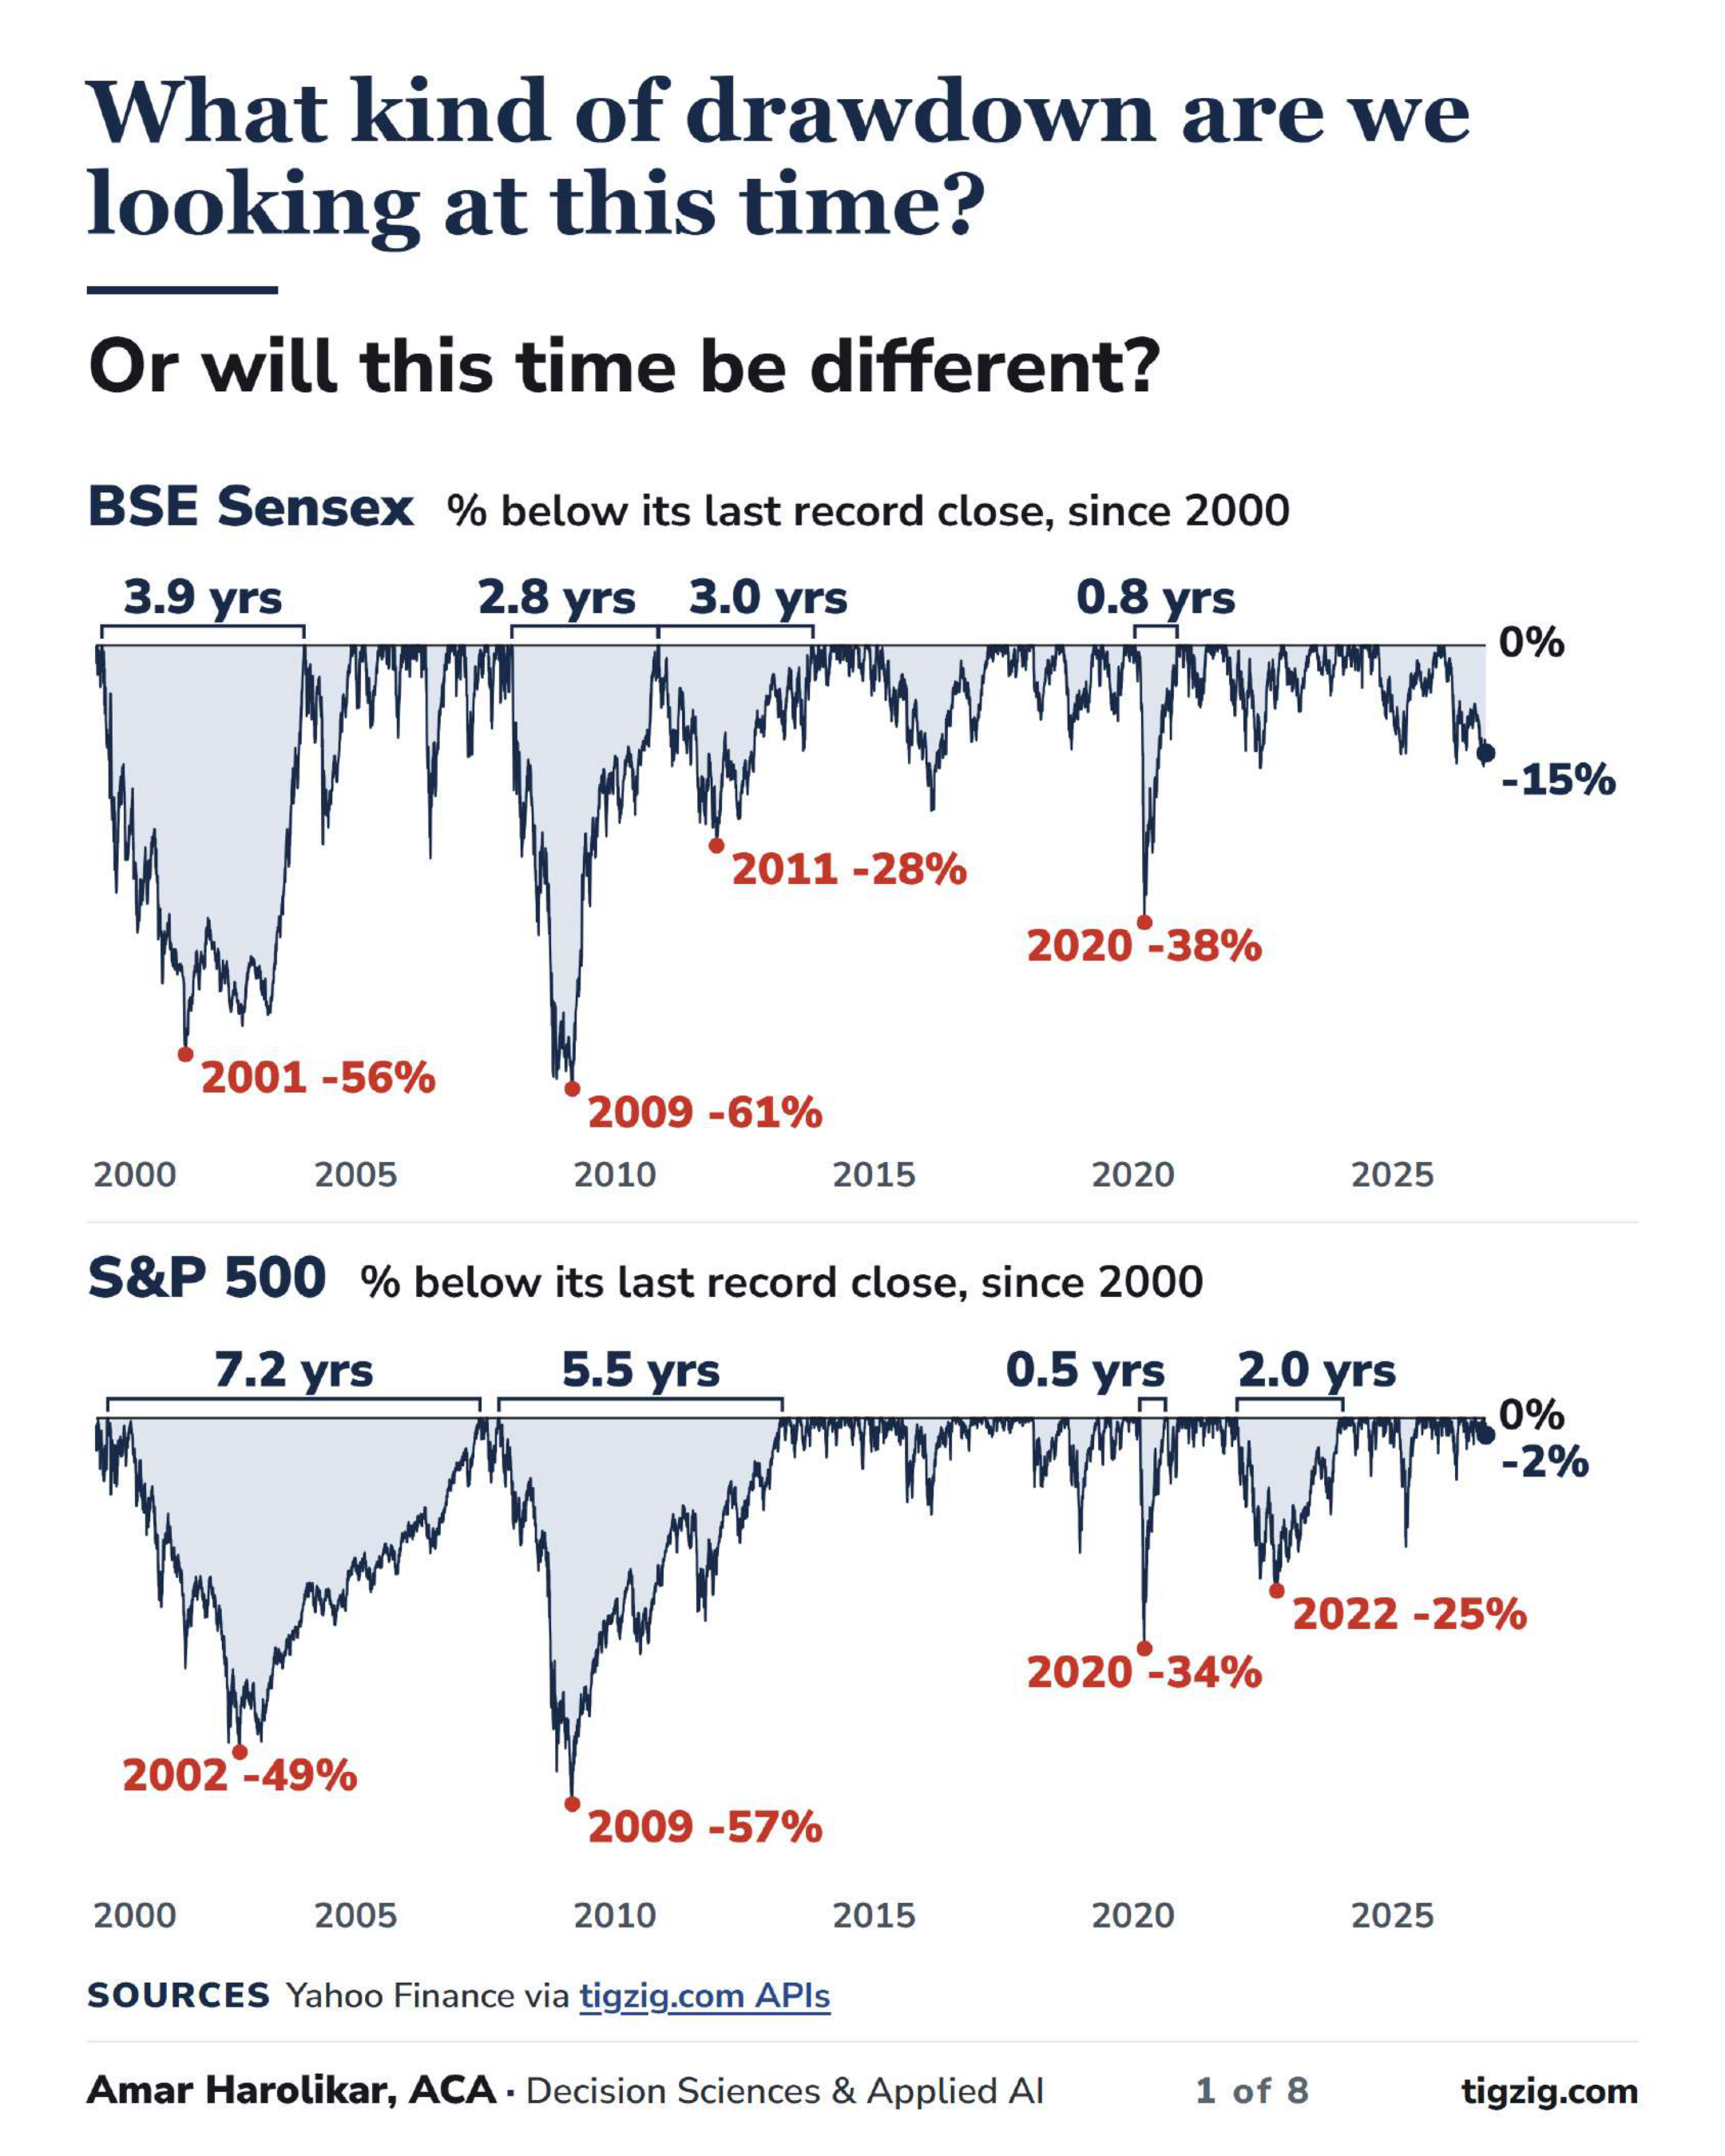
The Nifty 50 and the Sensex are about 15% below their January highs. Since 2000, the big falls in the Sensex and the S&P 500 took anywhere from five months to seven years to recover.
The stress shows across asset classes and the economy: stock markets, oil, gold, US jobs, consumers and housing. Warnings on AI debt and valuations have come all year from rating agencies, regulators, banks and research houses. In October they became a crescendo.
The other side: the warners are not calling it a crisis yet, and the companies building AI see the returns still to come. The deck has the details.
More analysis at tigzig.com/analysis
My earlier analysis behind this one
A crescendo of warnings on AI debt and returns, Oct: tigzig.com/post/ai-warnings-crescendo-oct2026
US housing is showing cracks, Oct: tigzig.com/post/us-housing-freeze-oct2026
Foreign portfolio money is leaving Indian stocks, Oct: tigzig.com/post/fpi-foreign-money-leaving-india-oct2026
US jobs, September 2026: fewer new jobs, longer searches and pay trailing prices, Oct: tigzig.com/post/us-jobs-september-2026-update-oct2026
Bond markets have started acting, Sep: tigzig.com/post/bond-market-rout-sep2026
A correction in AI valuations is looking more likely, Aug: tigzig.com/post/ai-valuation-correction-aug2026
Notes on the data
Drawdowns use daily closes to 23 Oct, price index without dividends. A fall is measured from a record close to the next close above it. With dividends the recoveries would be shorter.
Page 1 uses the Sensex because Yahoo's Nifty 50 history starts in 2007. The Sensex has not closed at a record since Sep 2024, though it came within 0.09% on 2 Jan 2026, when the Nifty set a new one.
Brent is the front-month futures price, the ICE settlement of $116.72 on 23 Oct. Physical Brent (spot) has been higher: $115 on 20 Oct and $138 at its April peak.
Treasury's own reading of the US 10-year for 23 Oct is 5.00%, up from 4.96% the day before.
The diesel record is in dollars of the day. Adjusted for inflation, the 2008 and 2022 peaks were higher.
Pending home sales are NAR's index, and September is preliminary. The mortgage chart is the NY Fed's share of balances newly 90+ days late, annualised, Q2.
Default swap levels are as reported by CNBC and Reuters. Data vendors differ slightly.
This is my analysis of public sources, for information only. Not investment advice.
What kind of drawdown are we looking at this time?
Browse the slides or download the PDF
Full Deck Content (Text Format)
Text below was extracted from the source deck. Chart visuals stay in the PDF and as slide images above the post.
Slide 1
What kind of drawdown are we looking at this time?
Or will this time be different?
BSE Sensex % below its last record close, since 2000 0% 2000 2005 2010 2015 2020 2025 2001 -56% 2009 -61% 2011 -28% 2020 -38% 3.9 yrs 2.8 yrs 3.0 yrs 0.8 yrs -15%
S&P 500 % below its last record close, since 2000 0% 2000 2005 2010 2015 2020 2025 2002 -49% 2009 -57% 2020 -34% 2022 -25% 7.2 yrs 5.5 yrs 0.5 yrs 2.0 yrs -2%
SourcesYahoo Finance via tigzig.com APIs
Amar Harolikar, ACA · Decision Sciences & Applied AI1 of 8tigzig.com
Slide 2
Eight of nine big indices are 6% to 39% below their 2026 highs. The S&P 500 is 2% off
Six of the nine are still up for the year.
Index level, end-2025 to the latest close, 23 Oct 2026. Red dot: the 2026 high. Navy dot: latest close.
S&P 500 +11% YTD, 2% below high Jan Apr Jul Oct 7,819 7,624 Nasdaq +12% YTD, 6% below high Jan Apr Jul Oct 27,600 25,955 Russell 2000 +12% YTD, 10% below high Jan Apr Jul Oct 3,068 2,776 Taiwan +59% YTD, 8% below high Jan Apr Jul Oct 49,823 46,041 Kospi, Korea +32% YTD, 39% below high Jan Apr Jul Oct 9,115 5,550 Nikkei, Japan +25% YTD, 13% below high Jan Apr Jul Oct 72,366 62,693 Hang Seng -10% YTD, 17% below high Jan Apr Jul Oct 27,968 23,093 Shanghai -7% YTD, 13% below high Jan Apr Jul Oct 4,243 3,690 Nifty 50, India -14% YTD, 14% below high Jan Apr Jul Oct 26,329 22,600
SourcesYahoo Finance via tigzig.com APIs. Taiwan to 22 Oct (no 23 Oct close from TWSE)
Amar Harolikar · Decision Sciences & Applied AI2 of 8tigzig.com
Slide 3
Europe slips. Oil, gasoline and diesel surge, hitting consumers and producers
Investors turned to Treasuries: the US 10-year eased to 5%, from 5.31%. Gold is down. France shows sovereign debt stress.
DAX, Germany +3% YTD, 5% below high Jan Apr Jul Oct 26,570 25,182 CAC 40, France -4% YTD, 11% below high Jan Apr Jul Oct 8,726 7,783 France 10-year yield Over Germany 168bp, from 70 Jan Apr Jul Oct 5.09% 5.02% FTSE 100, UK +8% YTD, 2% below high Jan Apr Jul Oct 10,911 10,690 US 10-year yield Down from 5.31% on 5 Oct Jan Apr Jul Oct 5.31% 4.99% Gold -8% YTD, 25% below high Jan Apr Jul Oct $5,318 $4,010 Brent crude Up on Iran’s Hormuz attacks Jan Apr Jul Oct $118 $117 US gasoline, pump +52% YTD, 5% below high Jan Apr Jul Oct $4.50 $4.28 US diesel, pump Record $6.53 on 21 Sep* Jan Apr Jul Oct $6.53 $6.28
SourcesYahoo Finance via tigzig.com APIs, EIA via Tremor, CNBC 22 Oct, 16 Oct, bond quotes. Treasury 10-yr 23 Oct 5.00%. *Not inflation-adjusted
Amar Harolikar · Decision Sciences & Applied AI3 of 8tigzig.com
Slide 4
Longer job searches, pay behind prices, less saving, pending home sales at a record low
New homes now sell for less than existing ones. More mortgages are falling 90 days behind.
Unemployment rate 4.2%, peak 4.5% Nov 2025 2024 2025 2026 4.2% Time out of work Median 11.5 weeks in Sep 2024 2025 2026 11.5 Pay minus prices Behind prices since April 2023 2024 2025 2026 -0.7 Saving rate 4.1%, lowest since 2022 2024 2025 2026 4.1% Pending home sales 66.0, record low (prelim.) 2023 2025 66.0 New minus existing home price, $K 2026: Jan to Aug 2017 2021 2025 -14 New homes for sale 483K in Aug, near 2008 2016 2020 2024 483K 30-year mortgage rate 7.32% on 22 Oct 2016 2020 2024 7.32% Mortgages 90+ late New in Q2: 1.52%, most since 2015 2016 2020 2024 1.52%
SourcesBLS, BEA, Freddie Mac, NY Fed via tigzig.com Tremor; NAR, Census
Amar Harolikar · Decision Sciences & Applied AI4 of 8tigzig.com
Slide 5
This month’s warnings: AI revenue may fall short, power may run out, and some debt is out of sight
S&P Global Ratings Mark Habib, 19 Oct “It is safe to assume that there is more (debt) out there that we are not seeing.”
Gartner Will Sommer, 14 Oct AI revenue “will be insufficient to support profitable returns on all planned AI capital expenditures”
Morgan Stanley equity research, via ET 17 Oct “…there are more semiconductors being built than there are places to put them”
IMF Kristalina Georgieva, 13 Oct “We now have an economy that is standing on one leg, the AI leg.”
World Bank East Asia update, 6 Oct Private credit markets have “not been tested by a severe downturn”
AI revenue to 2030 Needed for a 12% return vs Gartner’s ceiling $8.5T Needed $3.6T at most Forecast US data centre power shortfall Morgan Stanley estimate, gigawatts 32 GW To 2028 Up to 68 GW By 2029
SourcesReuters, Gartner, ET, Reuters, CNBC, my 23 Oct analysis
Amar Harolikar · Decision Sciences & Applied AI5 of 8tigzig.com
Slide 6
Insuring Oracle’s debt costs 2.5 times what it did last December. CoreWeave is past the distress line
Oracle, Nvidia and Meta default swaps hit records this week. S&P rates Oracle BBB-, one step above junk.
Oracle default insurance 5-year credit default swap, basis points
- 139 Dec 2025 141 2 Jan 282 15 Oct 308 21 Oct 343 Week to 23 Oct Default insurance this week 5-year swap, bp. Records for Oracle, Nvidia, Meta 1,000: distress 1,100+ Core- Weave 343 Oracle 126 Nvidia 124+ Meta
Oracle: S&P cut it to BBB- in July, the lowest investment grade, on the cost of its AI build, and CNBC says it now faces downgrade risk. Its stock has lost over a third this year.
CoreWeave: rated B+, junk, by S&P. Its 2031 and 2032 notes yield over 15%. CoreWeave, Nebius and IREN shares are down over 30% in October.
Meta: free cash flow turned negative in the third quarter, by over $2 billion.
SourcesCNBC 23 Oct, 22 Oct, 15 Oct, 14 Oct, Reuters Dec 2025, Business Insider Jul
Amar Harolikar · Decision Sciences & Applied AI6 of 8tigzig.com
Slide 7
The other side: the builders see demand, and the warners see no crisis yet
Nvidia Jensen Huang, CEO; Nvidia backs CoreWeave “demand for the neoclouds is off the charts.” “The demand of the capital is much greater than the availability of the capital… That’s going to get solved.”
S&P Global Ratings Mark Habib, 19 Oct “For now, we don’t have the view that there is a major disconnect that needs to force our ratings to change at this point.”
Gartner 14 Oct Hyperscalers “have massive and highly diversified revenue sources that could plausibly sustain AI investments for years.”
Morgan Stanley 17 Oct Expects Nvidia and Broadcom to meet their 2027 forecasts.
IMF 13 Oct Its scenario: a steep AI pullback cuts world output 1.1% by 2028. Petya Koeva Brooks: not likely to mean a global recession.
World Bank 6 Oct, as CNBC reports it A correction may not mean a bust for the AI supercycle, though investment “had run ahead of realized demand.”
Janus Henderson CoreWeave bondholder, 20 Oct The sell-off is “a little bit of overreacting.”
BlackRock Larry Fink, arguing against data centre bans, 14 Oct “Data centers are not the problem.” He also warned a ban could bring a recession.
SourcesCNBC 23 Oct, Reuters, Gartner, ET, Reuters, CNBC, CNBC, CNBC
Amar Harolikar · Decision Sciences & Applied AI7 of 8tigzig.com
Slide 8
My earlier analysis
More at tigzig.com ➜ Analysis
23 OctA crescendo of warnings on AI debt and returns S&P Global, Gartner, Morgan Stanley, the IMF and the World Bank, all in one month.
22 OctUS housing, October 2026 Mortgage rates above 2007-08, pending sales at a record low and more mortgages turning late.
19 OctForeign portfolio money is leaving Indian stocks US$58.6 billion out since October 2024.
4 OctUS jobs, September 2026 Fewer new jobs, longer searches, hourly pay trailing prices since April.
25 SepBond markets have started acting The US 10-year closed above 5% for the first time since 2007.
31 AugA correction in AI valuations is looking more likely That view now comes from a central bank, an asset manager and a bond investor.
Not investment advice. This is my analysis of public sources, for information only. Care has been taken, but errors are possible. Use of AI. Parts of this work were prepared with AI under my direction. I reviewed, edited and approved every page. The analysis and conclusions are mine.
Amar Harolikar · Decision Sciences & Applied AI8 of 8tigzig.com
Working on something similar? How I work covers the rates, the availability and what I take on.