India Bank Credit, September 2026: Two Things in RBI's Data That Change How Growth Rates Compare
Published: November 2, 2026
Two things in RBI's data have a bearing on how credit growth rates compare. No issues here - but analysts and their agents need to be aware and make adjustments where required.
The total and the sectors come from two different RBI returns and in some months, this September included, the two are measured from different dates also.
First one - the source difference
Total bank credit, up 19.4% in September, covers all banks. The sector figures cover select banks with about 95% of non-food credit. So the sectors do not add up to the total, and RBI says so in its notes. RBI has published it this way since 2021 ... nothing new here.
2nd one - the date diff
The two are also measured from different dates. Since December 2025 the data is as of month-end, under the Banking Laws (Amendment) Act 2025. The year-earlier month still uses the old reporting dates: 3 October 2025 for the total and 19 September 2025 for the sectors. Measured from 19 September, non-food credit is up 21.4% against the 19.1% RBI publishes. So this September the sector growth rates have about 2 extra points next to the headline.
2nd one will auto-resolve
This year is a transition period. From the December 2026 data both years are month-end.
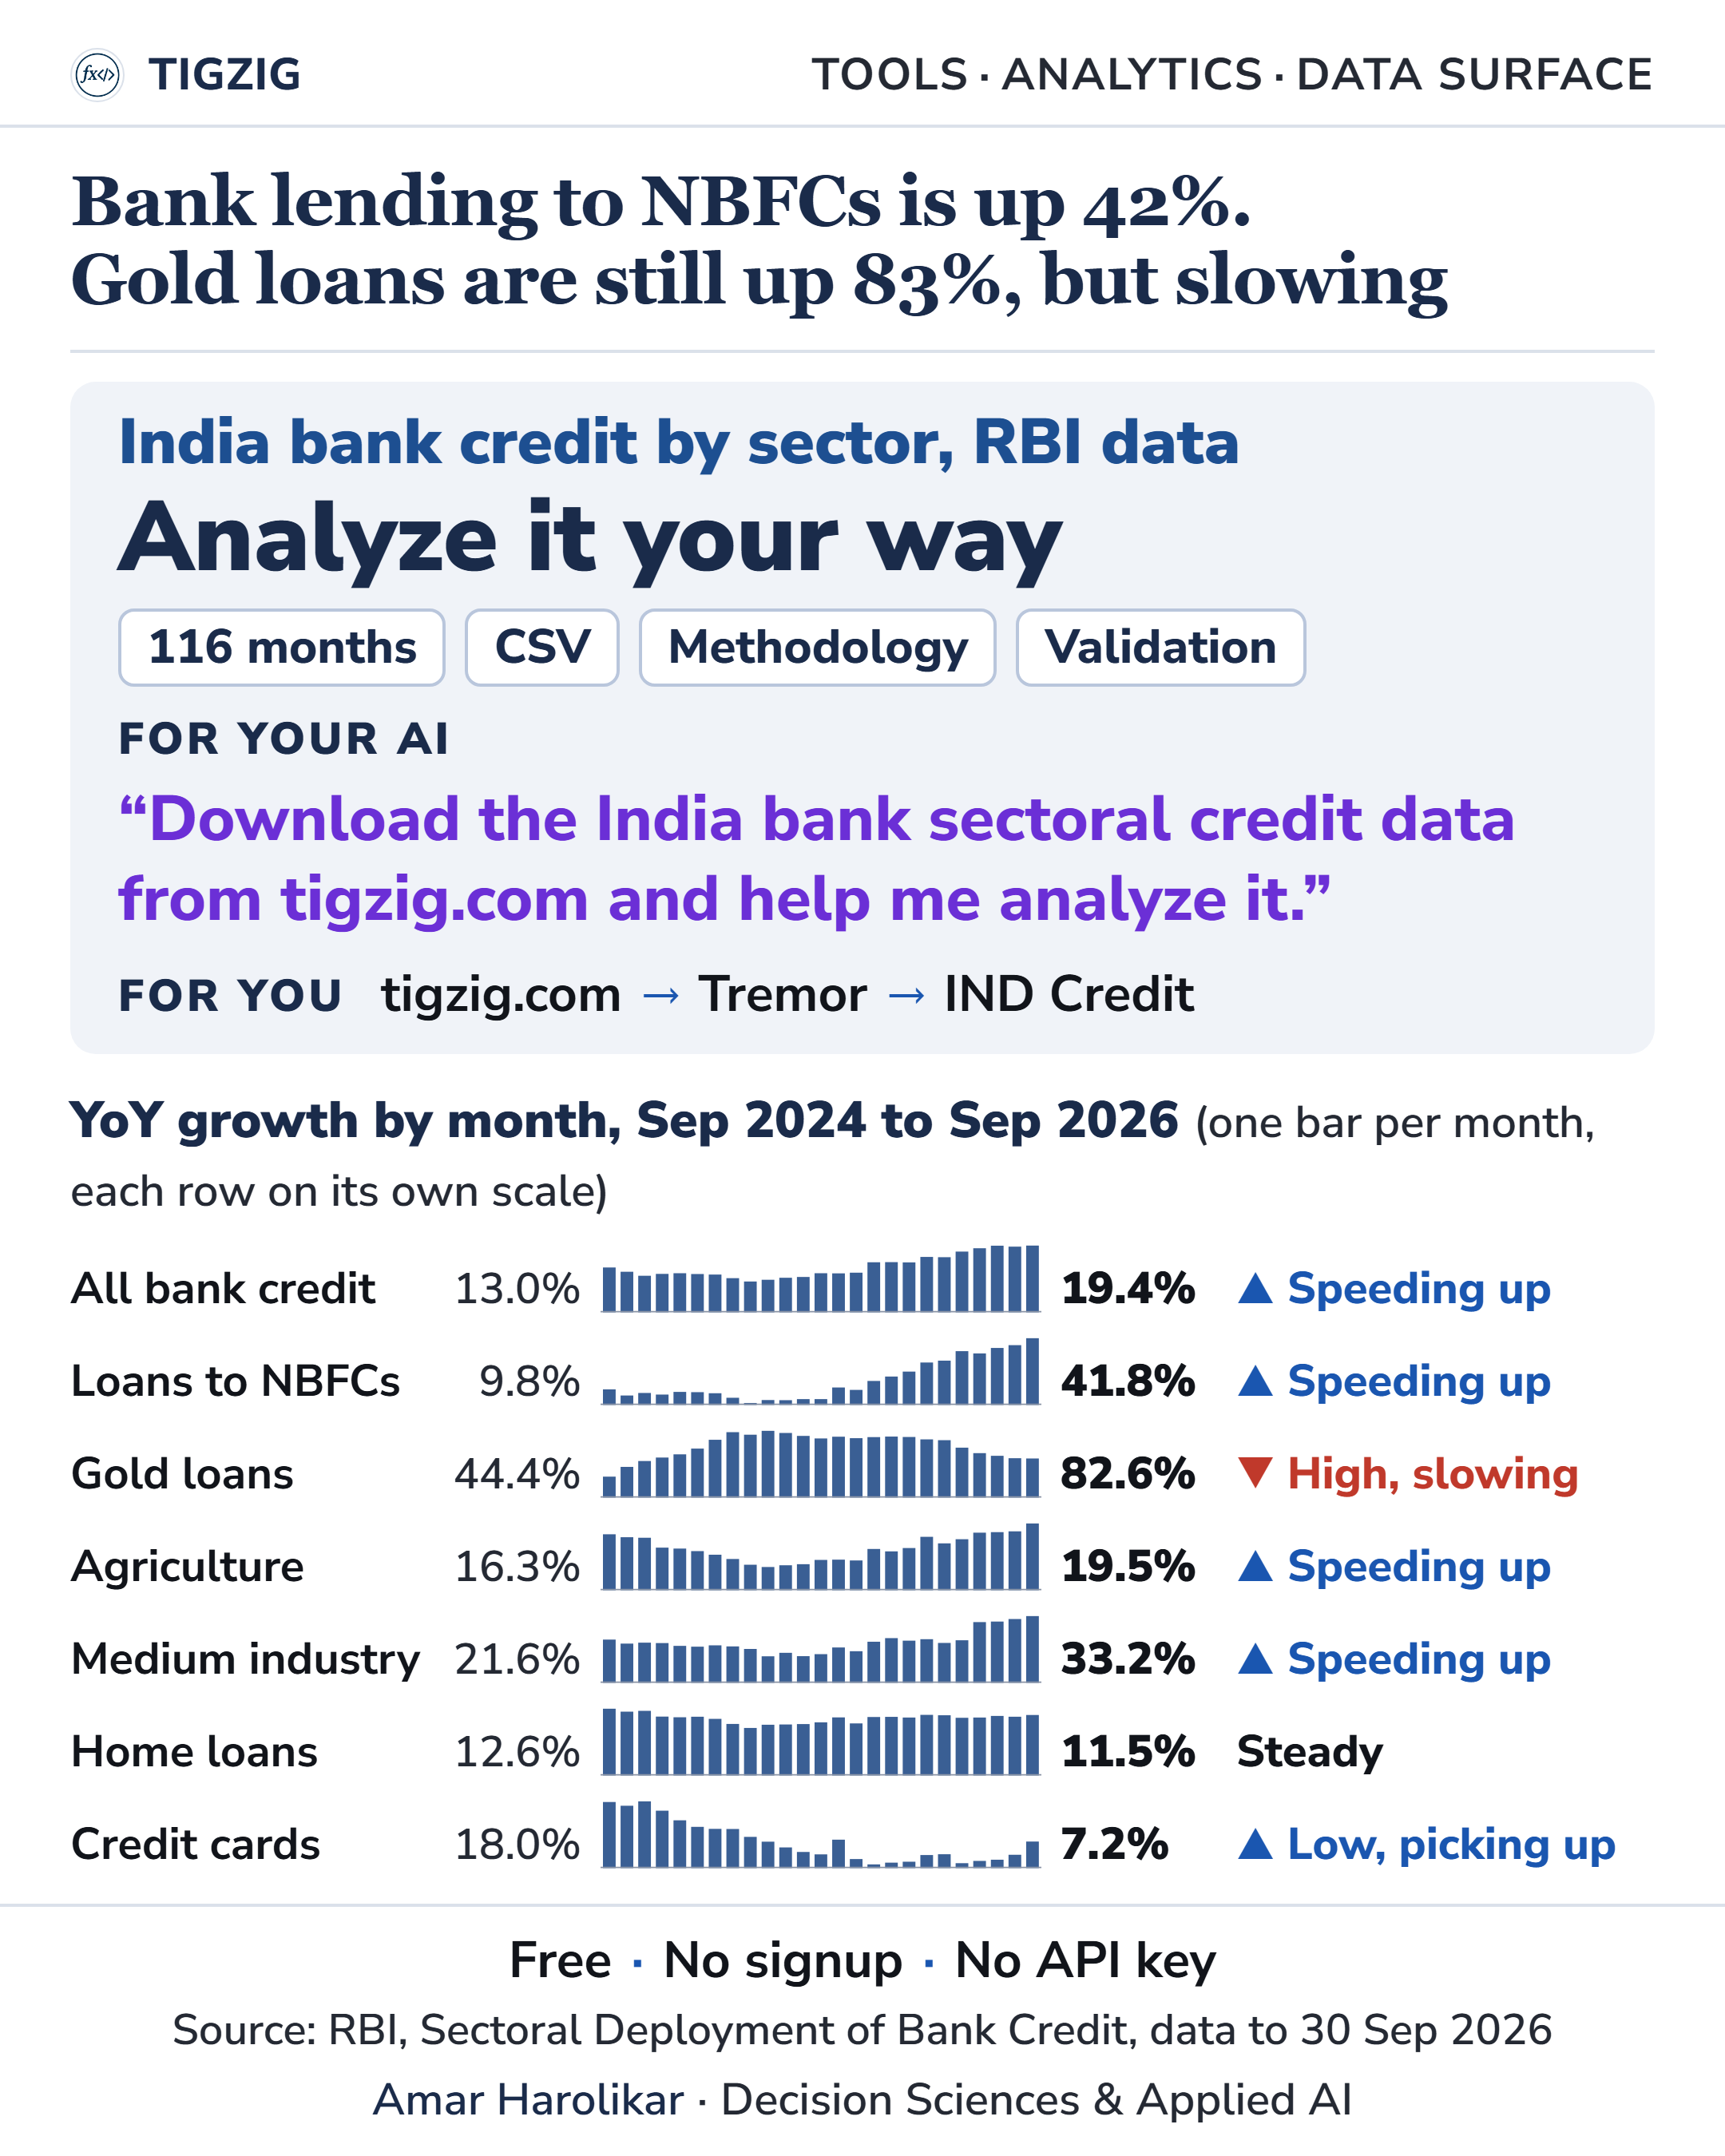
RBI's Sep 2026 sectoral credit data is now on Tremor.
Analyze it your way in the tool, or have your AI agent pull the file. Every row in the file has its month and its own as-of date. RBI also revises earlier months, and the file carries its latest figure.
For you - live tool
The tool shows trends and the sector tree, with the CSV, the data dictionary, and the methodology (with a worked example) and validation pages.
tigzig.com ➜ Tremor ➜ IND Credit
For your AI agent
"Go to tigzig.com and get the India bank sectoral credit data and help me analyze it. Pull the methodology and validations also. Fetch live page directly"
Tigzig Agent Data Surface (all data - for you and your agents)
Downloads: tigzig.com/downloads
API / MCPs: tigzig.com/apis
A few quick points on the data
Refer to the methodology and validation docs for details.
NBFCs. RBI publishes bank lending to NBFCs as one line, with two sub-items: housing finance companies and public financial institutions. The rest is not shown separately. It covers microfinance institutions, gold loan NBFCs and other NBFCs. The tool adds it as Other NBFCs, calculated as NBFCs minus the two sub-items.
Totals before April 2019. RBI later restated total bank credit for April 2019 to March 2021 on the all-bank basis. Earlier months were not restated, so the totals step up at April 2019.
In RBI's April 2026 release, Bank Credit for April 2024 and April 2025 differs from Food plus Non-food Credit by about Rs 530 crore and Rs 1,356 crore. RBI dates these 3 May 2024 and 2 May 2025. The tool shows the figures as RBI published them.
Since May 2024 one bank has moved a category of agricultural loans into loans against gold jewellery, per RBI's footnote. Gold loan growth across that month includes this shift.
Earlier notes on India bank credit
May 2026 data, 10 Jul. Credit up 18%, with gold loans more than doubling and housing growing slower than the average: tigzig.com/post/india-bank-credit-may2026
Credit-deposit ratio at a 15-year high, 8 Apr. Credit grew faster than deposits, and gold loans were up 4x in two years: tigzig.com/post/india-credit-deposit-ratio-gold-loans-apr2026
Working on something similar? How I work covers the rates, the availability and what I take on.