Two Weeks of Foreign Buying Undid Six Months of Net Selling in Financials
Published: November 19, 2026
Foreign investors have bought about US$11B of Indian shares so far in November. Since October 2024 they came back five times, and each time they soon left and sold more than they bought. November looks different so far.
How big
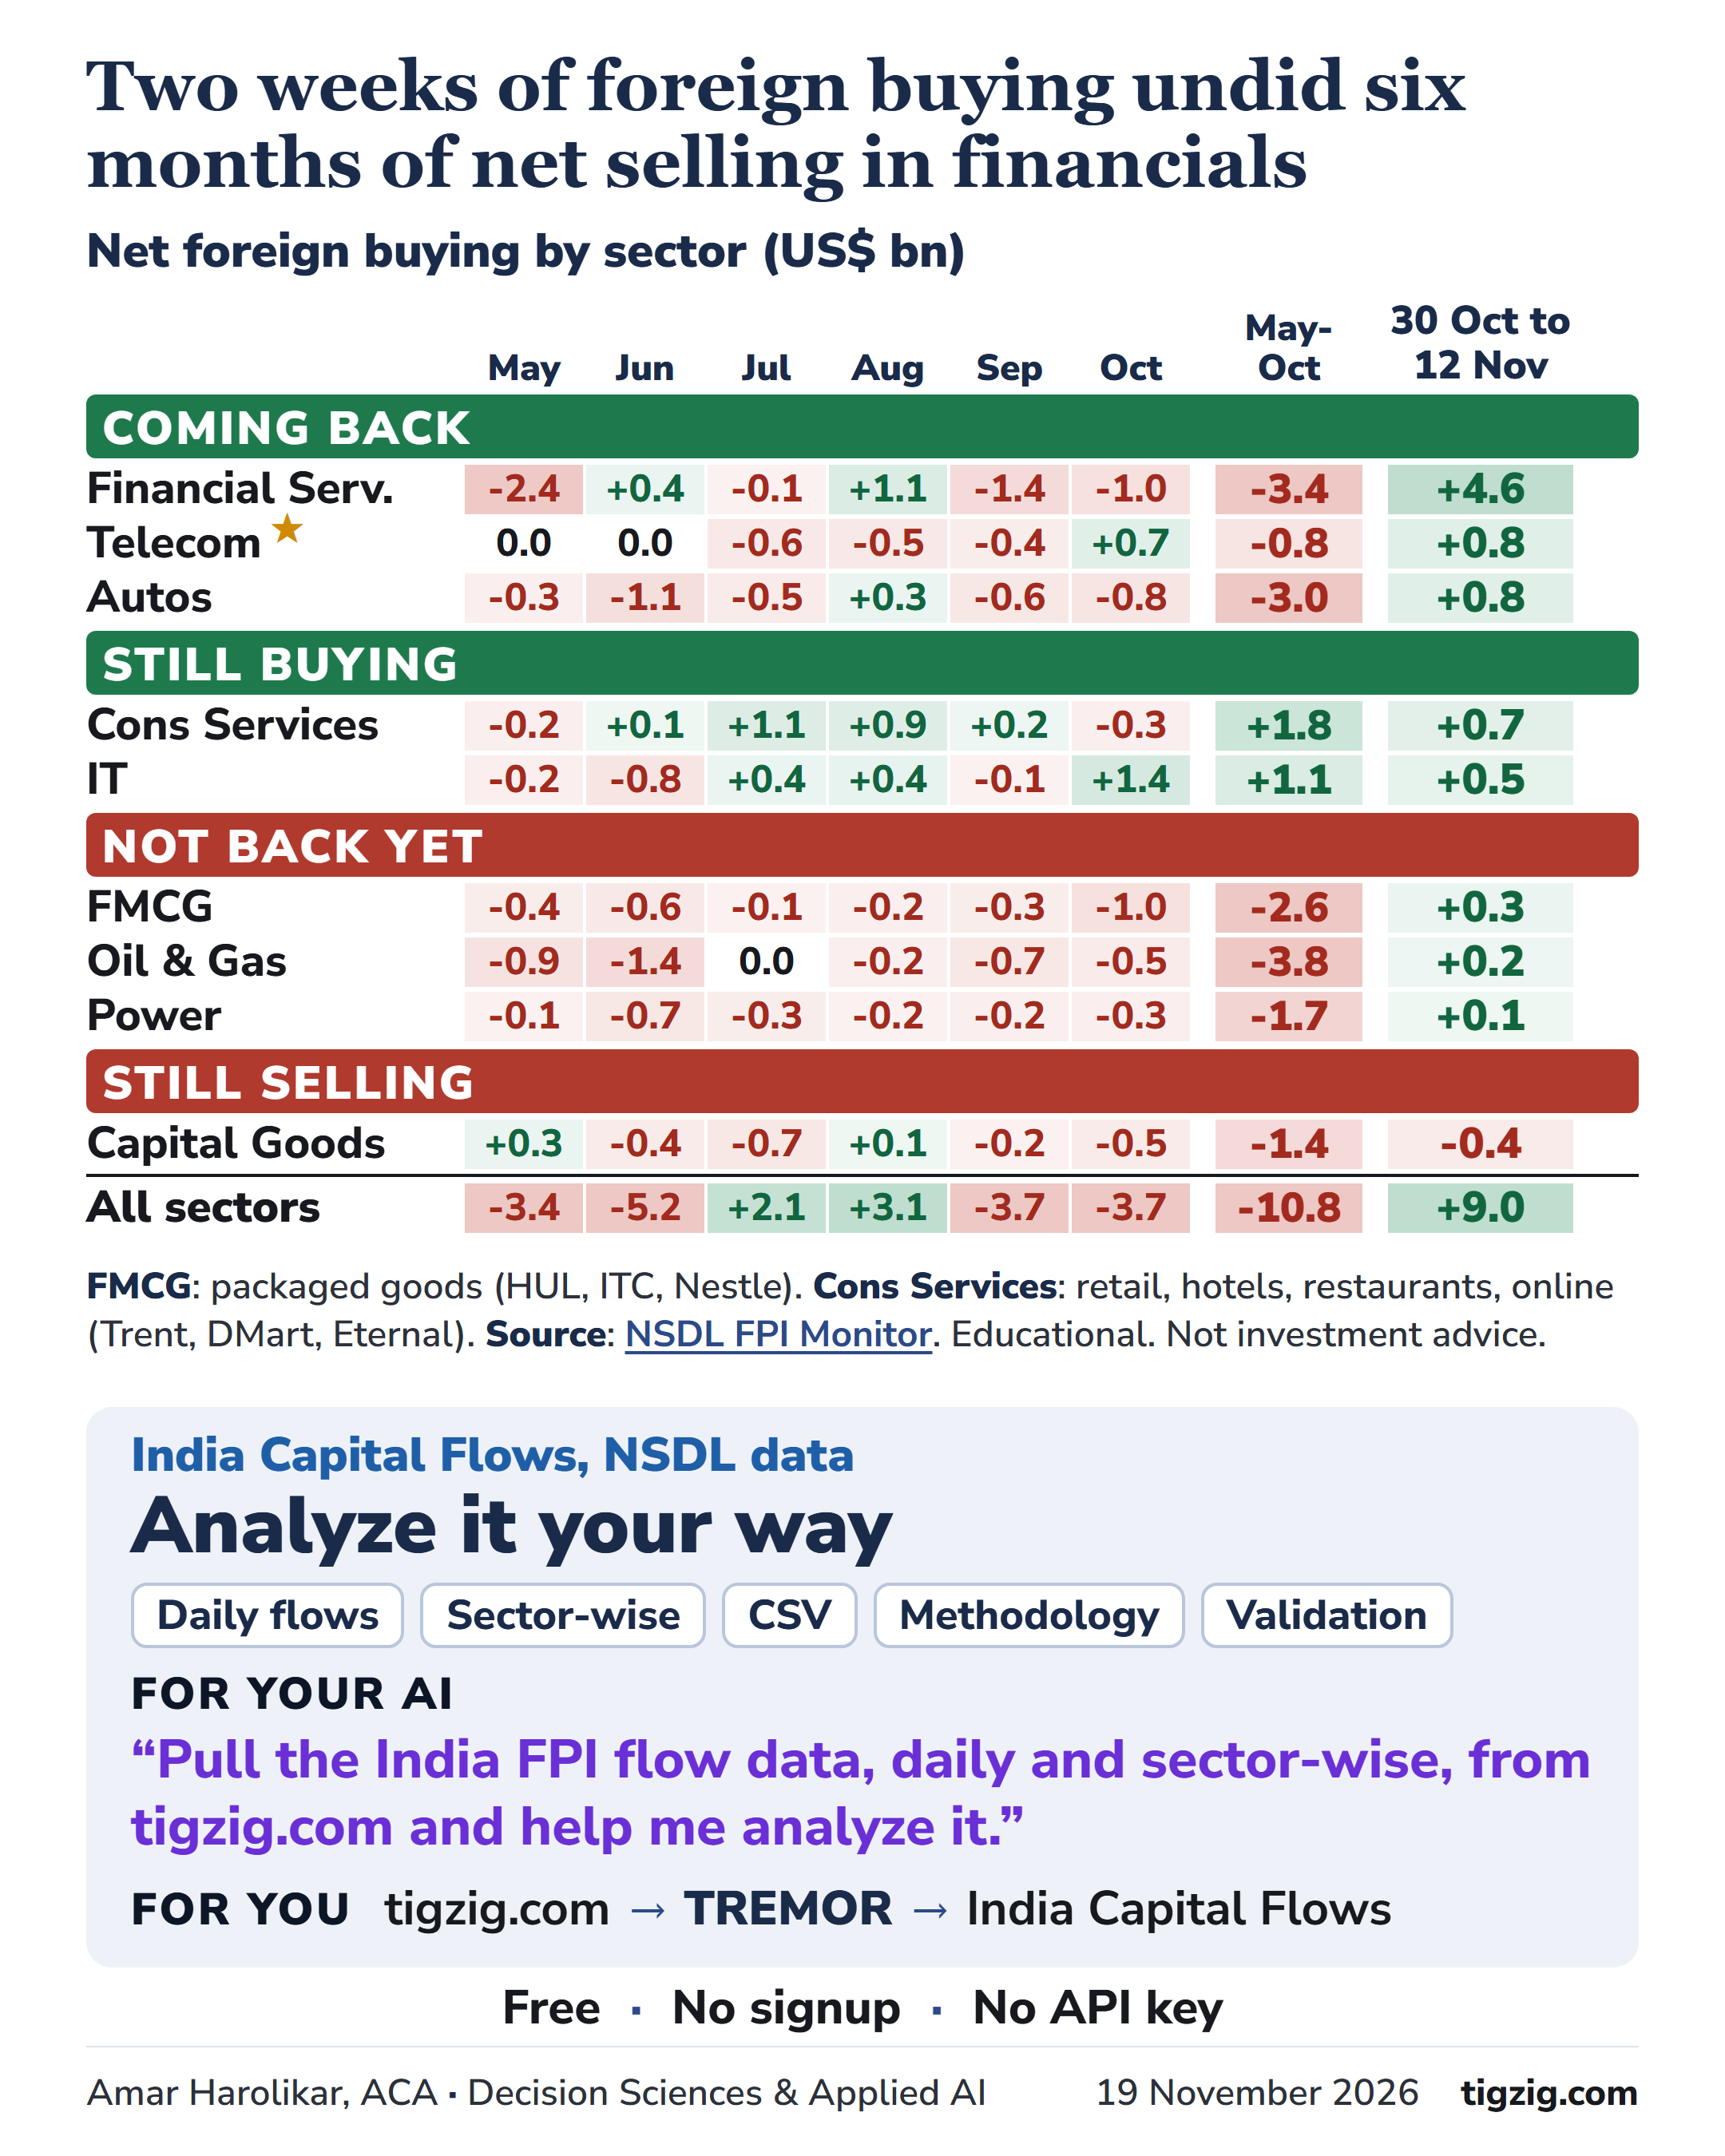
It is about twice the biggest of those five bounces, which were each US$5.2B or less. Bigger buying has not always lasted either. In 2023 foreign investors bought US$21B and then US$9B, and the selling after each was much smaller. But the US$15B they bought from June to September 2024 was followed by US$14B of selling in October and November 2024 alone. So it is too early to say whether November is the start of a longer return or another bounce. Financial services took about half of the buying from 30 Oct to 12 Nov.
Dig into the capital flows yourself
The India Capital Flows tool on TREMOR covers:
Foreign portfolio investors: daily flows, flows by sector, holdings by country of the fund
Domestic institutions and mutual funds
Who holds Indian shares with custodians, and FDI
Your own charts, downloads, methodology and validation notes
For you: tigzig.com ➜ TREMOR ➜ India Capital Flows Quick link: https://tremor.tigzig.com/tools/india-capital-flows
For your AI agent: "Pull the India FPI flow data, daily and sector-wise, from tigzig.com and help me analyze it."
A few data points
While foreign investors bought, domestic institutions sold. From 30 Oct to 17 Nov they sold about US$6.2B of Indian shares on the stock exchanges, and mutual funds sold about US$3.2B there, on every one of the 12 trading days.
Telecom, marked with a star in the image above: Jio Platforms listed on 28 Oct, so much of the telecom buying is likely its IPO and first weeks of trading. NSDL does not show flows by company.
Financial services were sold by about US$13B from January to October 2026, most of it in March and April. The two weeks undid about a third of that.
Three trading days, 5, 6 and 11 Nov, gave about half of the two weeks' buying. Some of it may be block deals or index trades, which I have not checked yet.
The last column in the image above covers trades from 30 Oct to 12 Nov; the month columns are NSDL report months. November so far covers trades from 30 Oct to 17 Nov. NSDL dates each day's trades one business day later.
FMCG is packaged goods such as HUL, ITC and Nestle. Consumer services is retail, hotels, restaurants and online platforms such as Trent, DMart and Eternal.
Flows are from NSDL. Monthly mutual fund flows in the tool are from SEBI and AMFI.
Educational information. Not investment advice.
Working on something similar? How I work covers the rates, the availability and what I take on.