Job gains bounced back. Households are still squeezed.
Published: November 17, 2026
The chance Americans put on unemployment rising over the next year is the highest since April 2020, in the NY Fed's October survey. Over the past year they have also expected their spending to grow faster than their income.
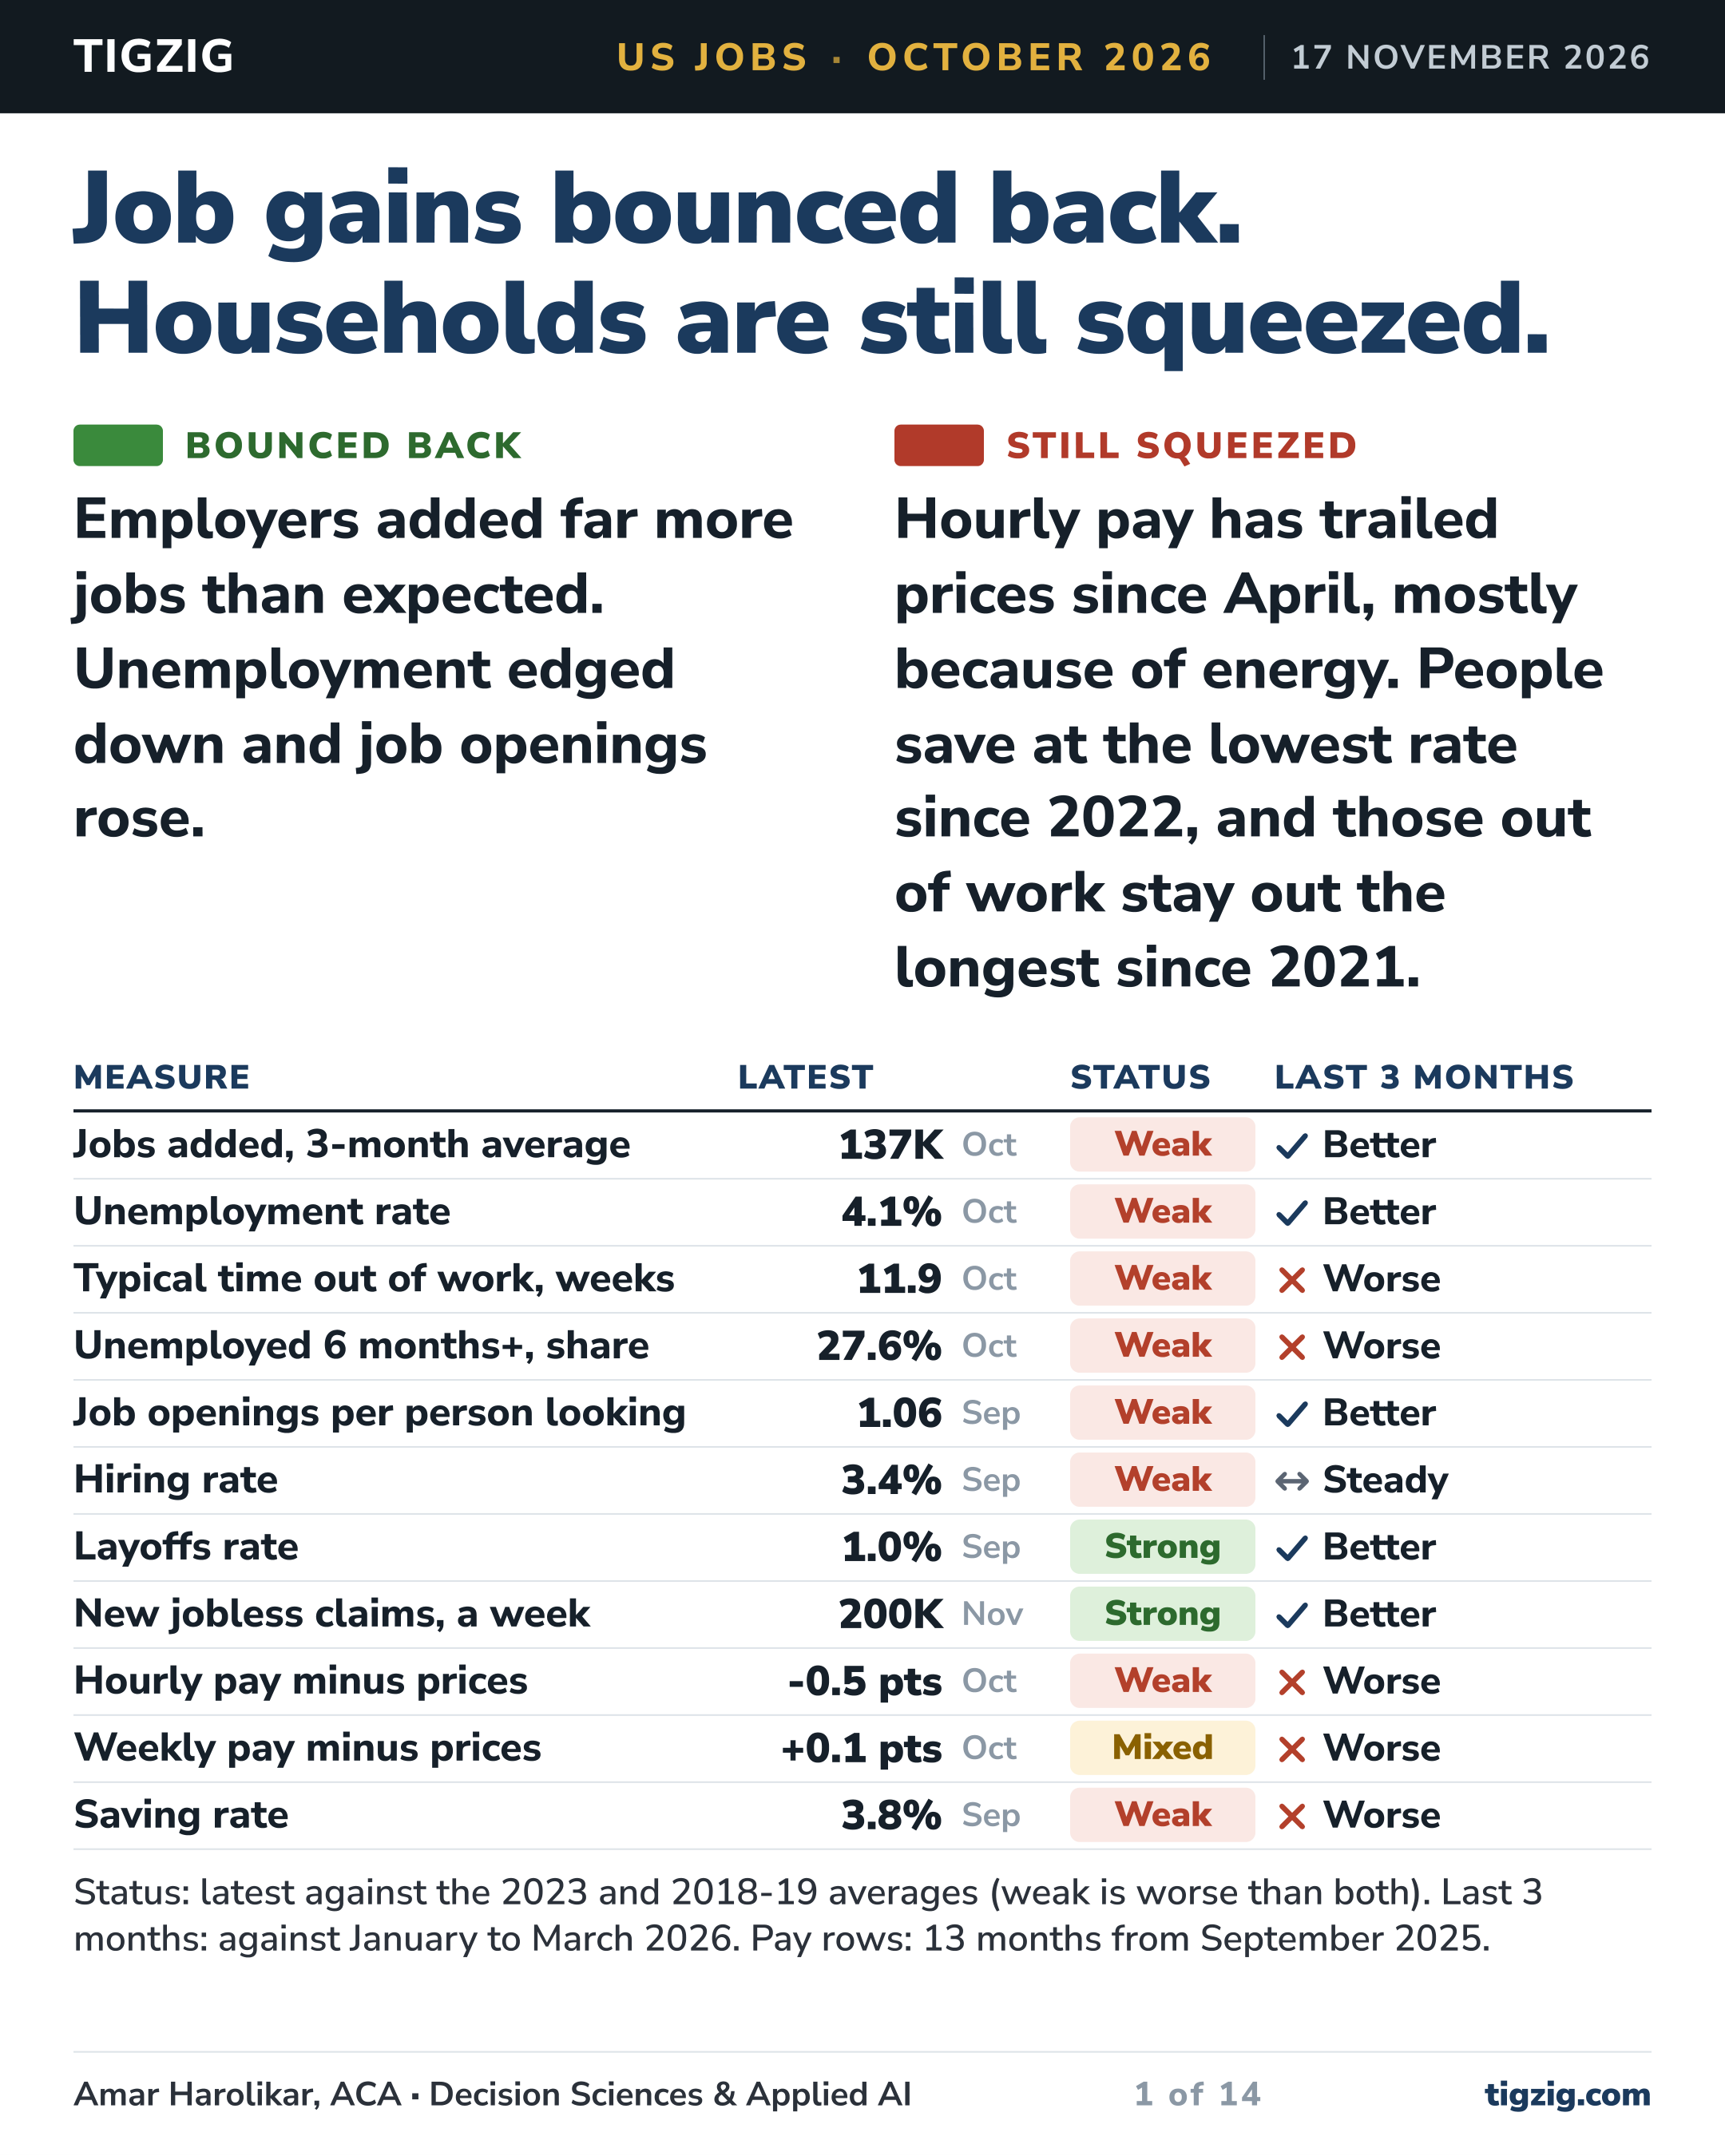
The job numbers improved. Employers added far more jobs than expected in October, job gains picked up over the last three months and more people quit their jobs, most of them in restaurants, hotels and leisure.
The pressure is in pay and saving. Hourly pay has trailed prices since April, mostly because of energy. Spending per person is growing faster than income, and people now save at the lowest rate since 2022. Those who lose a job stay out longer, the longest spells since 2021.
The first page scores 11 measures, and the pages after it have the charts behind each one.
This updates my analysis of 4 Oct 2026: "US Jobs, September 2026: Fewer New Jobs, Longer Searches, Pay Barely Keeping Up" https://www.tigzig.com/post/us-jobs-september-2026-update-oct2026
Other analysis at: https://www.tigzig.com/analysis
A few data points
One month's payroll change has a margin of about ±122,000 (BLS), so the three-month average is the better guide.
The NY Fed survey also has the other side. The chance people put on finding a job if they lost theirs is the highest since November 2025.
BLS has no October 2025 prices because of the shutdown. Over the 13 months from September 2025, hourly pay rose 3.5% and prices 4.1%. In October alone pay rose 0.37% and prices 0.35%.
By each November report, first jobs numbers have been revised down four years in a row, the longest run in records back to 1956. In 2026, 5 of the 8 months so far were revised up.
My earlier piece on US consumers and late payments, Oct 2026. https://www.tigzig.com/post/us-consumer-pressure-late-payments-oct2026
Job gains bounced back. Households are still squeezed.
Browse the slides or download the PDF
Full Deck Content (Text Format)
Text below was extracted from the source deck. Chart visuals stay in the PDF and as slide images above the post.
Slide 1
TIGZIG US JOBS · OCTOBER 2026 17 NOVEMBER 2026
Job gains bounced back. Households are still squeezed.
Bounced back Employers added far more jobs than expected. Unemployment edged down and job openings rose.
Still squeezed Hourly pay has trailed prices since April, mostly because of energy. People save at the lowest rate since 2022, and those out of work stay out the longest since 2021.
Measure Latest
Status Last 3 months
Jobs added, 3-month average 137K Oct Weak Better
Unemployment rate 4.1% Oct Weak Better
Typical time out of work, weeks 11.9 Oct Weak Worse
Unemployed 6 months+, share 27.6% Oct Weak Worse
Job openings per person looking 1.06 Sep Weak Better
Hiring rate 3.4% Sep Weak Steady
Layoffs rate 1.0% Sep Strong Better
New jobless claims, a week 200K Nov Strong Better
Hourly pay minus prices -0.5 pts Oct Weak Worse
Weekly pay minus prices +0.1 pts Oct Mixed Worse
Saving rate 3.8% Sep Weak Worse
Status: latest against the 2023 and 2018-19 averages (weak is worse than both). Last 3 months: against January to March 2026. Pay rows: 13 months from September 2025.
Amar Harolikar, ACA · Decision Sciences & Applied AI
1 of 14
tigzig.com
Slide 2
TIGZIG US JOBS · OCTOBER 2026 17 NOVEMBER 2026
Job gains picked up: 137K a month in the last three months, against 28K in the three before.
Average jobs added a month, in thousands
All jobs +210 2023 +74 Last 12m +137 Last 3m Health care, social +83 2023 +43 Last 12m +35 Last 3m All except health +126 2023 +31 Last 12m +102 Last 3m
| OTHER SECTORS | 2023 | LAST 12M | LAST 3M |
|---|---|---|---|
| Government | +60 | -5 | +11 |
| Professional, business | -11 | +22 | +36 |
| Leisure, hospitality | +38 | +1 | +14 |
| Construction | +18 | +10 | +10 |
| Financial | +2 | -8 | -4 |
| Information | -11 | -10 | -11 |
One month's change has a margin of about ±122K (BLS), so the three-month average is the better guide. Temporary help added 19K of professional and business services' 70K in October. Last 12 months is November 2025 to October 2026. It leaves out October 2025, when a one-off federal drop of 166K took the month to -140K.
SourcesBLS payroll survey via FRED; margin, BLS technical note. Full sources and method on the last page.
Amar Harolikar · Decision Sciences & Applied AI
2 of 14
tigzig.com
Slide 3
TIGZIG US JOBS · OCTOBER 2026 17 NOVEMBER 2026
Unemployment has eased since late 2025. Since July the share of adults in work has risen three months in a row.
Since July, participation rose from 61.4 to 61.9 per cent and the share in work from 58.9 to 59.3.
Unemployment rate per cent Jan 2023 Oct 2026 3.5 4.1 Participation like for like, since Sep 2025 Sep 2025 Oct 2026 62.0 61.9 Share of adults in work like for like, since Sep 2025 Sep 2025 Oct 2026 59.2 59.3 Prime-age in work ages 25 to 54, per cent Jan 2023 Oct 2026 80.3 80.7 Broad rate, U-6 adds involuntary part-time Jan 2023 Oct 2026 6.7 7.9 Part time, want full time per cent of employment Jan 2023 Oct 2026 2.52 2.96
U-6, the broad rate, fell from 8.4 in December to 7.6 and ticked up to 7.9 in October, as did part time wanting full time. Both fell in the first half. Since September 2025, participation is down 0.1 and the share in work up 0.1.
SourcesBLS household survey via FRED and the BLS population-adjusted series. Full sources and method on the last page.
Amar Harolikar · Decision Sciences & Applied AI
3 of 14
tigzig.com
Slide 4
TIGZIG US JOBS · OCTOBER 2026 17 NOVEMBER 2026
More openings, hiring and quits than a year ago, and fewer layoffs. Most of September's extra quits were in restaurants, hotels and leisure.
Job openings per person looking Jan 2023 Sep 2026 1.79 1.06 Hiring rate per cent of employment Jan 2023 Sep 2026 4.1 3.4 Quits rate per cent of employment Jan 2023 Sep 2026 2.5 2.1 Layoffs rate per cent of employment Jan 2023 Sep 2026 1.1 1.0 Hires per opening hires over openings Jan 2023 Sep 2026 0.62 0.72 Job openings millions Jan 2023 Sep 2026 10.32 7.52
A year ago: openings 7.17 million (now 7.52), hiring rate 3.3 (3.4), quits 1.9 (2.1), layoffs 1.1 (1.0). Hires per 100 openings are 72, against 73 a year ago and 81 in 2018 and 2019.
The news is full of layoffs. Why is the rate low? About 1.6 million people were laid off or let go in September, against 1.8 million a month in 2018 and 2019. As a share of all jobs, layoffs are below the pre-pandemic level.
SourcesBLS JOLTS via FRED. Full sources and method on the last page.
Amar Harolikar · Decision Sciences & Applied AI
4 of 14
tigzig.com
Slide 5
TIGZIG US JOBS · OCTOBER 2026 17 NOVEMBER 2026
Hourly pay beat prices from May 2023 to March 2026. Since April it has been behind.
Hourly pay growth on a year, per cent Jan 2023 Sep 2026 4.5 3.2 Prices, CPI growth on a year, per cent Jan 2023 Sep 2026 6.3 3.7 Energy prices growth on a year, per cent Jan 2023 Sep 2026 0 8.3 20.4 Hourly pay minus prices points Jan 2023 Sep 2026 0 -1.83 -0.56 Pay minus core prices points, no food or energy Jan 2023 Sep 2026 0 -1.05 0.59 Weekly pay minus prices points, hours included Jan 2023 Sep 2026 0 -1.53 0.05
Why it moved. Prices slowed in 2023 and pay pulled ahead. Energy prices rose 13% year on year in March 2026, and from April prices rose faster than pay.
October. BLS has no October 2025 prices. Over 13 months from September 2025, prices rose 4.08% and hourly pay 3.54%. In October alone pay rose 0.37% and prices 0.35%.
SourcesBLS, via FRED. Full sources and method on the last page.
Amar Harolikar · Decision Sciences & Applied AI
5 of 14
tigzig.com
Slide 6
TIGZIG US JOBS · OCTOBER 2026 17 NOVEMBER 2026
Spending per person is growing faster than income, so people are saving less of their income. Income after prices is still growing, just more slowly.
Income per person growth on a year, after prices Jan 2025 Sep 2026 0 0.8 0.7 Spending per person growth on a year, after prices Jan 2025 Sep 2026 2.6 2.3 Saving rate per cent of after-tax income Jan 2025 Sep 2026 5.7 3.8
The dotted line is growth over the last 12 months against the 12 months before.
Saving rate since 1959 per cent of after-tax income, yearly average 1959 2026 13.5 in 1971 2.3 in 2005 7.9 in 2012 15.1 in 2020 10.3 4.6
Over the last 12 months, spending per person grew 2.0 per cent and income per person 1.0 per cent. Those are the dotted lines.
Saving averaged 8.5 per cent of after-tax income from 1959 to 2019. It is 4.6 in 2026 so far.
SourcesBEA, revised 30 September 2026, via FRED. Full sources and method on the last page.
Amar Harolikar · Decision Sciences & Applied AI
6 of 14
tigzig.com
Slide 7
TIGZIG US JOBS · OCTOBER 2026 17 NOVEMBER 2026
People stay out of work longer. The average spell is 27.1 weeks, the longest since December 2021.
Average spell weeks out of work Jan 2023 Oct 2026 20.4 27.1 Median time out of work weeks Jan 2023 Oct 2026 9.6 11.9 Out of work 6 months+ millions Jan 2023 Oct 2026 1.09 1.96 Out 6 months+, share per cent of the unemployed Jan 2023 Oct 2026 19.0 27.6 Out of work 15 weeks+ per cent of the labour force Jan 2023 Oct 2026 1.2 1.9 Laid off for good per cent of the labour force Jan 2023 Oct 2026 0.78 1.01
The median, 11.9 weeks, is also the highest since 2021, though it has moved less than the average. The average rose 2.3 weeks in one month. 1.96 million have been out six months or more, 27.6 per cent of the unemployed against 23.6 in September 2025. The series is noisy month to month.
SourcesBLS household survey via FRED. Full sources and method on the last page.
Amar Harolikar · Decision Sciences & Applied AI
7 of 14
tigzig.com
Slide 8
TIGZIG US JOBS · OCTOBER 2026 17 NOVEMBER 2026
More details
The next pages hold the supporting charts and the sources:
How first jobs numbers get revised: the past year, month by month, and by year since 1956
Jobs by sector, month by month
Jobless claims and people reaching the end of benefit
Sources and method
Amar Harolikar · Decision Sciences & Applied AI
8 of 14
tigzig.com
Slide 9
TIGZIG APPENDIX · US JOBS OCTOBER 2026 17 NOVEMBER 2026
The past year was smaller than first reported.
Jobs added, 12 months to September 737K First reported 580K Today
Revised down 21%
As first reported, the 12 months to September added 737K jobs. Today the same months add up to 580K. 6 of the 12 were revised down, but the latest report raised August and September by 84K.
How many jobs a month does the US need now? Fewer, with more retirements and fewer immigrants. Reuters (2 October) put the break-even at about 50K a month, RBC at 20K. The last three months averaged 137K.
The same 12 months, plus October, in thousands
First reported As published today · October is a first estimate
-140 Oct +41 Nov -17 Dec +160 Jan 26 -156 Feb +214 Mar +148 Apr +63 May +31 Jun -10 Jul +186 Aug +60 Sep 26 +165 Oct
SourcesBLS payroll survey via ALFRED and FRED; break-even, Reuters and RBC. Full sources and method on the last page.
Amar Harolikar · Decision Sciences & Applied AI
9 of 14
tigzig.com
Slide 10
TIGZIG APPENDIX · US JOBS OCTOBER 2026 17 NOVEMBER 2026
First jobs numbers are still revised by 40K to 55K a month. In 2026 the revisions turned: 5 of 8 months were revised up.
How much each month's first jobs number changed two months later, thousands
Revised up Revised down · January 2023 to August 2026
-100 -50 +50 0 2023 2024 2025 2026
| PERIOD | MONTHS REVISED DOWN | AVERAGE, K | TYPICAL SIZE |
|---|---|---|---|
| 2010s | 45 of 120 | +16 | 35K |
| 2023 | 10 of 12 | -30 | 50K |
| 2024 | 6 of 12 | -20 | 48K |
| 2025 | 12 of 12 | -56 | 56K |
| 2026, to August | 3 of 8 | -8 | 42K |
These are BLS's two monthly revisions. The February check against tax records comes on top (next page). The latest report added 84K to August and September.
SourcesBLS payroll survey via ALFRED. The figure two releases later is BLS's third estimate; months after August have not had two more releases yet. Full sources and method on the last page.
Amar Harolikar · Decision Sciences & Applied AI
10 of 14
tigzig.com
Slide 11
TIGZIG APPENDIX · US JOBS OCTOBER 2026 17 NOVEMBER 2026
By each November report, job growth has been revised down four years in a row, the longest run in records back to 1956.
Revision by each November report, thousands a month
Revised up Revised down · 12 months from October to September
-50 -25 +25 +50 +75 +100 0 1980 1990 2000 2010 2020 2026 4 years down in a row
This year's cut, 13K a month, is the smallest of the four so far. Every February, BLS checks the past year against tax records. That took 2023, 2024 and 2025 (so far) to cuts of 41K, 97K and 88K a month. In thousands a month, 2024 and 2025 are the second and third largest since 1980. This year's check comes in February 2027; BLS's preliminary estimate (28 August) is a cut of 79K in total, about 7K a month. Counted after the February check, 1985 to 1989 had a longer run, five years.
MethodEach bar is the 12-month change in that year's November report (the one that first publishes October), minus the sum of the months as first reported, divided by 12. ALFRED, every vintage of PAYEMS, which go back to 1955; before 1980 no run was longer than one year. In 2025 the October figure came on 16 December, after the shutdown. Preliminary benchmark: BLS, 28 August 2026.
Amar Harolikar · Decision Sciences & Applied AI
11 of 14
tigzig.com
Slide 12
TIGZIG APPENDIX · US JOBS OCTOBER 2026 17 NOVEMBER 2026
Information shed jobs in 10 of the last 12 months, finance in 7. Health care adds half its 2023 pace.
The same nine sectors, month by month. Each chart has its own scale, to show its trend.
Jobs added each month, in thousands, January 2023 to October 2026. The October 2025 drop is a federal one-off. In February 2026 a strike kept more than 30,000 health care workers off payrolls.
All jobs Health care, social All except health, social Government Professional, business Leisure, hospitality Construction Financial Information
SourcesBLS payroll survey via FRED. Full sources and method on the last page.
Amar Harolikar · Decision Sciences & Applied AI
12 of 14
tigzig.com
Slide 13
TIGZIG APPENDIX · US JOBS OCTOBER 2026 17 NOVEMBER 2026
Fewer people are being let go than a year ago, so fewer claim benefit. More of those who claim now reach the end of it than in 2023.
New jobless claims thousands a week Jan 2023 Nov 2026 204 200 Continuing claims thousands, monthly average Jan 2023 Oct 2026 1,604 1,707 Reach end of benefit per cent of claimants Jan 2023 Sep 2026 31.9 38.8
Unemployment is higher than in 2023. Why are new claims not? New claims count people let go each week, and that has not risen. Those let go stay out of work longer, so the number of unemployed who lost a job is up 22 per cent since January 2023, though down since February, while new claims are flat.
Why are continuing claims lower than a year ago? A new claim becomes a continuing claim, and fewer people are starting one: first payments in the three months to September were down 9 per cent from a year earlier. The share reaching the end of their benefit is about the same as a year ago, 38.8 per cent against 39.8, and well above the 31.9 of January 2023.
SourcesDepartment of Labor and BLS, via FRED. Full sources and method on the last page.
Amar Harolikar · Decision Sciences & Applied AI
13 of 14
tigzig.com
Slide 14
TIGZIG US JOBS · OCTOBER 2026 17 NOVEMBER 2026
Sources and method
Updates my analysis of 4 October 2026: US jobs, September 2026: fewer new jobs, longer searches, pay barely keeping up
Source What we use Series
BLS payroll survey Jobs by month and sector, hourly and weekly pay, hours PAYEMS and thirteen more
ALFRED Each month's jobs number as first reported PAYEMS, every vintage
BLS household survey Unemployment, U-6, time out of work, participation UNRATE, UEMPMEAN, CIVPART and fifteen more
BLS JOLTS Job openings, hires, quits, layoffs JTSJOL, JTSHIR and four more
Department of Labor weekly claims New and continuing claims, weekly figures averaged by month ICSA, CCSA
Department of Labor ETA 5159 Share who reach the end of their benefit ETA 5159, c51 and c56
BLS consumer prices Prices, core and energy CPIAUCSL and two more
BEA Saving rate, income and spending per person PSAVERT and three more
Reuters, RBC and CNBC Break-even, page 9; the October forecast 2 Oct, 6 Nov 2026
Openings per person looking. JOLTS openings over the unemployed, same month. Reach the end of benefit. Final payments over the twelve months to date, divided by first payments over the twelve months ending six months earlier. Revisions and like for like. A month's jobs number as first reported against the figure two releases later. Rates from September 2025 use the BLS population-adjusted series for the January 2026 update. October 2025. The household survey and CPI have no reading for it, because of the shutdown.
Data. FRED and ALFRED pulled 16 November 2026; DOL ETA 5159 pulled 8 November 2026.
Use of AI. Parts of this work were prepared with AI under my direction. I reviewed, edited and approved every page. The analysis, conclusions and judgment are mine.
Amar Harolikar · Decision Sciences & Applied AI
14 of 14
tigzig.com
Working on something similar? How I work covers the rates, the availability and what I take on.