US Consumers: The Pressure Is Building, Not Yet Breaking
Published: October 12, 2026
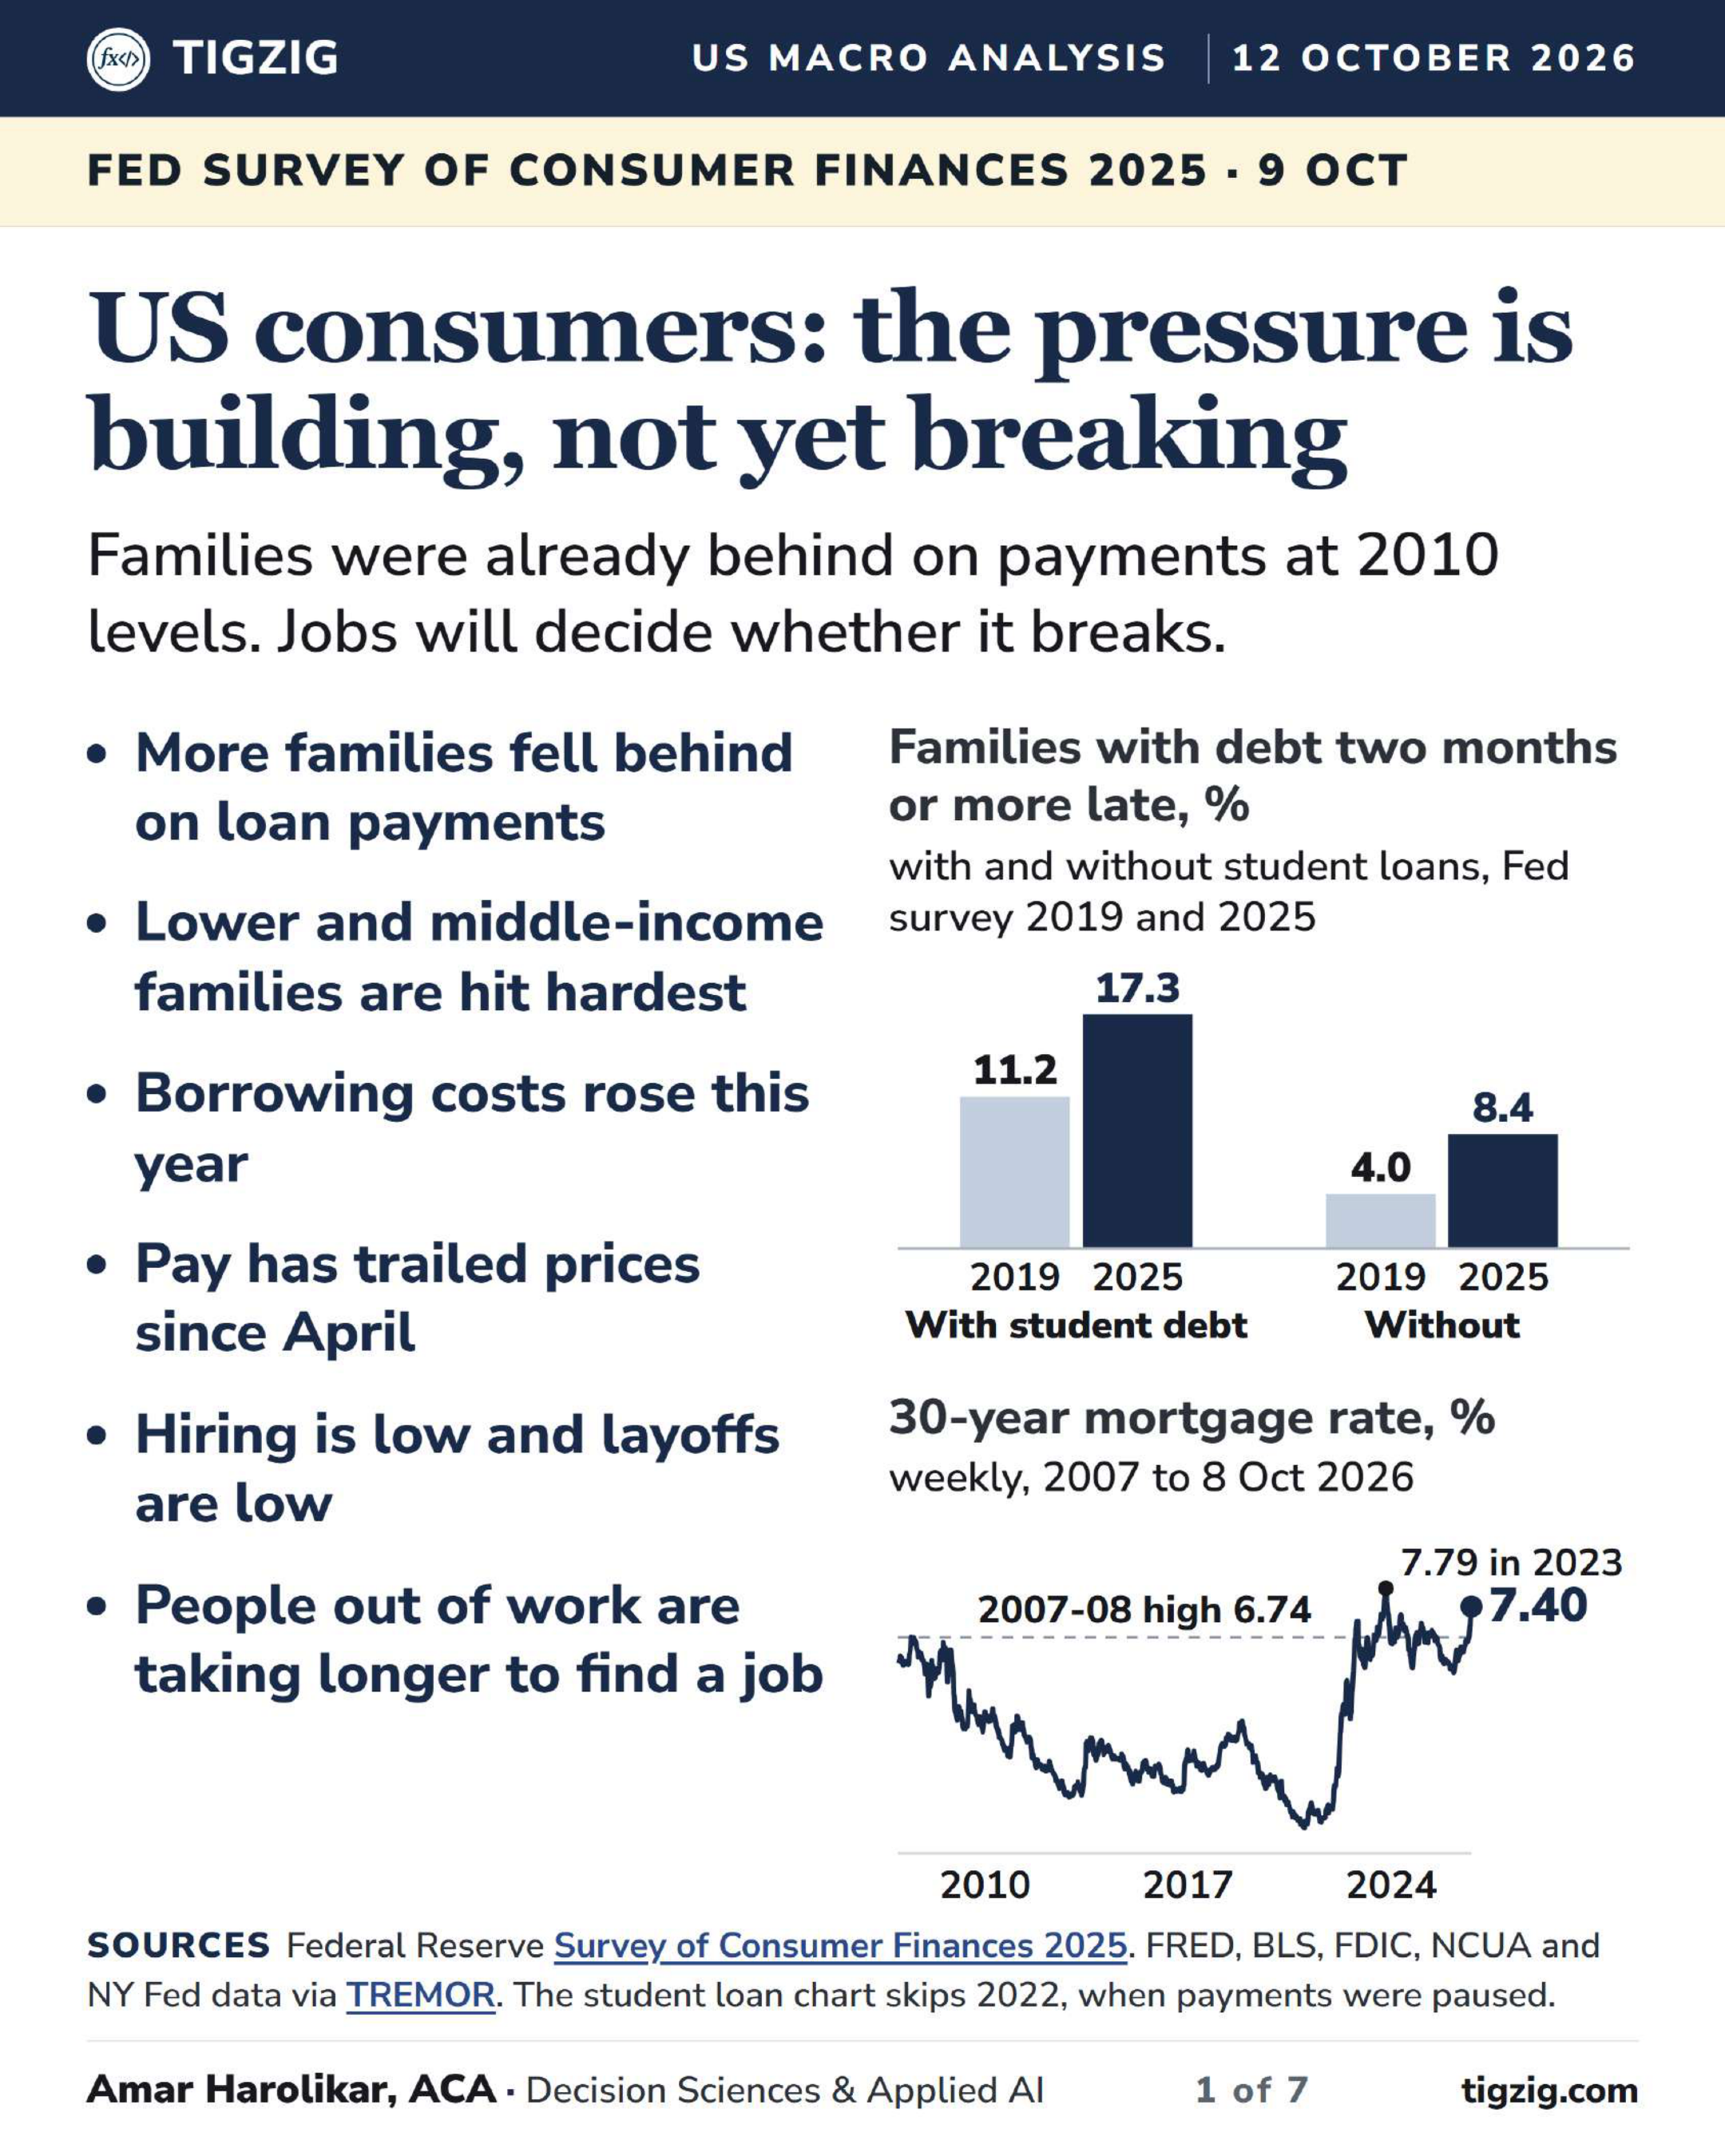
Lower and middle-income US families were already behind on loan payments at 2010 levels in 2025, per the Fed's survey. This year rates, energy prices and pay moved against them, and jobs now decide what comes next.
In the bottom fifth of incomes, 25.3% of families with debt were two months or more late. That is the highest reading since the survey began in 1989.
Across all families, 19.6% were behind on a loan payment in the year before the survey, against 12.2% in 2022. That is the highest since the 2007 survey, when it was 20.8%.
The 30-year mortgage rate has gone from 6.15% at the end of 2025 to 7.40%, and the Fed raised rates in September.
Energy prices are up 16.3% on a year, and hourly pay has grown slower than prices since April.
The lender data is under pressure but has not broken yet. Credit union losses are well above 2019 and bank card losses are close to 2019, while new 90-day lates on mortgages are still rising.
Hiring is low and layoffs are low, so jobs are what would move this.
The data is from the Fed survey and from FRED, FDIC, NCUA and NY Fed series on Tigzig TREMOR: tigzig.com/tremor
The September quarter lender numbers come in November and December.
Other analysis at: tigzig.com/analysis
Notes to the analysis
The Fed survey interviews ran through 2025 and into May 2026, and the late-payment question covers the year before each interview. The 25.3% is for families with debt, and the 19.6% is for all families.
Student loans are part of the rise. Among families with debt, two months or more late went from 11.2% in 2019 to 17.3% with student debt, and from 4.0% to 8.4% without it. I use 2019 because payments were paused from 2020 to 2023.
These are survey estimates from about 4,400 families, about 440 of them in the bottom fifth with debt. Gaps of a point or two are within sampling error.
The mortgage rate is above every week of 2007 and 2008, when the high was 6.74%, and below the 7.79% of October 2023.
Mortgages are about 70% of household debt and most are fixed, so higher long rates reach new borrowers first. Cards and home equity lines, about 9%, move with the Fed rate.
The NY Fed 90-day figures here are new flows into 90 days late. The NY Fed stock of 90-day debt also includes balances already charged off, so I have not charted it.
Bank card charge-offs are close to 2019, while the NY Fed shows 12.9% of card balances 90 days or more late. The NY Fed figure includes balances already charged off.
Earlier analysis this builds on
US jobs, September 2026. Fewer new jobs, longer searches, and pay barely keeping up with prices: tigzig.com/post/us-jobs-september-2026-update-oct2026
Bond markets are sounding an alarm, 6 September. Long rates rose in the US, Europe and Japan while the Fed was cutting: tigzig.com/post/bond-markets-alarm-sep2026
The bond market rout of 2026, 25 September. The 10-year Treasury went above 5% for the first time since 2007: tigzig.com/post/bond-market-rout-sep2026
NY Fed household debt, Q2 2026. The headline delinquency flow fell, but auto and mortgage went the other way: tigzig.com/post/nyfed-household-debt-q2-2026
US banks, Q2 2026. Charge-offs across all bank lending came off their peak and are still above 2019: tigzig.com/post/fdic-q2-2026-bank-credit-tremor-aug2026
Credit unions, Q2 2026. Losses above the pre-crisis level, and delinquency above pre-COVID in every segment: tigzig.com/post/credit-union-q2-2026-losses-delinquency-sep2026
US Consumers: The Pressure Is Building, Not Yet Breaking
Browse the slides or download the PDF
Full Deck Content (Text Format)
Text below was extracted from the source deck. Chart visuals stay in the PDF and as slide images above the post.
Slide 1
TIGZIGUS Macro Analysis 12 October 2026
Fed Survey of Consumer Finances 2025 · 9 Oct
US consumers: the pressure is building, not yet breaking
Families were already behind on payments at 2010 levels. Jobs will decide whether it breaks.
More families fell behind on loan payments
Lower and middle-income families are hit hardest
Borrowing costs rose this year
Pay has trailed prices since April
Hiring is low and layoffs are low
People out of work are taking longer to find a job
Families with debt two months or more late, % with and without student loans, Fed survey 2019 and 2025 11.2 2019 17.3 2025 With student debt 4.0 2019 8.4 2025 Without
30-year mortgage rate, % weekly, 2007 to 8 Oct 2026 2007-08 high 6.74 2010 2017 2024 7.79 in 2023 7.40
SourcesFederal Reserve Survey of Consumer Finances 2025. FRED, BLS, FDIC, NCUA and NY Fed data via TREMOR. The student loan chart skips 2022, when payments were paused.
Amar Harolikar, ACA · Decision Sciences & Applied AI1 of 7tigzig.com
Slide 2
TIGZIGThe Fed survey
More families fell behind on loan payments in 2025
19.6% of families were late on a loan payment in the year before the 2025 survey, the highest since the 2007 survey.
Student loans are part of it. Families with debt but no student debt fell behind too.
Late on any loan payment % of all families, Fed survey 20.8 2007 17.3 2010 14.9 2013 13.5 2016 12.3 2019 12.2 2022 19.6 2025
Two months or more late % of all families 5.5 2007 8.1 2010 6.9 2013 5.8 2016 4.6 2019 4.9 2022 8.2 2025
Paying over 40% of income on debt % of all families 11.3 2007 10.4 2010 8.2 2013 7.0 2016 7.4 2019 6.5 2022 8.6 2025
By student debt % of families with debt, two months or more late, 2019 and 2025 11.2 2019 17.3 2025 With student debt 4.0 2019 8.4 2025 Without
Sources and methodsFederal Reserve, Changes in US Family Finances 2022 to 2025, table 5. 2007, 2010 and the student debt split are our calculation from the public extracts. The split starts in 2019: student loan payments were paused from 2020 to 2023, and missed payments were not reported until late 2024.
Amar Harolikar · Decision Sciences & Applied AI2 of 7tigzig.com
Slide 3
TIGZIGThe Fed survey, by income
Late payments among lower and middle incomes are back to 2010 levels
The lowest fifth is at a record. 25.3% of families with debt were two months or more late, against 21.1% in 2010.
The second and middle fifths are level with or above 2010.
Higher-income families are well below their 2010 levels.
These are survey estimates. The lowest fifth with debt is about 440 of the 4,367 families interviewed, so gaps of a point or two are within sampling error.
Families with debt two months or more late on a payment, %
2007 2010 2022 2025
21.1 25.3 Lowest fifth 15.2 15.2 Second fifth 10.4 11.8 Middle fifth 8.8 5.8 Fourth fifth 5.3 1.7 Next 10% 2.1 0.6 Top 10%
Families are ranked by income. The lowest fifth is the 20% of families with the lowest incomes, and the top 10% have the highest.
Sources and methodsFederal Reserve, historical tables, table 18: families with debt, grouped by percentile of income.
Amar Harolikar · Decision Sciences & Applied AI3 of 7tigzig.com
Slide 4
TIGZIGSince the survey
This year, borrowing costs, prices and pay have all moved against households
Rates. The 30-year mortgage rate rose from 6.15% at the end of 2025 to 7.40%, the highest since November 2023. The Fed raised rates in September.
Most existing debt is fixed. Mortgages are 70% of household debt. Cards and home equity lines are 9% and move with the Fed rate. New borrowers feel it first.
Prices and pay. Energy is up 16.3% on a year. Pay has grown slower than prices since April. Saving is the lowest since November 2022.
30-year mortgage rate, % weekly, Freddie Mac 2008 2014 2020 2026 7.79 in 2023 7.40
Inflation, % a year consumer prices, monthly 0 2008 2014 2020 2026 3.4
Hourly pay growth minus inflation percentage points, monthly 0 2008 2014 2020 2026 2020 off the scale -0.2
Saving rate, % of income monthly 2008 2014 2020 2026 2020-21 off the scale 4.1
Sources and methodsFRED MORTGAGE30US, CPIAUCSL, CES0500000003 and PSAVERT via TREMOR, 2007 to latest. Pay is all private employees. Energy: BLS, August. Debt mix: NY Fed, Q2 2026. Fed, 16 Sep.
Amar Harolikar · Decision Sciences & Applied AI4 of 7tigzig.com
Slide 5
TIGZIGCredit data
Credit union losses are well above 2019. Mortgage lates are rising.
Credit unions are well above 2019. Consumer charge-offs were 1.74% a year in Q2 2026, against about 1.1% in 2019.
Bank cards are close to 2019. Card charge-offs were 4.01% over the last four quarters, against 3.82% in 2019 and 4.62% in 2024.
Mortgage lates are still rising. New 90-day lates are the highest since Q4 2015, still below Q3 2007. Auto lates are the highest since 2010, above Q3 2007.
Bank credit card charge-offs % of balances a year, FDIC 2008 2014 2020 2026 10.77 in 2010 3.95
Credit union consumer charge-offs % of balances a year, NCUA 2008 2014 2020 2026 2.21 in 2009 1.74
Mortgages turning 90 days late % of balances a year, NY Fed 2008 2014 2020 2026 8.35 in 2009 1.52
Auto loans turning 90 days late % of balances a year, NY Fed 2008 2014 2020 2026 3.48 in 2009 3.00
Sources and methodsFDIC call reports, NCUA 5300 and NY Fed household debt via TREMOR, quarterly to Q2 2026. Charge-offs are the quarter annualised; Q2 2025 card charge-offs are unusually low in the filed totals, so cards are compared over four quarters. NY Fed lates are new flows into 90 days late. My Q2 notes: Credit Unions, NY Fed, FDIC.
Amar Harolikar · Decision Sciences & Applied AI5 of 7tigzig.com
Slide 6
TIGZIGJobs
Hiring is low and layoffs are low. People out of work stay out longer.
Unemployment is higher than in 2023. It is 4.2%, against 3.5% in January 2023. It eased this year because fewer people are in the labour force.
Jobs decide what comes next. Late payments are already at 2010 levels. Job losses would add to them.
Unemployment rate per cent
3.54.2 Jan 2023Sep 2026
Hiring rate per cent of jobs a month
4.13.3 Jan 2023Aug 2026
Layoffs rate per cent of jobs a month
1.11.0 Jan 2023Aug 2026
Jobless 15 weeks+ per cent of the labour force
1.21.8 Jan 2023Sep 2026
Time out of work median, weeks
9.611.5 Jan 2023Sep 2026
Participation per cent of adults
62.461.8 Jan 2023Sep 2026
SourcesBLS household survey and JOLTS via TREMOR, FRED series UNRATE, JTSHIR, JTSLDR, U1RATE, UEMPMED, CIVPART. Full jobs analysis: US jobs, September 2026.
Amar Harolikar · Decision Sciences & Applied AI6 of 7tigzig.com
Slide 7
TIGZIGEarlier analysis
This builds on my earlier analysis
Jobs
12 Oct Fewer young workers in the jobs most exposed to AIIn the most exposed jobs, ages 22 to 25 are down about 13% since 2022.
4 Oct US jobs in September 2026Fewer new jobs, longer searches, pay barely keeping up.
Bond markets
6 Sep Bond markets are sounding an alarmLong rates rose in the US, Europe and Japan as the Fed cut.
25 Sep The bond market rout of 2026The 10-year went above 5%, the first time since 2007.
Delinquency and losses, Q2 2026
21 Aug Household debt, NY FedAuto and mortgage lates rose while the headline fell.
27 Aug US banks, FDICAll-bank charge-offs came off their peak, still above 2019.
19 Sep Credit unions, NCUALosses above pre-crisis, lates above pre-COVID in all segments.
Data. Federal Reserve Survey of Consumer Finances 2025. FRED series via TREMOR, checked against the FRED API with no differences. FDIC, NCUA and NY Fed data via TREMOR. Data to 8 Oct 2026.
Use of AI. Parts of this work were prepared with AI under my direction. I reviewed, edited and approved every page. Every data series is pulled from the sources above. The analysis and conclusions are mine.
Amar Harolikar · Decision Sciences & Applied AI7 of 7tigzig.com
Working on something similar? How I work covers the rates, the availability and what I take on.