Many of These Macro Charts Are Showing the Same Stress They Showed Before 2007. The AI Layer Is What Is New.
Published: September 10, 2026
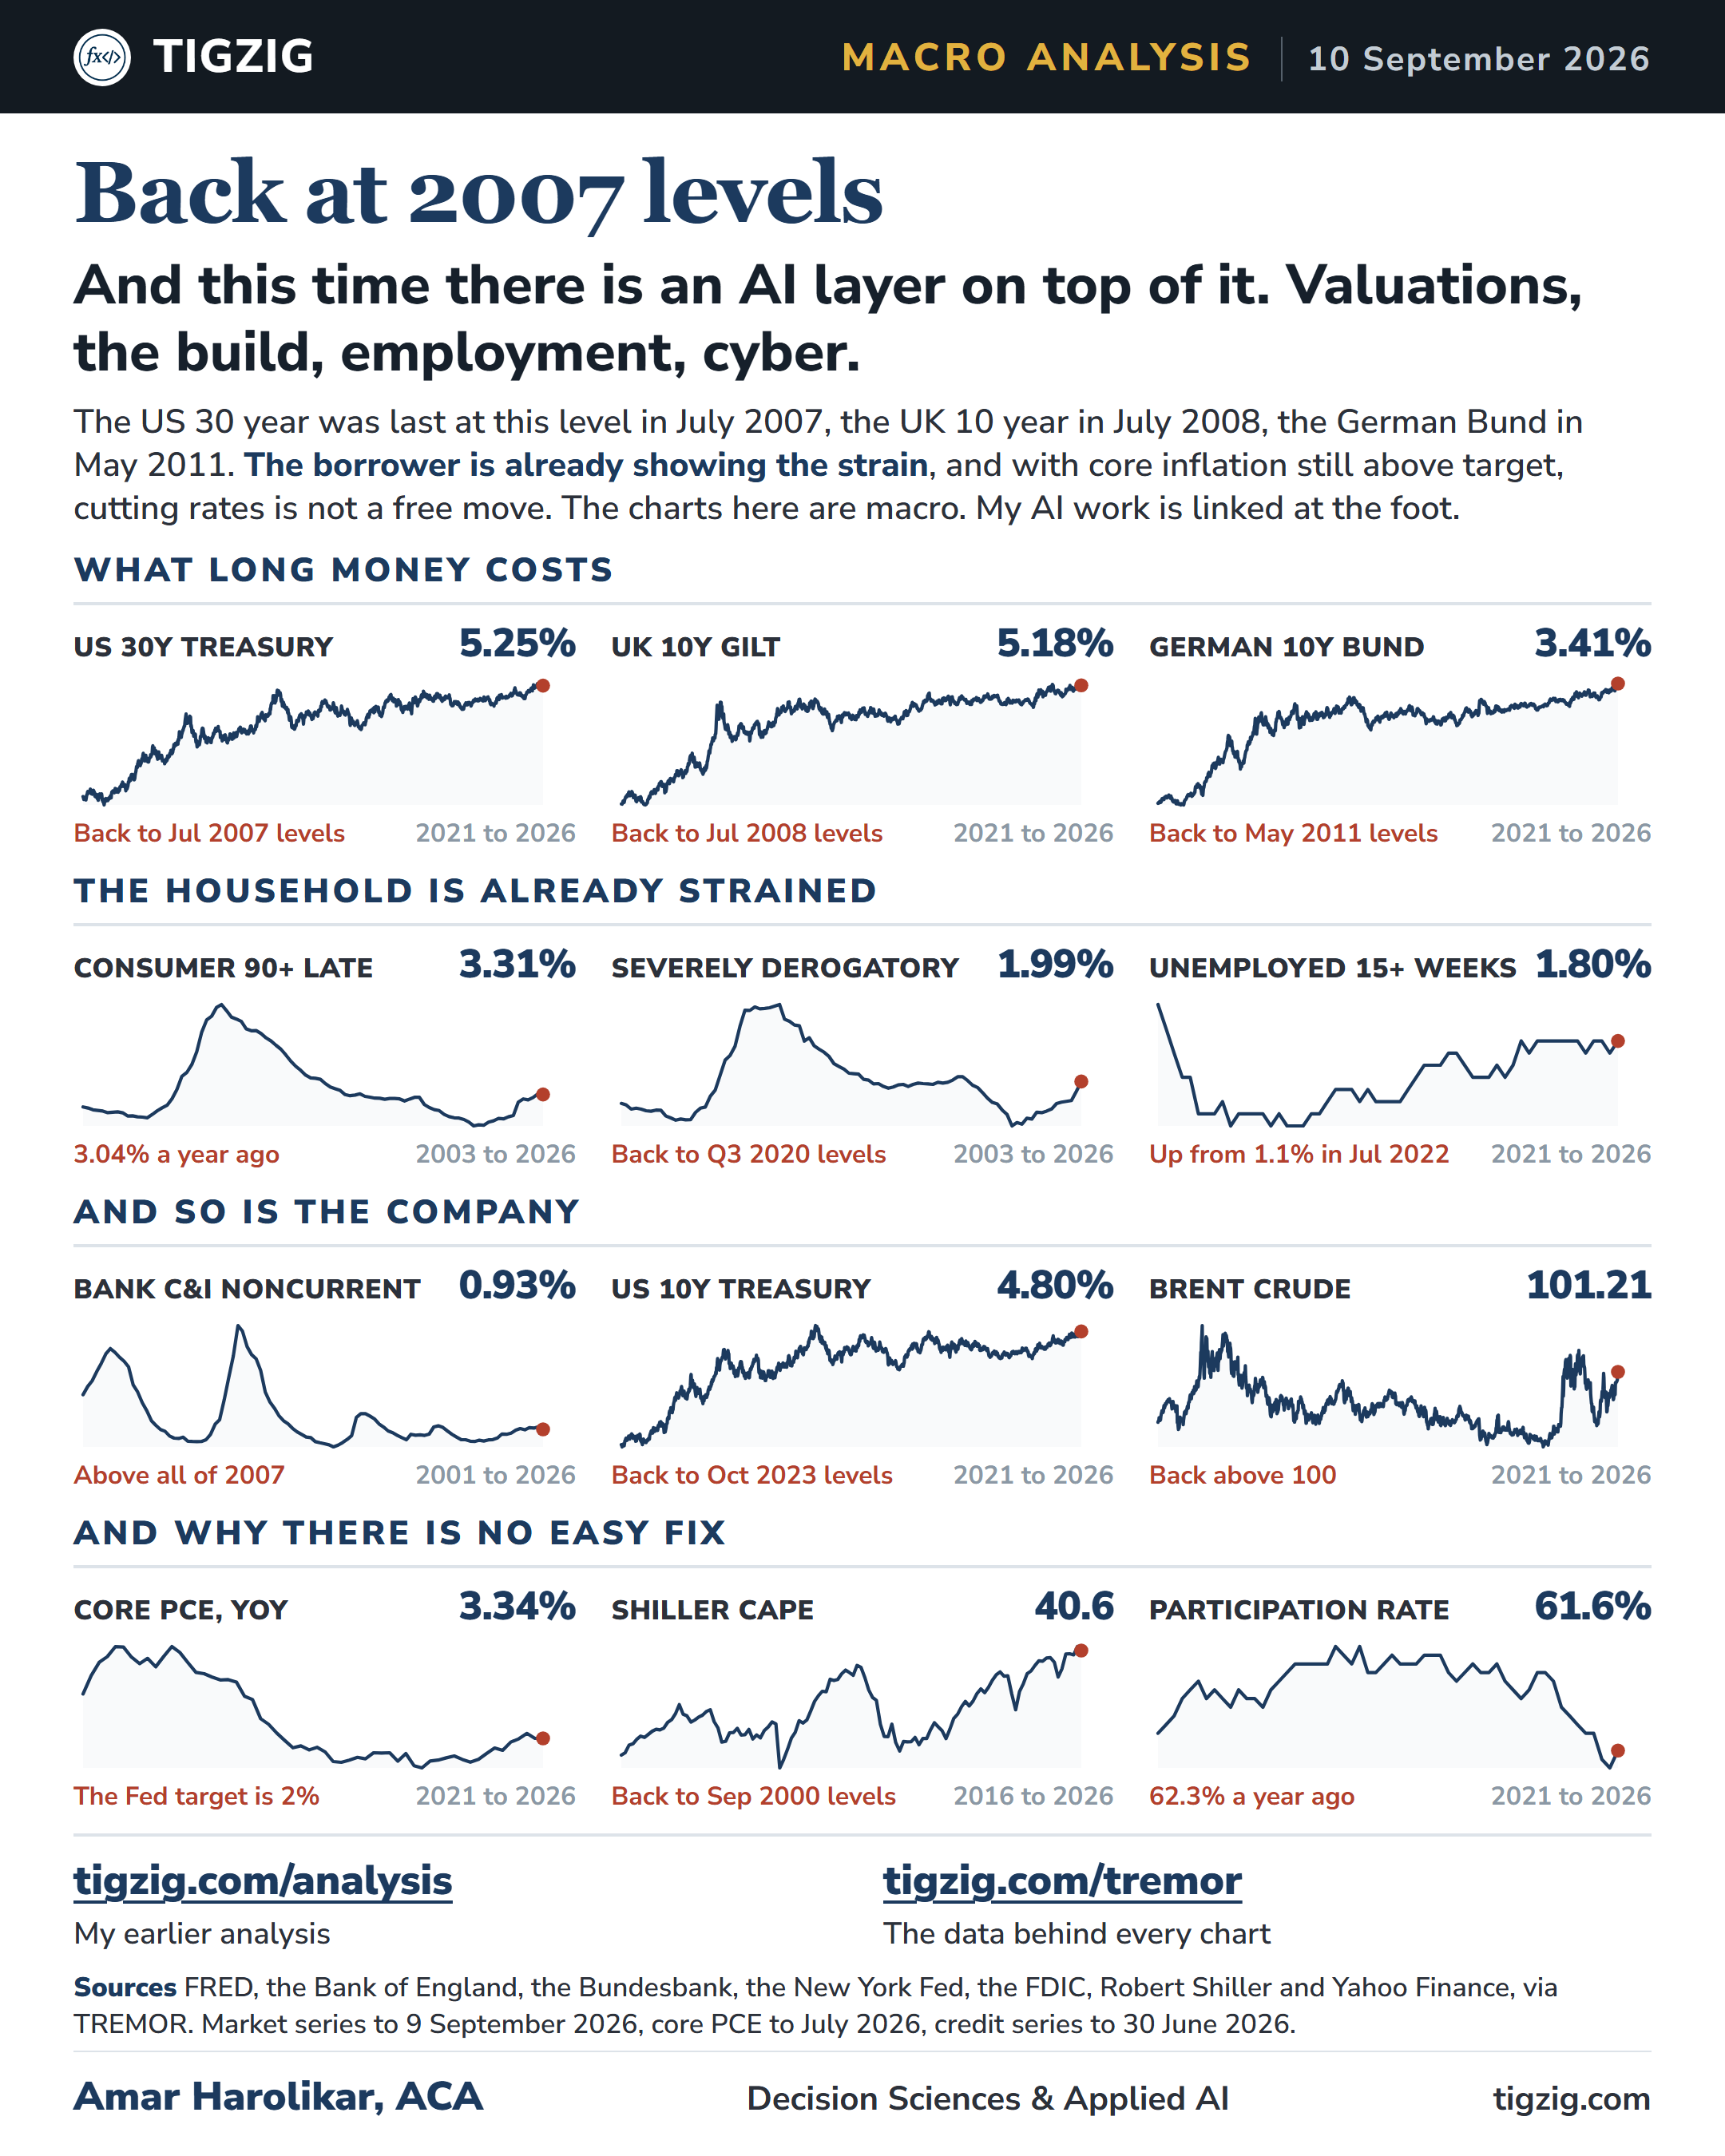
Many of these macro charts are showing the same signs of stress they were showing before the 2007 crisis. AI is the addition this time.
The US thirty year is at 5.25%, back to July 2007 levels. The UK ten year gilt is at 5.18%, back to July 2008. The German Bund at 3.41%, back to May 2011. Whatever is happening here, it is not happening in one country.
The borrower is already showing it. On NY Fed household debt data, consumer debt ninety days late is at 3.31% against 3.04% a year ago, and severely derogatory balances are back at Q3 2020 levels. On FDIC bank data, C&I noncurrent loans are at 0.93%, which is above every single quarter of 2007.
Then there is the question of what can be done about it. Core PCE is running at 3.34% against a 2% target, Brent is back above 100, the Shiller CAPE is at 40.6, and the participation rate is down to 61.6% from 62.3% a year ago. The Fed is caught in a tough place.
These are not the only stresses. Private credit is carrying its own, and the AI layer sits on top of all of it. What the build is valued at, what it does to employment, and what it is already doing to cyber risk.
This is not only my reading. Over the past few months the BIS, the IMF, the Fed, the ECB, the Bank of England, the Banque de France, the FSB, the OCC and the SEC have each put some version of it in writing. I have written those up as they came, and they are available at tigzig.com/analysis.
Charts pulled from my own TREMOR app: tigzig.com/tremor
The Fed is caught
Kevin Warsh said at Jackson Hole in August that this summer's PCE and CPI readings came in better than expected, but do not tell him that underlying trends have meaningfully improved. His standard, in his own words: "We must be confident that underlying inflation is moving to our objective, clearly and at sufficient speed. Otherwise, we have work to do."
The FOMC meets on 15 and 16 September. The President who appointed him has been pressing publicly for cuts.
Raise, and it presses harder on a borrower who is already slipping. Hold or cut, and it is done with core inflation at 3.34% and oil back over 100.
The speech in full: federalreserve.gov/newsevents/speech/warsh20260828a.htm
Some previous related analysis
All of it is at tigzig.com/analysis. Quick links:
- Bond markets sounding an alarm
- And the Chair of the Financial Stability Board, writing to the G20 last month in language that does not hedge
- Supervisors moved from writing warnings to running stress tests
- The Fed's own Financial Stability Report, which named four of the six stress points I had been tracking
- And the BIS, on the AI boom, from a central bank vantage point
- On valuation and irrational exuberance
- And on the AI build, which is financed on debt
Working on something similar? How I work covers the rates, the availability and what I take on.