US Housing: The Cracks Widen
Published: November 20, 2026
The monthly payment on a typical home bought today is more than double what it was in 2019, and more existing mortgages are falling behind. Almost all Fed officials expect more rate rises, which could widen the cracks in mortgages and in the housing market.
Key points:
Nine of 11 housing measures are weak. Only resale prices are holding up.
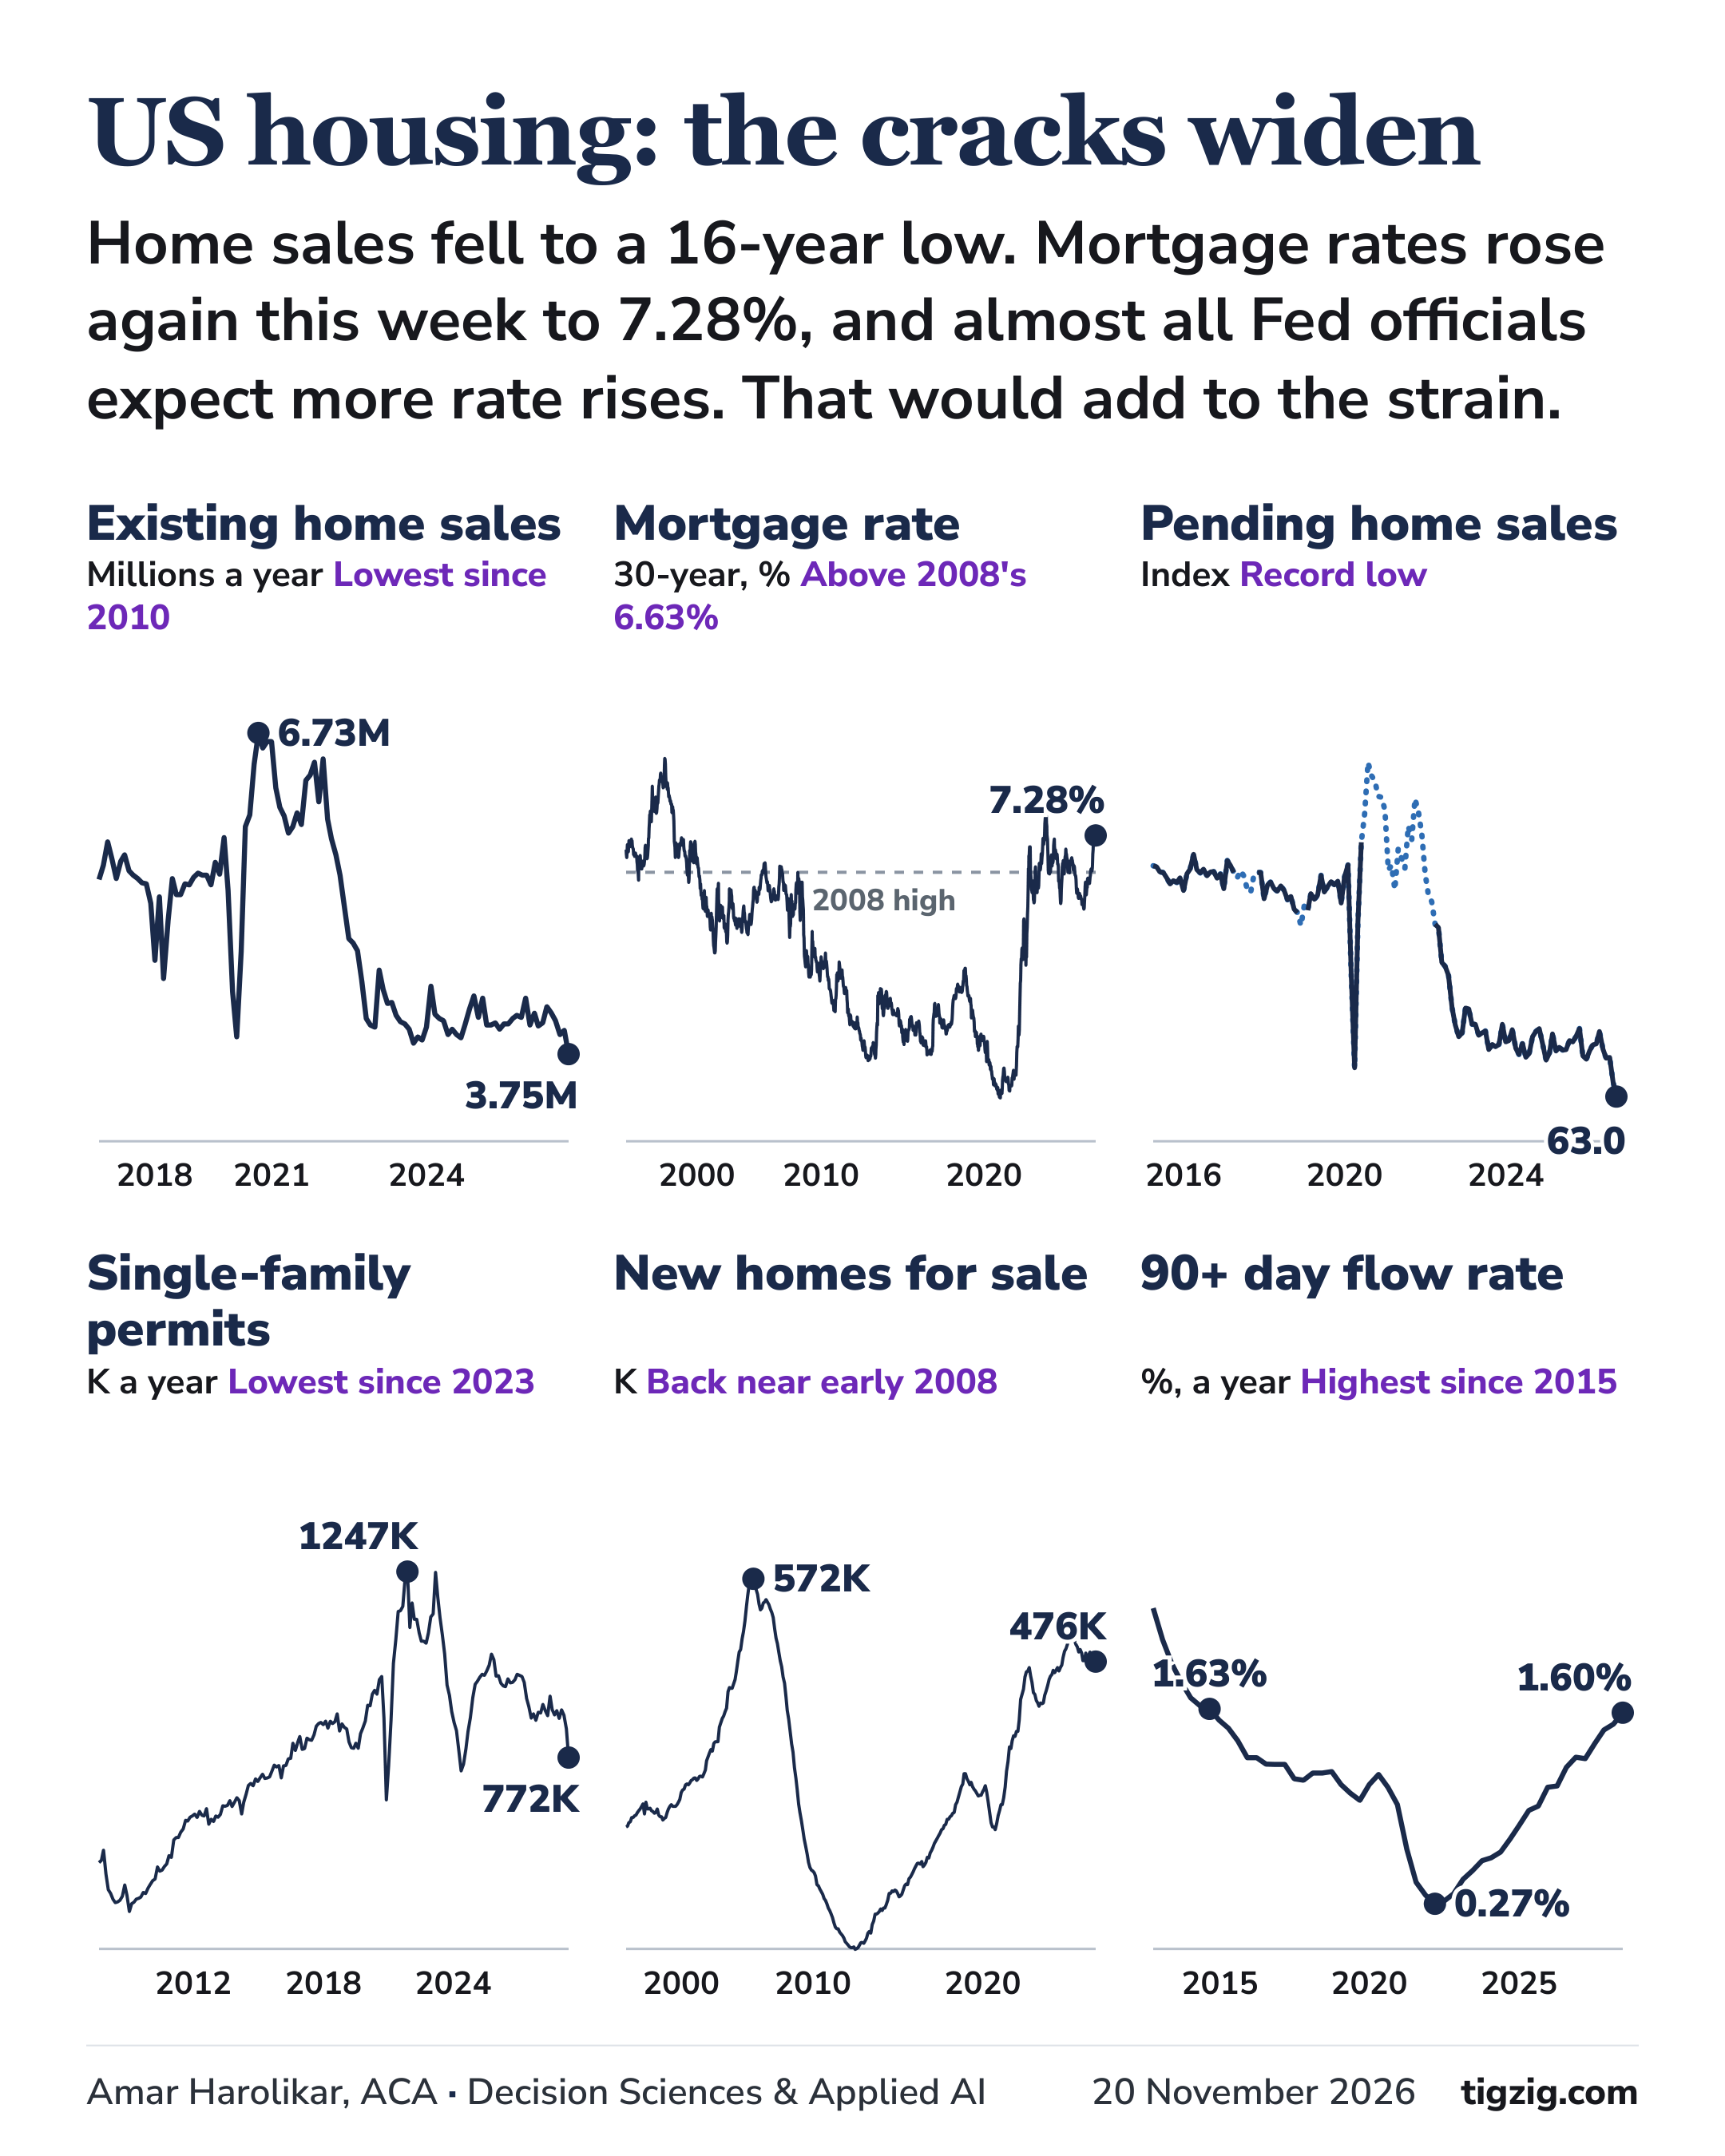
Home sales are at a 16-year low, and pending sales at a record low.
Unsold new homes are still at 2008 levels.
The national median new-home price is now below the existing one.
Residential investment is the smallest share of the economy since 2015, and Goldman forecasts a further fall.
More mortgages are falling behind.
Other angles: starts and new home sales are holding up, and resale prices are falling after inflation.
Other analysis at: https://www.tigzig.com/analysis
A few data points
The payment uses NAR's median existing price, Freddie Mac's average rate for the month, 20% down and 30 years, principal and interest only. Since 2019 higher prices and a higher rate have each added about half, roughly $680 and $590, averaged over both orders. Zillow's own estimate is $2,004, up 12.8% YoY (CNBC, 9 Nov), against my 12%.
Residential investment is BEA's first estimate for Q3 and is flat in dollars, down 0.5% YoY while GDP grew 5.9%. The second estimate is due on 25 Nov.
The 90+ figure is the NY Fed's four-quarter sum of balances turning 90+ days late: 1.60% in Q3 2026 against 8.35% in Q3 2009, and above every quarter from 2016 to 2019.
BLS has no October 2025 prices. Pay against prices uses the 13 months from Sep 2025: hourly pay up 3.5%, weekly pay and prices about 4.1%.
This updates my analysis of 22 Oct 2026, with the latest jobs report and household debt piece alongside. https://www.tigzig.com/post/us-housing-freeze-oct2026 https://www.tigzig.com/post/us-jobs-october-2026-update-nov2026 https://www.tigzig.com/post/us-household-debt-delinquency-mortgages-starting-to-crack-nov2026
Earlier on US consumers and late payments, 12 Oct. https://www.tigzig.com/post/us-consumer-pressure-late-payments-oct2026
This is my analysis of public sources, for information only. Not investment advice
US Housing: The Cracks Widen
Browse the slides or download the PDF
Full Deck Content (Text Format)
Text below was extracted from the source deck. Chart visuals stay in the PDF and as slide images above the post.
Slide 1
US housing: the cracks widen
Home sales fell to a 16-year low. Mortgage rates rose again this week to 7.28%, and almost all Fed officials expect more rate rises. That would add to the strain.
Existing home sales Millions a year Lowest since 2010 2018 2021 2024 6.73M 3.75M
Mortgage rate 30-year, % Above 2008's 6.63% 2000 2010 2020 2008 high 7.28%
Pending home sales Index Record low 2016 2020 2024 63.0
Single-family permits K a year Lowest since 2023 2012 2018 2024 1247K 772K
New homes for sale K Back near early 2008 2000 2010 2020 572K 476K
90+ day flow rate %, a year Highest since 2015 2015 2020 2025 1.63% 0.27% 1.60%
Amar Harolikar, ACA · Decision Sciences & Applied AI20 November 2026tigzig.com
Slide 2
The numbers at a glance
Nine of 11 housing measures are weak. Only resale prices are holding up
Existing home sales are at 3.75 million, the lowest since August 2010 (NAR). Pending home sales are the lowest since NAR's index began in 2001, and builders are the gloomiest since 2012.
Mortgage rates rose to 7.28% this week. Resale prices are still rising, and the 90+ day flow rate is the highest since 2015.
| Measure | Latest | Status | Last 3 months |
|---|---|---|---|
| Mortgage rate, 30-year | 7.28% Nov 19 | Weak | |
| Pending home sales, YoY | -16.7% Oct | Weak | |
| Existing homes sold, a year | 3.75M Oct | Weak | |
| Builder sentiment (NAHB) | 25 Nov | Weak | |
| Single-family permits | 772K Oct | Weak | |
| Single-family starts | 864K Oct | Weak | |
| New homes sold, a year | 676K Sep | Mixed | |
| Unsold new homes, months | 8.4 Sep | Weak | |
| Resale prices, YoY | +2.1% Aug | Holding | |
| Mortgages 90+ days late | 1.13% Q3 | Weak | |
| 90+ day flow rate, a year | 1.60% Q3 | Weak |
Status the latest reading against the 2018-19 average and a year ago: Weak worse than both, Mixed worse than one.
Last 3 months worse little change better. Holding: resale prices still rising. Pending sales are compared with a year ago only.
SourcesFRED (Census, Freddie Mac, S&P Cotality Case-Shiller, NAR). NAR pending sales, 18 Nov. NAR existing-home sales, 12 Nov. NAHB/Wells Fargo HMI. NY Fed household debt.
Amar Harolikar · Decision Sciences & Applied AI2 of 13tigzig.com
Slide 3
Mortgage rates
Mortgage rates are 7.28%, and the Fed expects more rate rises
30-year mortgage rate %, weekly, since 1998. 2023 peak 7.79% 2000 2010 2020 8.64% 2.65% 7.79% 7.28%
2026, week by week Mortgage 10-year, % Jan Apr Jul Oct 5.98% 7.28%
A typical home's monthly payment is $2,292, more than double 2019
Monthly payment $ a month, median home. Dashed: 2019 average 2018 2022 2026 $923 $2,292
What raised the payment $ a month. Price +54%, rate 3.9% to 7.3% $1,021 2019 average +$683 Higher prices +$588 Higher rates $2,292 Oct 2026
SourcesFreddie Mac PMMS and Treasury via FRED (MORTGAGE30US, DGS10). Payment is my calculation: NAR median price, the month's average rate, 20% down, 30 years, principal and interest. Each effect is averaged over both orders.
Amar Harolikar · Decision Sciences & Applied AI3 of 13tigzig.com
Slide 4
Existing homes
Pending home sales fell to 63.0 in October, a record low for NAR's index
- ListedHomes for sale Realtor.com listings, YoY %. 1.18M in Oct
- 2018 2022 2026 -53.7% +67.2% +7.4%
- Contract Pending sales Index level, adjusted. NAR tables NAR releases 2016 2019 2022 2025 132.8 63.0
Pending sales, YoY % change on the same month a year ago, same index 2017 2020 2023 2026 -16.7%
- Closed Home sales NAR existing homes, YoY %. 3.75M a year in Oct 2019 2022 2025 -8.8%
Pending sales fell in every region, the West most (20.3%). Over 95% of borrowers have a rate below today's (CNBC), so few sell. The other side: NAR says distressed sales are only 2%.
SourcesNAR existing-home sales, 12 Nov. NAR Pending Home Sales Index (Oct 2026; history compiled from NAR reports). Realtor.com via FRED (ACTLISCOUUS).
Amar Harolikar · Decision Sciences & Applied AI4 of 13tigzig.com
Slide 5
New homes: building
Builders are the gloomiest since 2012. Single-family permits are the lowest since January 2023
Builder sentiment NAHB index, 0 to 100, since 1985. Dashed: 50
- 1990 2005 2020 72 8 90 25
Single-family permits K a year, since 2010. Dashed: 2019 avg. 2005 peak 1,798K 2010 2015 2020 2025 1247K 772K
Single-family starts K a year, since 2010. Dashed: 2019 avg 889K 2010 2015 2020 2025 1273K 864K
Permits are down 38% from the January 2021 peak and 12.9% year on year. Starts are down 3.2%. Many builders are still trying to sell, says Nationwide.
- 46% of builders cut prices in November, a post-Covid high, by 6% on average. 68% used incentives.
SourcesNAHB/Wells Fargo HMI. Census new residential construction, 18 Nov. Census via FRED (PERMIT1, HOUST1F).
Amar Harolikar · Decision Sciences & Applied AI5 of 13tigzig.com
Slide 6
New homes: unsold inventory
Unsold new homes are still at 2008 levels
Months' supply, new homes Months to sell them at today's pace. Dashed: 2018-19 avg 6.0
- 2000 2010 2020 12.2 3.3 8.4
Finished new homes for sale Inventory, K, since 1999. Dashed: 2018-19 avg 72K 2000 2010 2020 194K 128K 111K
All new homes for sale Inventory, K, since 1998. Dashed: 2018-19 avg 322K 2000 2010 2020 572K 142K 506K 476K
New homes sold, YoY Census, 3-month average, % change. 676K a year in Sep 2012 2016 2020 2024 +43.6% -2.8%
476K new homes are for sale, the level of February 2008, down from 506K in Mar 2025. Builders are cutting prices.
SourcesCensus via FRED (MSACSR, HNFSEPUSSA, NHFSEPCS, HSN1F). CNBC 20 Oct.
Amar Harolikar · Decision Sciences & Applied AI6 of 13tigzig.com
Slide 7
New home prices
The national median new-home price is now below the existing one
New minus existing price My calculation, median $K by year. 2026: Jan to Sep +71 ’15 +74 ’18 ’21 ’24 +0 -14 2026
- New vs existing price New Existing, $, monthly 2018 2020 2022 2024 2026
Median new home price $ and YoY %, since 2017 $460K $400K 2018 2022 2026 +25.8% -3.9%
The premium fell from $74K in 2017 to about zero in 2025. New has cost less for 7 months in a row.
- Not like for like: 61% of new homes sold in September were in the South, where the existing median was $361K ($418K nationally). Census puts the -3.9% YoY fall within its margin of error (±8.9%).
SourcesCensus via FRED (MSPNHSUS). NAR existing-home sales (Oct 2026). Medians not seasonally adjusted.
Amar Harolikar · Decision Sciences & Applied AI7 of 13tigzig.com
Slide 8
Home building and the economy
Residential investment is 3.6% of the economy, the smallest share since 2015. Goldman sees it falling for three quarters
Residential investment, share of GDP %, quarterly since 1947
- 1950 1970 1990 2010 7.3% 2.4% 3.6%
Goldman Sachs forecasts residential investment to fall 2.5%, 4% and 1% over the next three quarters.
In dollars it is flat: down 0.5% year on year while GDP grew 5.9%, so its share shrinks as the economy grows.
Fed minutes (18 Nov): several officials noted housing is weak and AI building strong. Almost all expect more rate rises.
SourcesBEA via FRED (PRFI, GDP). CNBC 20 Oct (Goldman). Fed minutes, 18 Nov.
Amar Harolikar · Decision Sciences & Applied AI8 of 13tigzig.com
Slide 9
Prices and late payments
Prices are at a record, rising slowly
Home prices, the level Case-Shiller index, since 2019 2020 2022 2024 2026 207 334
YoY change %, since 1988. Above zero: up 1990 2005 2020 -12.6% +20.7% +2.1%
More mortgages are falling behind
Turning 30+ days late %, a year. Highest since 2015 2013 2019 2025 4.09% 1.39% 3.97%
90+ day flow rate %, a year. Highest since 2015 2013 2019 2025 1.63% 0.27% 1.60%
Both flows are far below 2009 (8.4% and 12.4%). Against their 2003-06 averages, the 90+ flow is above (1.4%) and the 30+ flow is below (5.0%).
SourcesS&P Cotality via FRED (CSUSHPISA). NY Fed household debt, Q3 2026. Flows: % of mortgage balances turning late in the year.
Amar Harolikar · Decision Sciences & Applied AI9 of 13tigzig.com
Slide 10
Household budgets
Stretched households: longer searches, hourly pay behind prices, less saved
Unemployment rate %. Eased from 4.5%, above 2023 2024 2025 2026 3.4% 4.5% 4.1%
Typical time out of work Median weeks. Up from 8.4 2024 2025 2026 8.4 11.9
Hourly pay minus prices YoY points. Behind for 6 months 2023 2024 2025 2026 +1.83 -0.56
Saving rate % of income. Lowest since 2022 2024 2025 2026 7.2% 3.8%
Dashed: 2018-19 average. No October year-on-year (no October 2025 prices). Sep 2025 to Oct 2026: hourly pay +3.5%, weekly pay and prices about +4.1%.
SourcesBLS and BEA via FRED (UNRATE, UEMPMED, CES0500000003, CES0500000011, CPIAUCSL, PSAVERT). No October 2025 data (government shutdown).
Amar Harolikar · Decision Sciences & Applied AI10 of 13tigzig.com
Slide 11
Other angles
Other angles: some positives, and another way to read prices
Total housing starts rose 9.9% in October to 1.31 million, within Census's margin of error. 433K of that was buildings with five or more units, and single-family starts are down 3.2% year on year.
New home sales, 676K a year in September, are above their 2018-19 average of 649K.
The Fed's minutes say activity is expanding at a strong pace, supported by resilient household spending.
Zillow puts the monthly payment on the typical US home at $2,004 in October, up 12.8% year on year. Its chief economist expects the slowdown to ease after December.
In real terms, resale prices are falling. Case-Shiller was up 2.1% year on year in August, and consumer prices were up 3.4%.
SourcesCensus new residential construction, 18 Nov. Census new residential sales, 24 Sep. FRED (HOUST, HOUST5F, HSN1F, CSUSHPISA, CPIAUCSL). Fed minutes, 18 Nov. CNBC 9 Nov (Zillow).
Amar Harolikar · Decision Sciences & Applied AI11 of 13tigzig.com
Slide 12
Terms and sources
What the terms in this deck mean, in simple words
These are plain-language summaries. For the exact definitions see Census release notes, NAR methodology for pending and existing home sales, and the Realtor.com data dictionary.
New homes, built by builders
Permit▶Start▶Under construction▶Finished
Sold can happen at any stage. The Census counts a new home as sold when a deposit is taken or a sales agreement is signed, even before the permit. Homes for sale is the builders' inventory: not started, under construction or finished. Months' supply is homes for sale divided by the month's sales pace.
Existing homes, resold by owners
Listed for sale▶Contract signed▶Sale closed
NAR's pending home sales index tracks contracts signed in the month. A sale usually closes one or two months later. Homes for sale are listings on the market with no contract yet. Once a contract is signed a home leaves that count and becomes a pending sale.
Sources
Census: permits, starts, new home sales, new homes for sale and their prices.
NAR (the realtors' association): existing home sales, pending sales, existing home prices.
Realtor.com (a listings website, via FRED): homes for sale, pending listings.
NAHB/Wells Fargo: a monthly survey of builders. Freddie Mac: the weekly 30-year mortgage rate.
S&P Cotality Case-Shiller: prices of the same homes sold again. NY Fed: household debt, from Equifax credit records.
BEA: GDP, saving. BLS: jobs, pay, prices. Treasury: the 10-year yield.
SourcesCensus new residential sales release, September 2026 (27 Oct). NAR pending sales, 18 Nov.
Amar Harolikar · Decision Sciences & Applied AI12 of 13tigzig.com
Slide 13
US housing has many angles. Here is my earlier analysis on each
The first partOctUS Housing, October 2026: Mortgage Rates Above 2007-08 AI and the economy NovA Bust Is Likely Before AI Pays Off. The Red Flags Keep Piling Up NovThe Warnings on the AI Bubble Keep Getting Stronger
Mortgages and household debt NovUS Household Debt Delinquency: Mortgages Are Starting to Crack
US consumer and jobs NovJob gains bounced back. Households are still squeezed. OctUS Consumers: The Pressure Is Building, Not Yet Breaking
The Fed and bonds SepThe Fed Is Caught. The Market Has Already Made Most of the Decision for It. SepBond Markets Have Been Warning for Months. Now They Have Started Acting.
More at tigzig.com ➜ Analysis
Not investment advice. This is my analysis of public sources, for information only. Care has been taken, but errors are possible. Use of AI. Parts of this work were prepared with AI under my direction. I reviewed, edited and approved every page. The analysis, conclusions and judgment are mine.
Amar Harolikar · Decision Sciences & Applied AI13 of 13tigzig.com
Working on something similar? How I work covers the rates, the availability and what I take on.